Copper: Between Structural Demand and Geopolitical Tension from Iran
Ion Jauregui – Analyst at ActivTrades
The copper market shows a mixed scenario, where strong global demand combines with the pressure of geopolitical uncertainty. Structural demand remains solid, driven by the energy transition, electrification, electric vehicles, and construction. In the long term, growth of over 40% is projected by 2040, consolidating copper as a critical metal for the green and digital economy.
China, the world’s largest consumer, shows mixed signals. Concentrate imports show slight increases, while refined copper imports have fallen 16.1% in the first months of 2026, reflecting resistance to high prices and precautionary buying. Despite relatively high inventories in LME and Shanghai, a structural deficit in refined supply persists, generating short-term volatility.
Geopolitically, the escalation of the conflict with Iran adds pressure to the market. Although production is not directly affected, possible logistical interruptions and shortages of inputs, such as sulfuric acid, could impact supply, temporarily pressuring prices. Analysts indicate that prolonged tension could push prices back toward USD 12,000 per ton, while a de-escalation could drive levels to USD 13,500‑14,000.
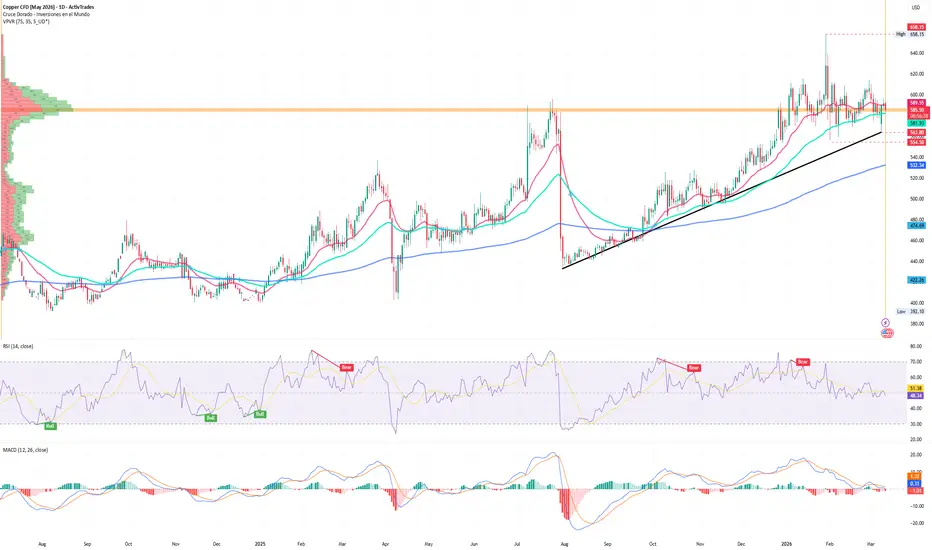
Copper Futures Analysis (Ticker AT: Copper May 2026)
Technically, copper reached a recent high of USD 658.15 on January 29 and a low of USD 554.50 on February 2, with an average of USD 588, coinciding with the point of control area. Throughout the quarter, the price has formed a consolidation range, with a low this week at USD 653.80, showing that buyers are defending key levels. The current consolidation reflects a balance between buyers and sellers, while technical supports and resistances mark the path for the coming weeks.
The 50-day moving average was surpassed this European morning, still supporting the price above the 100-day moving average. If the price holds above 581, we could see a new upward impulse toward USD 620; if this level does not hold, the support zones at 563.80 and 554.50 USD will be the next levels to test. Currently, the RSI indicator is in neutral territory, and the MACD has entered negative territory, indicating a lack of upward momentum.
In conclusion, copper maintains a structural bullish bias due to long-term demand, although geopolitical volatility and price consolidation suggest caution in the short term.
*******************************************************************************************
The information provided does not constitute investment research. The material has not been prepared in accordance with the legal requirements designed to promote the independence of investment research and such should be considered a marketing communication.
All information has been prepared by ActivTrades ("AT"). The information does not contain a record of AT's prices, or an offer of or solicitation for a transaction in any financial instrument. No representation or warranty is given as to the accuracy or completeness of this information.
Any material provided does not have regard to the specific investment objective and financial situation of any person who may receive it. Past performance and forecasting are not a synonym of a reliable indicator of future performance. AT provides an execution-only service. Consequently, any person acting on the information provided does so at their own risk. Political risk is unpredictable. Central bank actions can vary. Platform tools do not guarantee success.
Ion Jauregui – Analyst at ActivTrades
The copper market shows a mixed scenario, where strong global demand combines with the pressure of geopolitical uncertainty. Structural demand remains solid, driven by the energy transition, electrification, electric vehicles, and construction. In the long term, growth of over 40% is projected by 2040, consolidating copper as a critical metal for the green and digital economy.
China, the world’s largest consumer, shows mixed signals. Concentrate imports show slight increases, while refined copper imports have fallen 16.1% in the first months of 2026, reflecting resistance to high prices and precautionary buying. Despite relatively high inventories in LME and Shanghai, a structural deficit in refined supply persists, generating short-term volatility.
Geopolitically, the escalation of the conflict with Iran adds pressure to the market. Although production is not directly affected, possible logistical interruptions and shortages of inputs, such as sulfuric acid, could impact supply, temporarily pressuring prices. Analysts indicate that prolonged tension could push prices back toward USD 12,000 per ton, while a de-escalation could drive levels to USD 13,500‑14,000.
Copper Futures Analysis (Ticker AT: Copper May 2026)
Technically, copper reached a recent high of USD 658.15 on January 29 and a low of USD 554.50 on February 2, with an average of USD 588, coinciding with the point of control area. Throughout the quarter, the price has formed a consolidation range, with a low this week at USD 653.80, showing that buyers are defending key levels. The current consolidation reflects a balance between buyers and sellers, while technical supports and resistances mark the path for the coming weeks.
The 50-day moving average was surpassed this European morning, still supporting the price above the 100-day moving average. If the price holds above 581, we could see a new upward impulse toward USD 620; if this level does not hold, the support zones at 563.80 and 554.50 USD will be the next levels to test. Currently, the RSI indicator is in neutral territory, and the MACD has entered negative territory, indicating a lack of upward momentum.
In conclusion, copper maintains a structural bullish bias due to long-term demand, although geopolitical volatility and price consolidation suggest caution in the short term.
*******************************************************************************************
The information provided does not constitute investment research. The material has not been prepared in accordance with the legal requirements designed to promote the independence of investment research and such should be considered a marketing communication.
All information has been prepared by ActivTrades ("AT"). The information does not contain a record of AT's prices, or an offer of or solicitation for a transaction in any financial instrument. No representation or warranty is given as to the accuracy or completeness of this information.
Any material provided does not have regard to the specific investment objective and financial situation of any person who may receive it. Past performance and forecasting are not a synonym of a reliable indicator of future performance. AT provides an execution-only service. Consequently, any person acting on the information provided does so at their own risk. Political risk is unpredictable. Central bank actions can vary. Platform tools do not guarantee success.
Disclaimer
The information and publications are not meant to be, and do not constitute, financial, investment, trading, or other types of advice or recommendations supplied or endorsed by TradingView. Read more in the Terms of Use.
Disclaimer
The information and publications are not meant to be, and do not constitute, financial, investment, trading, or other types of advice or recommendations supplied or endorsed by TradingView. Read more in the Terms of Use.