1. Market Structure & Character Shifts
The chart indicates a transition from a distribution phase to an accumulation phase.
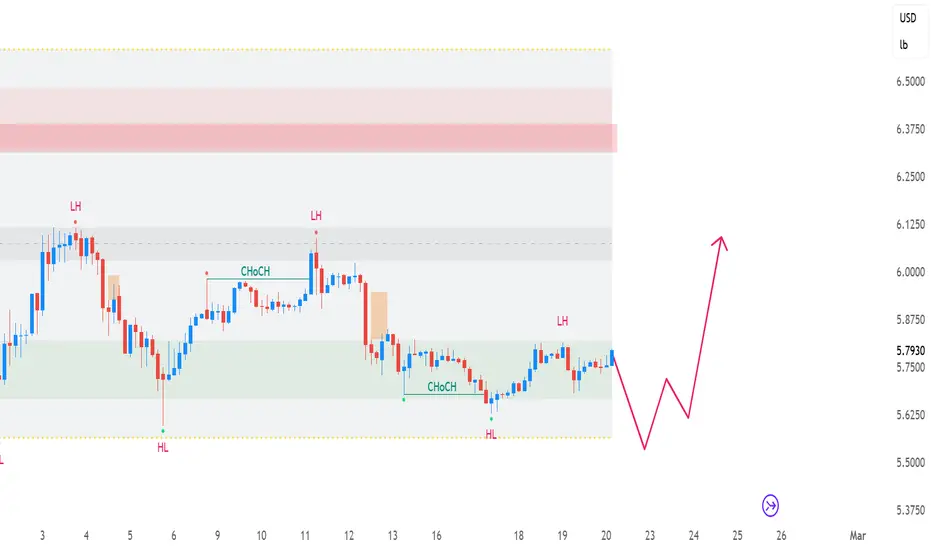
Change of Character (CHoCH): The most critical observation is the internal shift around the 13th–17th. After a series of Lower Highs (LH), the price failed to create a lower low, instead establishing a Higher Low (HL). This is a technical "break in soul" for the bears, suggesting the previous downward momentum is being absorbed by buy-side liquidity.
Compression: We are seeing a narrowing range. When price "squeezes" between established highs and lows, it typically precedes a high-velocity expansion. The current consolidation at 5.7850 represents an equilibrium point where the market is waiting for a fresh fundamental catalyst.
2. Liquidity and Order Flow
The red projection line on your chart identifies a high-probability Liquidity Sweep scenario.
The "Stop Run": Markets often move toward where the most "pain" is for retail traders. There is likely a cluster of "Sell Stops" sitting just below the 5.6250 HL.
The Thesis: The projected path suggests a brief dip into the 5.5000 area to "wash out" weak long positions and grab the necessary liquidity to fuel a move back toward the 6.1250 supply zone.
Order Flow: The green-shaded area is acting as a Mitigation Block. Price is returning to this level to "clear" old orders before the next trend leg begins.
3. Volatility and Target Mapping
The report identifies a clear imbalance between the current price and the overhead supply.
Upper Convergence: The red-shaded box (6.3750+) represents a significant "sell-off" origin point. Until the price reaches that zone, the path of least resistance—following a successful liquidity sweep—is upward.
Mean Reversion: The grey zone near 6.0000 acts as the "Fair Value" for this current range. We expect the price to gravitate back to this median before a final decision is made on whether to challenge the 6.5000 highs.
Summary of the Outlook
The chart shows a market that is exhausting its bearish trend. The presence of the HL (Higher Low) and the CHoCH suggests that the "smart money" is no longer interested in selling at these sub-5.8000 prices. The primary risk to this report is a daily candle close below 5.5000, which would invalidate the reversal thesis and signal a deeper structural breakdown.
The chart indicates a transition from a distribution phase to an accumulation phase.
Change of Character (CHoCH): The most critical observation is the internal shift around the 13th–17th. After a series of Lower Highs (LH), the price failed to create a lower low, instead establishing a Higher Low (HL). This is a technical "break in soul" for the bears, suggesting the previous downward momentum is being absorbed by buy-side liquidity.
Compression: We are seeing a narrowing range. When price "squeezes" between established highs and lows, it typically precedes a high-velocity expansion. The current consolidation at 5.7850 represents an equilibrium point where the market is waiting for a fresh fundamental catalyst.
2. Liquidity and Order Flow
The red projection line on your chart identifies a high-probability Liquidity Sweep scenario.
The "Stop Run": Markets often move toward where the most "pain" is for retail traders. There is likely a cluster of "Sell Stops" sitting just below the 5.6250 HL.
The Thesis: The projected path suggests a brief dip into the 5.5000 area to "wash out" weak long positions and grab the necessary liquidity to fuel a move back toward the 6.1250 supply zone.
Order Flow: The green-shaded area is acting as a Mitigation Block. Price is returning to this level to "clear" old orders before the next trend leg begins.
3. Volatility and Target Mapping
The report identifies a clear imbalance between the current price and the overhead supply.
Upper Convergence: The red-shaded box (6.3750+) represents a significant "sell-off" origin point. Until the price reaches that zone, the path of least resistance—following a successful liquidity sweep—is upward.
Mean Reversion: The grey zone near 6.0000 acts as the "Fair Value" for this current range. We expect the price to gravitate back to this median before a final decision is made on whether to challenge the 6.5000 highs.
Summary of the Outlook
The chart shows a market that is exhausting its bearish trend. The presence of the HL (Higher Low) and the CHoCH suggests that the "smart money" is no longer interested in selling at these sub-5.8000 prices. The primary risk to this report is a daily candle close below 5.5000, which would invalidate the reversal thesis and signal a deeper structural breakdown.
Trade active
Trade closed: target reached
Market Analyst | XAUUSD (Gold)
Technical analysis, price-action breakdowns, and strategic market perspectives.
For additional setups and exclusive updates, join via the Telegram link.
t.me/XAU_CAPTAL
Technical analysis, price-action breakdowns, and strategic market perspectives.
For additional setups and exclusive updates, join via the Telegram link.
t.me/XAU_CAPTAL
Disclaimer
The information and publications are not meant to be, and do not constitute, financial, investment, trading, or other types of advice or recommendations supplied or endorsed by TradingView. Read more in the Terms of Use.