1973 vs 2026: Is Stagflation Repeating?Let’s run an experiment. Read the following text twice: first, focus on the history (before the slash); then, focus on today’s reality (after the slash):
In 1965 / 2022 , the US attempted the impossible: funding the Vietnam War / Ukraine & Israel conflicts , while maintaining the "Great Society" / COVID stimulus & "Green Deal" programs without raising taxes. The result: an explosion in money supply and the first inflation wave.
In 1971 / 2025 , the second blow landed – the end of Bretton Woods / the rise of BRICS+ and de-dollarization . The dollar-gold link was severed, and silver staged a 215% / 325% parabolic jump in less than a year.
Two years later, after the US backed Israel in the Yom Kippur War / Iran escalation , the East hit back with an oil embargo / closure of the Strait of Hormuz . Energy prices quadrupled, the economy locked into stagflation, and gold began its historic ascent.
Oops... The last sentence is a SPOILER. It happened back then, but it's different now, right? Or is it?
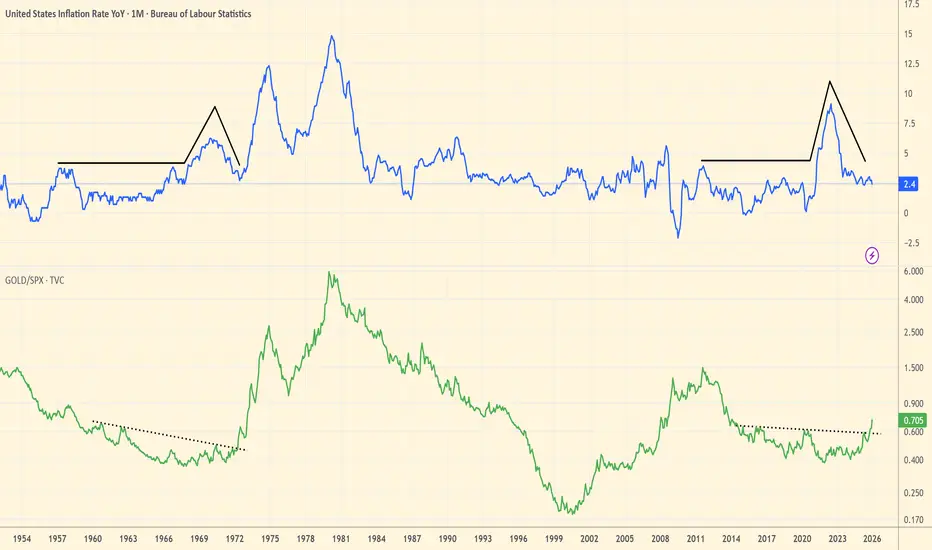
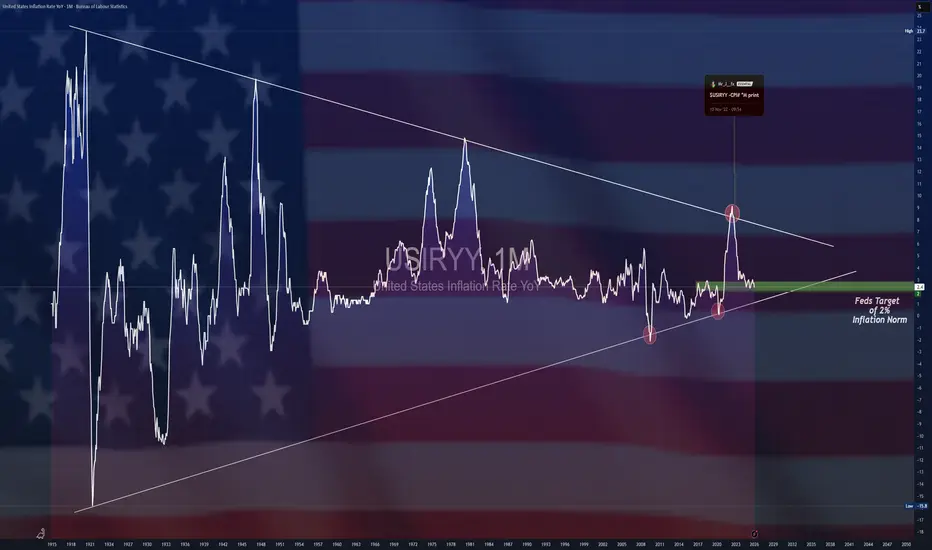
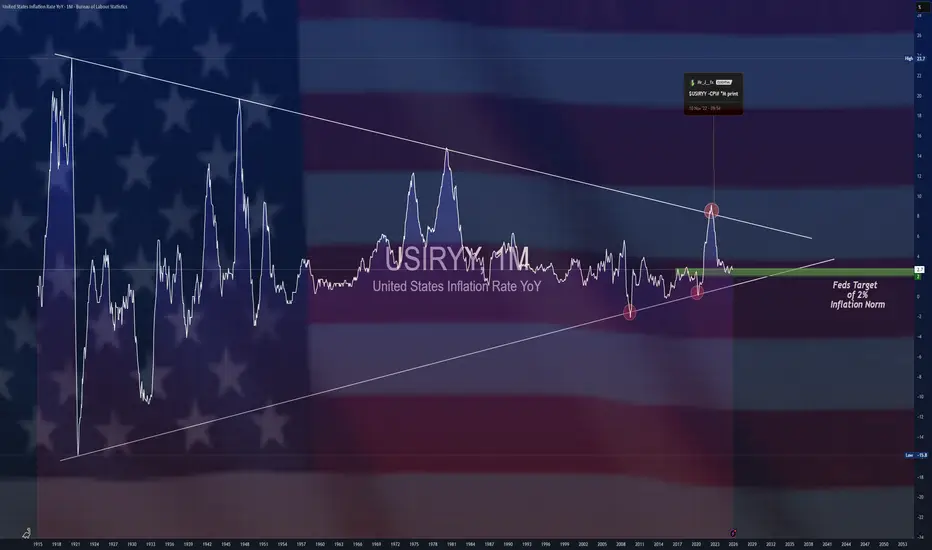
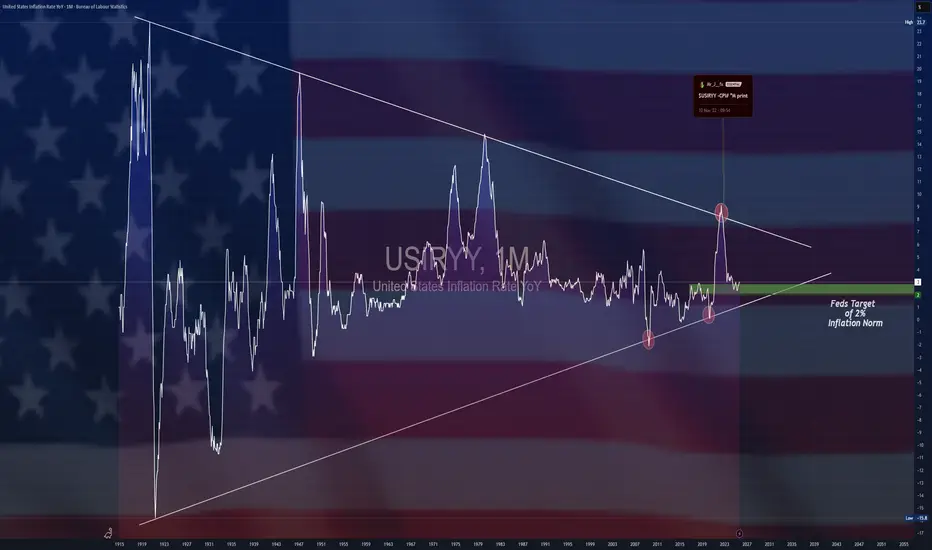
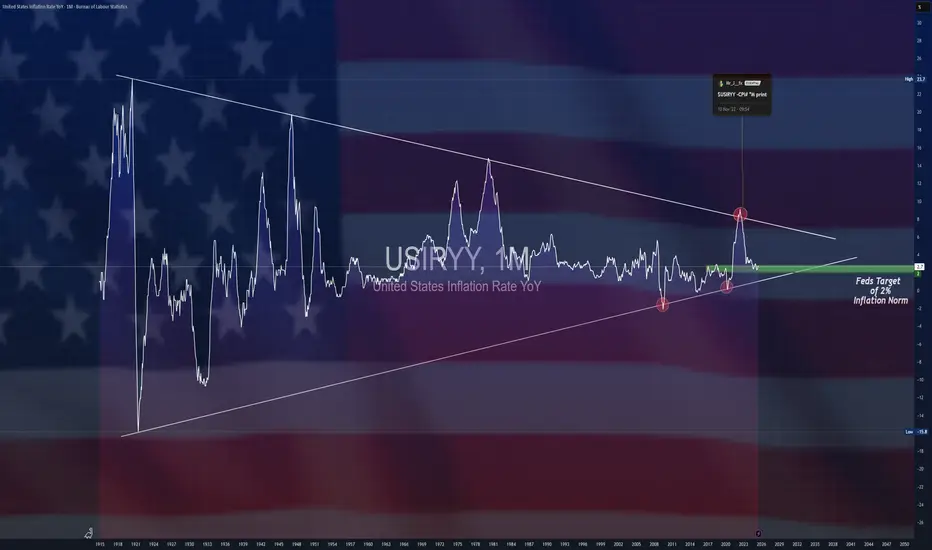
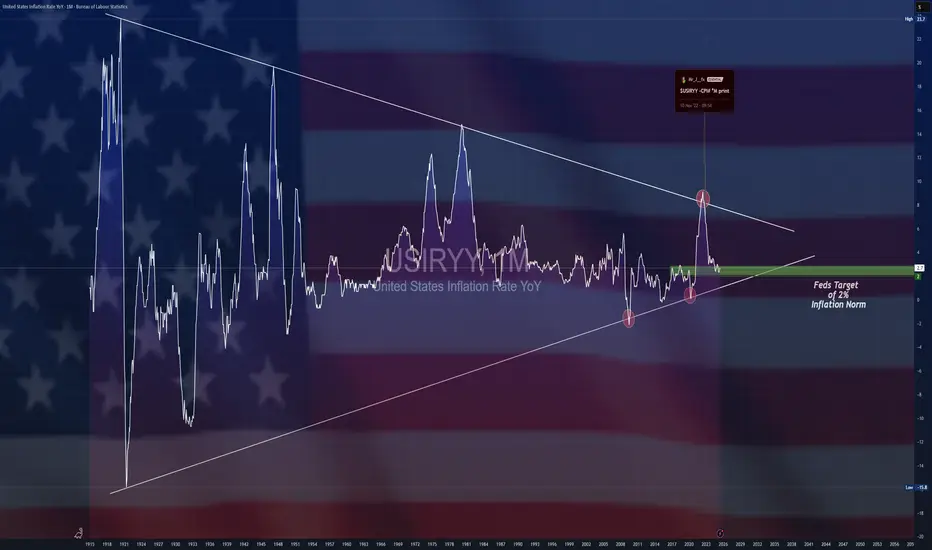
Take a look at the chart I’m working on. The blue line is US inflation; the green line is the Gold/SPX ratio. The mathematical precision is frightening:
Inflation:
> 1957 – 1968: Sideways movement with peaks around 4%, followed by a sharp increase. The period from trough to trough is 5 years.
> 2011 – 2021: Sideways movement with peaks around 4%, followed by the current spike. The period from trough to present is exactly 5 years.
GOLD/SPX Ratio:
> 1960 – 1972: Formation of a bottom with 4 touches of the trendline before the massive breakout.
> 2015 – 2025: Identical bottom with 4 touches before the breakout (the fractal is repeating with a phase 2 years shorter).
The Stagflation Thesis
With the Strait of Hormuz closed and resource shocks, the three inflationary peaks of the 70s are no longer a forecast—they are a repetition of history. We are currently at the bottom following the first peak, but with one critical difference: the world is at record-high debt levels today. In this context, stagflation is not just a crisis; it is a mechanism by which debt is devalued at the expense of savings.
You can print dollars, but you cannot print barrels of oil, copper, or nickel.
Closing the Strait of Hormuz is the "short line" (as described by Luke Gromen) that is rewriting the global balance. If energy is life, its scarcity is the economic death of the old model. The parabolic jump in gold and silver is just the beginning of this "liberation" from paper assets.
When the mathematics of debt meets the geopolitics of resources, real assets stop being just an investment—they become a sanctuary. The question isn't whether you believe in $150 or $250 oil, but whether your portfolio will be prepared when these prices become reality.
In-depth trading ideas
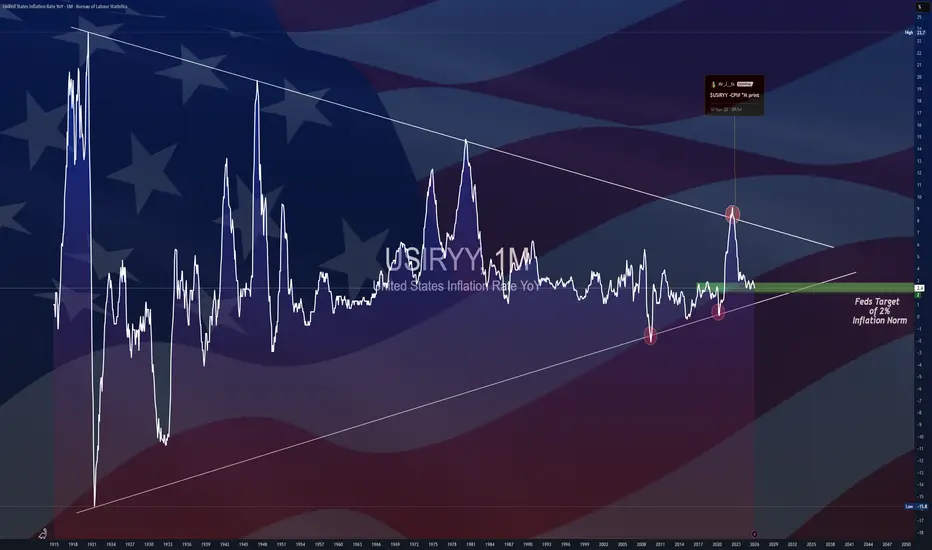
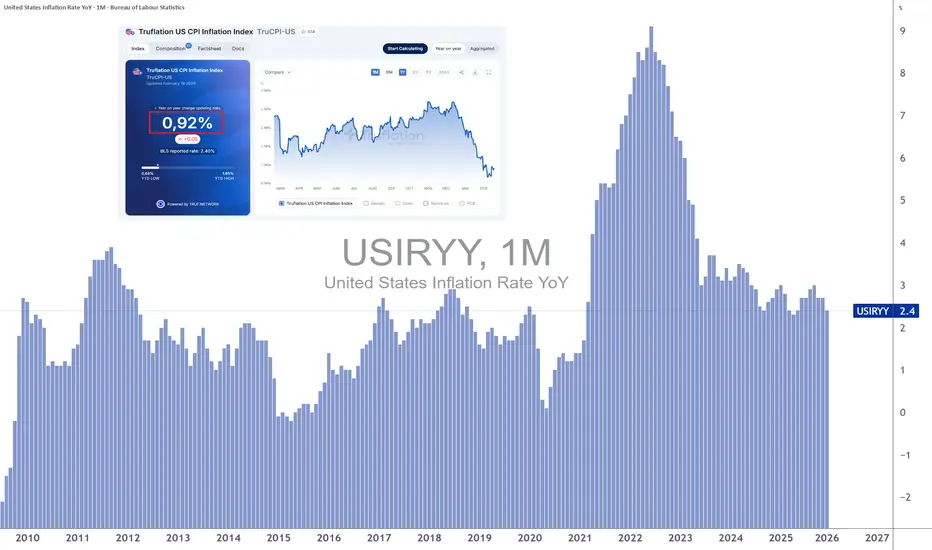
$USIRYY - U.S CPI (February/2026)ECONOMICS:USIRYY 2.4%
February/2026
source: U.S. Bureau of Labor Statistics
- U.S annual inflation held at 2.4% in February, matching January and holding at the lowest since May 2025.
Monthly CPI rose 0.3%, up from 0.2% in January and in line with forecasts.
Core annual inflation remained at 2.5%, near its lowest since 2021, with monthly core CPI up 0.2%, below January’s 0.3%.
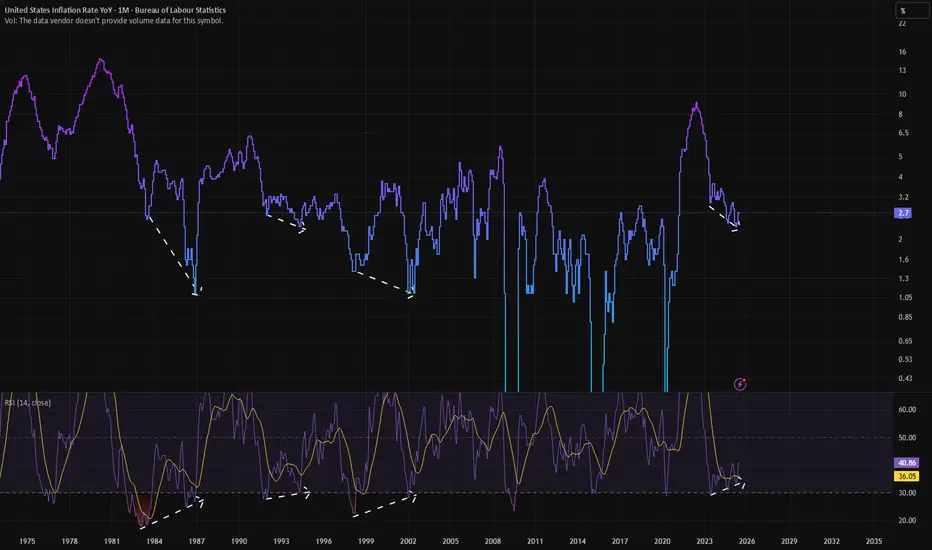
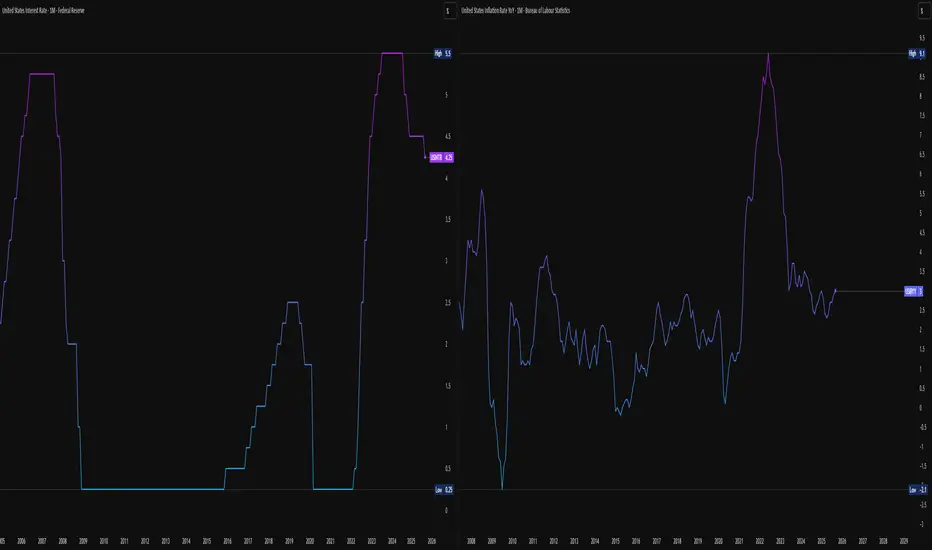
Does this RSI signature say US inflation is about to return?Simple chart.
As you can see, US Inflation has often formed a bullish convergence pattern on it's derived RSI that has been a good predictor of several inflation bottoms.
We have one right now as you can see.
The problem is, that usually, inflation prints this signature when inflation is significantly below targets.
This time, inflation is printing ABOVE targets.
This means if inflation bounces here we can expect another burst of significantly above-target inflation.
Which, logically, means we should not expect rate cuts any time soon.
Either that, or we end up with a weak FED that won't do a U-turn on their rate cut plans, and they cut rates INTO an inflation bounce.
Which is obviously going to be a disaster.
Watch this chart carefully over the next few months going into Q4.
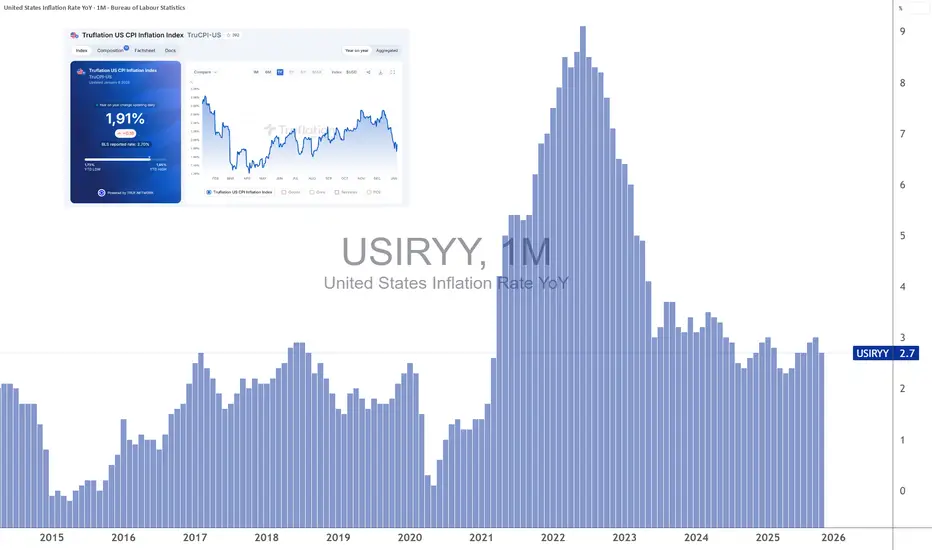
Will US CPI fall like Truflation?The very latest updates on US inflation according to the CPI price index deliver a clear message: disinflation has resumed in the United States after a plateau phase that lasted several months. However, the inflation target of the Federal Reserve is still not reached and remains at 2%.
The January figures for US inflation according to CPI are not far from the target:
• 2.4% for headline inflation
• 2.5% for core inflation, the lowest level since March 2021
But there is another inflation data point that is even more remarkable. It is the drop observed in real-time inflation measures since the end of last year. According to Truflation, a real-time inflation measurement service increasingly respected by high finance and which uses blockchain technology as a data integrity ledger, real-time inflation — the “true” inflation — has fallen below the 1% threshold.
It is widely accepted that, due to its construction, Truflation leads official inflation as measured by CPI and PCE by several months. Under these conditions, can we envisage that the official CPI will also fall below the 2% threshold during 2026? The answer is probably yes — let’s examine why.
The first explanation lies in the structural lag of the housing component within CPI. Housing represents about one third of the CPI basket, and its key component, owners’ equivalent rent, reacts with a delay of several quarters to turning points in the real housing market. However, private rent data show clear disinflation since the end of 2025, with effective rents stagnating or even slightly declining in many US metropolitan areas. This dynamic is already captured by Truflation, while the official CPI continues to reflect past increases.
Second factor: the full normalization of supply chains and increased competitive pressure in goods markets. Prices of durable goods, electronics, furniture, and many everyday consumer products are now trending lower or rising only very slightly. Once again, Truflation captures these adjustments almost in real time, while CPI, based on monthly surveys and rolling averages, smooths these movements significantly.
Third, domestic demand shows clear signs of moderation. The slowdown in credit, the fatigue of discretionary consumption, and the rise in precautionary savings are exerting disinflationary pressure on services excluding housing. This trend is consistent with the pullback observed on Truflation since the end of 2025.
Historically, during phases of rapid disinflation, the Truflation indicator has led CPI by 6 to 12 months. If this pattern repeats, the official CPI should continue to move gradually toward the 2% area in the first half of 2026, with a non-negligible risk of a temporary dip below this threshold in the second half, particularly if housing disinflation fully materializes in official statistics.
In summary, the current divergence does not signal a “mistake” in CPI, but rather a lag in statistical transmission. Truflation acts as a leading indicator of price dynamics, while CPI remains a slower institutional thermometer. If the real-time trend is confirmed, the probability of CPI flirting with, or even falling below, 2% in 2026 is high, which would allow the Federal Reserve to resume interest rate cuts.
DISCLAIMER:
This content is intended for individuals who are familiar with financial markets and instruments and is for information purposes only. The presented idea (including market commentary, market data and observations) is not a work product of any research department of Swissquote or its affiliates. This material is intended to highlight market action and does not constitute investment, legal or tax advice. If you are a retail investor or lack experience in trading complex financial products, it is advisable to seek professional advice from licensed advisor before making any financial decisions.
This content is not intended to manipulate the market or encourage any specific financial behavior.
Swissquote makes no representation or warranty as to the quality, completeness, accuracy, comprehensiveness or non-infringement of such content. The views expressed are those of the consultant and are provided for educational purposes only. Any information provided relating to a product or market should not be construed as recommending an investment strategy or transaction. Past performance is not a guarantee of future results.
Swissquote and its employees and representatives shall in no event be held liable for any damages or losses arising directly or indirectly from decisions made on the basis of this content.
The use of any third-party brands or trademarks is for information only and does not imply endorsement by Swissquote, or that the trademark owner has authorised Swissquote to promote its products or services.
Swissquote is the marketing brand for the activities of Swissquote Bank Ltd (Switzerland) regulated by FINMA, Swissquote Capital Markets Limited regulated by CySEC (Cyprus), Swissquote Bank Europe SA (Luxembourg) regulated by the CSSF, Swissquote Ltd (UK) regulated by the FCA, Swissquote Financial Services (Malta) Ltd regulated by the Malta Financial Services Authority, Swissquote MEA Ltd. (UAE) regulated by the Dubai Financial Services Authority, Swissquote Pte Ltd (Singapore) regulated by the Monetary Authority of Singapore, Swissquote Asia Limited (Hong Kong) licensed by the Hong Kong Securities and Futures Commission (SFC) and Swissquote South Africa (Pty) Ltd supervised by the FSCA.
Products and services of Swissquote are only intended for those permitted to receive them under local law.
All investments carry a degree of risk. The risk of loss in trading or holding financial instruments can be substantial. The value of financial instruments, including but not limited to stocks, bonds, cryptocurrencies, and other assets, can fluctuate both upwards and downwards. There is a significant risk of financial loss when buying, selling, holding, staking, or investing in these instruments. SQBE makes no recommendations regarding any specific investment, transaction, or the use of any particular investment strategy.
CFDs are complex instruments and come with a high risk of losing money rapidly due to leverage. The vast majority of retail client accounts suffer capital losses when trading in CFDs. You should consider whether you understand how CFDs work and whether you can afford to take the high risk of losing your money.
Digital Assets are unregulated in most countries and consumer protection rules may not apply. As highly volatile speculative investments, Digital Assets are not suitable for investors without a high-risk tolerance. Make sure you understand each Digital Asset before you trade.
Cryptocurrencies are not considered legal tender in some jurisdictions and are subject to regulatory uncertainties.
The use of Internet-based systems can involve high risks, including, but not limited to, fraud, cyber-attacks, network and communication failures, as well as identity theft and phishing attacks related to crypto-assets.
$USIRYY - U.S CPI (January/2026)ECONOMICS:USIRYY 2.4%
January/2026 -0.3%
source: U.S. Bureau of Labor Statistics
- The annual inflation rate in the US likely slowed to 2.5% in January, marking its lowest level since May, largely reflecting base effects.
On a monthly basis, the CPI is estimated to have risen by 0.3%, matching December’s increase. Meanwhile, annual core inflation is projected to ease to 2.5%, its lowest reading since March 2021. On a monthly basis, core CPI is expected to have increased by 0.3%, slightly above December’s 0.2% rise.
$USIRYY - U.S CPI (December/2025)ECONOMICS:USIRYY 2.7%
December/2025
source: U.S. Bureau of Labor Statistics
- The annual inflation rate in the U.S remained at 2.7% in December, while the core rate probably edged up to 2.7% from 2.6% in November which was the lowest level since early 2021.
On a month-over-month basis,
headline CPI is expected to have increased by 0.3%, with core CPI also seen rising by 0.3%, driven mainly by higher goods prices.
Is US Inflation Already Below 2%?After recent geopolitical noise and US employment data, this second week of January marks the major return of US inflation indicators through the CPI and PPI releases. While the sharp drop in inflation in November surprised markets, real-time inflation measures now appear to have fallen back below 2%. Is this credible? Has US inflation truly been defeated, allowing the Federal Reserve to resume cuts to the federal funds rate in the first quarter of 2026?
Tuesday, January 13, 2026, brings the release of US inflation data via the CPI index. Recall that the previous update showed headline US inflation declining to 2.7%, with core inflation easing to 2.6%. This decline surprised the market, and the key issue surrounding the January 13 release is whether it confirms the renewed disinflationary trend in the US economy.
It is worth noting that several highly respected real-time inflation indicators, particularly the CPI and PCE estimates provided by Truflation, have already returned to the Federal Reserve’s 2% target, or even slightly below it.
Truflation’s data currently indicate real-time CPI inflation around 1.9%, with PCE inflation slightly above 2%, yet still very close to the Fed’s target. These indicators, updated daily, offer an advanced view of price dynamics well ahead of official statistics, which are published with a delay. Historically, Truflation has often captured inflation turning points more quickly, explaining the growing attention paid to these measures by institutional investors.
Beyond these aggregate indicators, leading components of inflation also confirm a disinflationary environment. ISM PMI indices, for both manufacturing and services, show a renewed decline in their price-related components. This suggests that upstream inflationary pressures along the value chain continue to ease, reducing the risk of an inflation rebound in the coming months.
Real estate, long a key driver of inflation persistence, no longer appears to be a major risk factor. Zillow’s rent index shows rental inflation close to 2%, signaling that normalization is now largely complete. Given the time lag between market rents and their inclusion in the official CPI, this trend supports continued disinflation in the housing component of CPI during the first half of 2026.
Finally, the energy factor clearly supports a disinflationary scenario. Year-over-year oil price changes are now negative, mechanically exerting downward pressure on headline inflation and limiting second-round effects. As long as this dynamic persists, it acts as a powerful buffer against any resurgence in inflation.
In this context, the key question may no longer be whether US inflation will sustainably fall below 2%, but rather how long the Fed will wait before adjusting its monetary policy accordingly. If January CPI and PPI data confirm the trajectory suggested by real-time indicators, market expectations for a resumption of rate cuts as early as the first quarter of 2026 could strengthen rapidly.
DISCLAIMER:
This content is intended for individuals who are familiar with financial markets and instruments and is for information purposes only. The presented idea (including market commentary, market data and observations) is not a work product of any research department of Swissquote or its affiliates. This material is intended to highlight market action and does not constitute investment, legal or tax advice. If you are a retail investor or lack experience in trading complex financial products, it is advisable to seek professional advice from licensed advisor before making any financial decisions.
This content is not intended to manipulate the market or encourage any specific financial behavior.
Swissquote makes no representation or warranty as to the quality, completeness, accuracy, comprehensiveness or non-infringement of such content. The views expressed are those of the consultant and are provided for educational purposes only. Any information provided relating to a product or market should not be construed as recommending an investment strategy or transaction. Past performance is not a guarantee of future results.
Swissquote and its employees and representatives shall in no event be held liable for any damages or losses arising directly or indirectly from decisions made on the basis of this content.
The use of any third-party brands or trademarks is for information only and does not imply endorsement by Swissquote, or that the trademark owner has authorised Swissquote to promote its products or services.
Swissquote is the marketing brand for the activities of Swissquote Bank Ltd (Switzerland) regulated by FINMA, Swissquote Capital Markets Limited regulated by CySEC (Cyprus), Swissquote Bank Europe SA (Luxembourg) regulated by the CSSF, Swissquote Ltd (UK) regulated by the FCA, Swissquote Financial Services (Malta) Ltd regulated by the Malta Financial Services Authority, Swissquote MEA Ltd. (UAE) regulated by the Dubai Financial Services Authority, Swissquote Pte Ltd (Singapore) regulated by the Monetary Authority of Singapore, Swissquote Asia Limited (Hong Kong) licensed by the Hong Kong Securities and Futures Commission (SFC) and Swissquote South Africa (Pty) Ltd supervised by the FSCA.
Products and services of Swissquote are only intended for those permitted to receive them under local law.
All investments carry a degree of risk. The risk of loss in trading or holding financial instruments can be substantial. The value of financial instruments, including but not limited to stocks, bonds, cryptocurrencies, and other assets, can fluctuate both upwards and downwards. There is a significant risk of financial loss when buying, selling, holding, staking, or investing in these instruments. SQBE makes no recommendations regarding any specific investment, transaction, or the use of any particular investment strategy.
CFDs are complex instruments and come with a high risk of losing money rapidly due to leverage. The vast majority of retail client accounts suffer capital losses when trading in CFDs. You should consider whether you understand how CFDs work and whether you can afford to take the high risk of losing your money.
Digital Assets are unregulated in most countries and consumer protection rules may not apply. As highly volatile speculative investments, Digital Assets are not suitable for investors without a high-risk tolerance. Make sure you understand each Digital Asset before you trade.
Cryptocurrencies are not considered legal tender in some jurisdictions and are subject to regulatory uncertainties.
The use of Internet-based systems can involve high risks, including, but not limited to, fraud, cyber-attacks, network and communication failures, as well as identity theft and phishing attacks related to crypto-assets.
$USIRYY - U.S CPI (November/2025)ECONOMICS:USIRYY 2.7%
November/2025 -0.3%
source: U.S. Bureau of Labor Statistics
- The annual inflation in the US fell to 2.7% in November,
the lowest since July, and compared to 3% in September and market expectations of 3.1%.
Also, the core gauge fell to 2.6%,
the lowest since April 2021, according to the delayed data.

Global Macro Breakdown – Q4 2025Real Rates, Policy Transition & Market Bias Across Assets
Macro Overview
Global monetary policy is undergoing a significant transition from tightening to early easing.
With inflation stabilizing and real interest rates beginning to decline, we are entering the onset of a new expansion phase in the global economic cycle.
Liquidity is gradually flowing back into risk-assets.
🏛️ Global Monetary Conditions
🇺🇸 United States
• Inflation: 3.0%
• Interest Rate: 4.25%
• Real Rate: +1.25%
→ Transitioning toward easing; Fed pivot in sight.
🇩🇪 Germany / Euro-Area
• Inflation: 2.4%
• Interest Rate: 2.15%
• Real Rate: –0.25%
→ Neutral stance; ECB focused on fiscal and currency stability.
🇬🇧 United Kingdom
• Inflation: 3.8%
• Interest Rate: 4.0%
• Real Rate: +0.2%
→ Transitioning to easing, but policy remains relatively restrictive given elevated inflation.
🇧🇷 Brazil
• Inflation: 5.17%
• Interest Rate: 15.0%
• Real Rate: +9.83%
→ Active easing cycle underway despite high nominal rates; strong carry-trade appeal.
🇯🇵 Japan
• Inflation: 2.9%
• Interest Rate: 0.5%
• Real Rate: –2.4%
→ Ultra-loose policy persists; potential for tightening risks emerging.
💡 Macro Bias Summary
Equities (NASDAQ / S&P500)
📈 Bullish – Declining real yields and easing expectations support growth sectors.
Commodities (Gold / Oil / Copper)
📈 Bullish – A reflationary impulse is emerging as global liquidity expands.
Forex (USD)
📉 Bearish – Falling rate differentials weaken the dollar.
EUR/USD
📈 Bullish – Euro-area policy is stable, US policy turning dovish; spread reversal favors the euro.
Crypto (BTC / ETH)
🚀 Bullish – Improved liquidity conditions and renewed risk appetite attract speculative capital.
🧭 Cycle Interpretation
We are exiting the “tightening plateau” and entering the early expansion phase, similar to 2019 or early 2013.
Real yields have peaked, inflation has cooled, and liquidity conditions are improving.
Historically, risk assets outperform sequentially: → first commodities, then equities, and finally crypto.
“As real rates decline, capital seeks motion again — from money to matter.”
$USIRYY -U.S Inflation Rate (September/2025)ECONOMICS:USIRYY 3%
September/2025
source: U.S. Bureau of Labor Statistics
- The US annual inflation rate rose to 3.0% in September from 2.9% in August, slightly below market expectations of 3.1%.
It was the highest rate since January, mainly due to a jump in energy prices. Meanwhile, core inflation eased to 3.0% from 3.1%, while monthly headline and core CPI increased 0.3% and 0.2%, respectively.
Peak Inflation-Resistance trendline unbroken
-Bearish divergence on the Wolfpack
-"Overbought" on the RSI
-Curling price action

$USIRYY - U.S Inflation Rises to Seven-Month High (August/2025)ECONOMICS:USIRYY
August/2025
source: U.S. Bureau of Labor Statistics
- The US annual inflation rate accelerated to 2.9% in August,
its highest level since January, as retailers gradually passed higher import tariffs on to consumers.
On a monthly basis, consumer prices rose 0.4%, the most since January, above both July’s 0.2% increase and forecasts of 0.3%.
Core inflation held steady, rising 3.1% year-on-year and 0.3% month-on-month, matching July’s pace.

$USIRYY -U.S Inflation Rate Steady at 2.7%, Core Accelerates to ECONOMICS:USIRYY
July/2025
source: U.S. Bureau of Labor Statistics
- The US annual inflation rate held at 2.7% in July, defying forecasts of a tariff-driven rise to 2.8%.
Core inflation climbed to 3.1% from 2.9%, above expectations of 3%, signaling underlying price pressures despite stable headline CPI.
On a monthly basis, CPI rose 0.2% as expected, while core CPI increased 0.3%, its largest gain in six months.
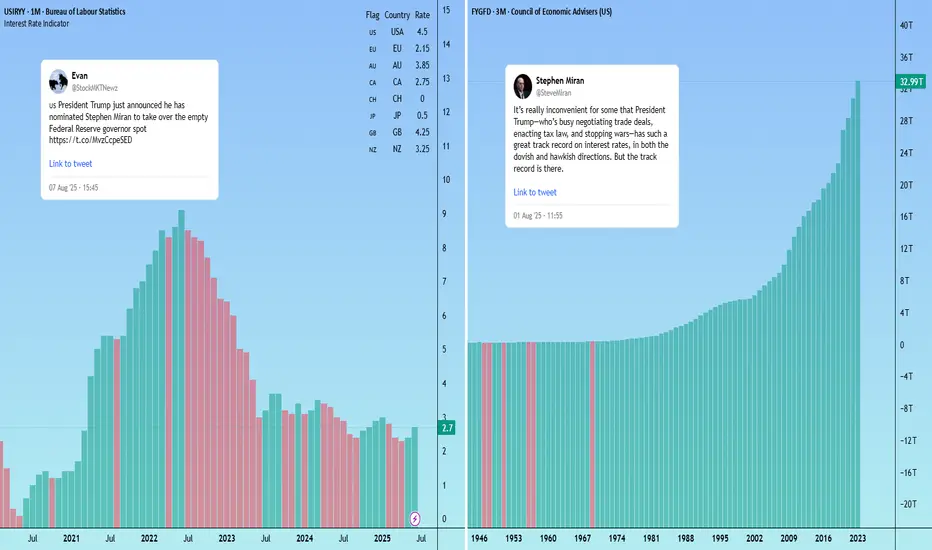
Trump’s Fed pick signals potential softer dollar US President Trump has named CEA Chair Stephen Miran as the temporary replacement for Fed Board member Adriana Kugler, serving until at least January 31, 2026.
As expected, Miran is closely aligned with Trump’s policy views, including support for tariffs and scepticism over the Federal Reserve’s independence.
Notably, Miran is a critic of the U.S. dollar’s current strength and is the author of the “Mar-A-Lago Accord” — a proposal to deliberately weaken the dollar to address the U.S. current account deficit.
The White House is also searching for a new Fed chair. If markets believe the next chair will prioritise Trump’s agenda over an independent monetary policy (a safe assumption at this stage) investors may demand higher yields on U.S. debt to hedge inflation risk. That could add volatility to US pairs.
$USIRYY -U.S Inflation Rate Seen Rising for 2nd Month (June/2025ECONOMICS:USIRYY
June/2025
source: U.S. Bureau of Labor Statistics
- The annual inflation rate in the US likely accelerated for the second consecutive month to 2.7% in June, the highest level since February, up from 2.4% in May.
On a monthly basis, the CPI is expected to rise by 0.3%, marking the largest increase in five months.
Meanwhile, core inflation is projected to edge up to 3% from 2.8%. Monthly core CPI is also anticipated to climb 0.3%, up from 0.1% in May, marking its sharpest increase in five months.
Weekly Macro Brief: Chinese Economic Data, US Inflation, Tariff CME_MINI:ES1! CME_MINI:NQ1! COMEX:GC1! CME:BTC1! CME_MINI:RTY1! COMEX:SI1! CME_MINI:MNQ1! NYMEX:CL1! CME_MINI:M6E1! CBOT:ZN1! CME_MINI:MES1!
Highlights this week include Chinese economic data points, UK CPI, US CPI, PPI, and Retail Sales. Inflation data is key, as it comes ahead of the Fed's meeting on July 30th, 2025.
Market participants, including institutional investors and futures brokers like EdgeClear, will be scrutinizing these data points closely to monitor global growth and underlying inflation pressures.
Fed speakers are scheduled throughout the week. With increasing calls for Fed Chair Powell voluntary resignation and impeachment, the US administration desiring lower rates, the Fed’s independence and credibility to carry out its dual mandate is at risk. It will be interesting to monitor who folds first. Last week’s FOMC minutes revealed a divided Fed on the interest rate outlook, affirming its June dot plot.
On the fiscal policy front, we are already witnessing a shift in global trade policies, with many nations making concessions to negotiate trade deals with the world’s largest economy. In our analysis, the inflation impact of tariffs may not show up until Q4 2025 or early 2026, as tariff threats are mostly used as a lever to negotiate deals. While effective tariff rates have increased, as Trump reshapes how tariffs are viewed, cost pass-through to consumers will be limited in Q3 2025, as companies’ front-loaded inventory helps mitigate the risks of increased tariff exposure.
So, what we have is an interesting development shaping up where, while inflation may rise and remain sticky, it is yet to be seen whether slowing consumer spending will weaken enough to the point where companies have to start offering discounts, which would nullify the tariff risk to the end consumer and result in companies absorbing all tariffs. This scenario will see reduced earnings margins leading into the last quarter and early 2026. However, it will materially reduce risks of higher inflation.
In summary, the complex interplay between tariffs, inflation, and consumer behavior presents critical considerations for traders. EdgeClear, as a dedicated futures broker, remains focused on equipping clients with the insights needed to help navigate this evolving macroeconomic environment.
Overnight Data Recap:
• Chinese Trade Balance (CNY)(Jun) 826.0B (Prev. 743.6B)
• Chinese Trade Balance USD* (Jun) 114.77B vs. Exp. 109.0B (Prev. 103.22B)
• Chinese Imports YY* (Jun) 1.1% vs. Exp. 1.3% (Prev. -3.4%)
• Chinese Exports YY* (Jun) 5.8% vs. Exp. 5.0% (Prev. 4.8%)
Key Economic Releases:
• MON: EU 90-Day Retaliatory Pause Ends
• TUE: OPEC MOMR, Chinese House Prices (Jun), Retail Sales (Jun), GDP (Q2), EZ Industrial Production (May), German ZEW (Jun), US CPI (Jun), NY Fed Manufacturing (Jul), Canadian CPI (Jun)
• WED: UK CPI (Jun), EZ Trade (May), US PPI (Jun), Industrial Production (Jun)
• THU: Japanese Trade Balance (Jun), EZ Final HICP (Jun), US Export/Import Prices (Jun), Weekly Claims, Philadelphia Fed (Jul), Retail Sales (Jun)
• FRI: Japanese CPI (Jun), German Producer Prices (Jun), US Building Permits/Housing Starts (Jun), Uni. of Michigan Prelim. (Jul)
China GDP / Retail Sales/ Housing (TUE):
• Q2 GDP is expected to slow to 5.1% Y/Y (vs 5.4% in Q1) and 0.9% Q/Q.
• Retail sales have been resilient, but industrial production and investment show signs of weakness; deflation and labor market concerns persist.
• Property prices continue to decline, fueling stimulus speculation; policymakers remain cautious, with only modest easing expected (LPR and RRR cuts in Q4).
US CPI (TUE)
• June CPI expected at +0.3% M/M headline and core, suggesting a modest rebound from May’s subdued figures.
• Inflation impact from tariffs seen as temporary; Fed officials maintain a cautious stance with possible rate cuts only if price pressures stay benign.
• Markets are pricing near-zero odds for a July rate cut, but still expect two 25bps cuts by year-end in line with Fed guidance.
US Retail Sales (THU):
• Headline June retail sales expected flat M/M; ex-autos expected to rise +0.3%, showing signs of consumer stabilization.
• BofA data shows mild spending rebound, though discretionary service spending continues to weaken, especially among lower-income households.
• Spending strength remains concentrated in higher-income cohorts; weakness in wage growth limits broader consumption momentum.
US Trade Tensions – Tariffs & Negotiations:
• Trump announced 30% tariffs on EU and Mexican goods effective August 1st, separate from sector-specific tariffs.
• Trump stated the EU is engaging in talks and South Korea is also pursuing a trade deal.
Mexico Response:
• President Sheinbaum expects a deal before August 1st but reaffirmed Mexican sovereignty is non-negotiable.
• Mexico’s Economy Ministry is negotiating to protect domestic firms and workers, aiming for an alternative resolution.
EU Response:
• European Commission President von der Leyen warned that 30% tariffs would disrupt key transatlantic supply chains.
• The EU will extend suspension of countermeasures until early August but is prepared to respond proportionally if needed.
• The EU prefers a negotiated solution and dropped plans for a digital tax, seen as a concession to US tech interests.
• Separately, the EU is drafting a broad corporate tax on firms with turnover above EUR 50 million to support its budget.
What is Inflation Climate and Weather? Copper is NextThe key driver of most markets — and a major influence on their trends — is inflation.
Once we understand the difference between short-term inflation weather and long-term inflation climate, we can better recognize where risk meets opportunity.
On this half yearly chart. We can see as the close on 30th June, copper settled firmly, closed above its $4.44 resistance that has been tested for years.
This study indicates that copper could be at the beginning of an uptrend. I will be looking out for buying-on-dips opportunities whenever they arise.
Mirco Copper Futures
Ticker: MHG
Minimum fluctuation:
0.0005 per pound = $1.25
Disclaimer:
• What presented here is not a recommendation, please consult your licensed broker.
• Our mission is to create lateral thinking skills for every investor and trader, knowing when to take a calculated risk with market uncertainty and a bolder risk when opportunity arises.
CME Real-time Market Data help identify trading set-ups in real-time and express my market views. If you have futures in your trading portfolio, you can check out on CME Group data plans available that suit your trading needs www.tradingview.com

$USIRYY -U.S CPI Below Expectations (May/2025)ECONOMICS:USIRYY 2.4%
(May/2025)
source: U.S. Bureau of Labor Statistics
- The annual inflation rate in the US increased for the first time in four months to 2.4% in May from 2.3% in April, though it came in below the expected 2.5%.
Prices rose slightly more for food, used cars and new vehicles but shelter cost slowed and gasoline prices continued to decline.
Meanwhile, the annual core inflation rate held steady at 2.8%.
On a monthly basis, both headline and core CPI increased by 0.1%, falling short of market expectations.

Mid-Week Outlook Update: US CPI- Trade TalksCPI day today. Scheduled to be released at 7:30 AM CT.
CME:6E1! CME_MINI:ES1! CME_MINI:NQ1! CME_MINI:MNQ1! CME_MINI:MES1! COMEX:GC1! CBOT:ZN1!
ES futures edged slightly higher after positive commentary from US-China trade talks. The delegations from both sides agreed on a framework to move forward with negotiations.
It is important to note that Trade War 1.0 took about two years to formalize and finalize. However, given the previous experience and the current agreement on the framework, our opinion (which is not the consensus) is that the trade deal between China and the US may be closer than what most analysts and investors might otherwise predict.
Like any negotiations, China and the US have previously discussed these difficult issues and have found a way to resolve them. Although the concerns have shifted towards niche sectors, we still view baseline tariffs with some sectors seeing increased tariffs as likely.
TACO (Trump Always Chickens Out) acronym traders will see a tougher stance from Trump to resolve the overarching trade deficit issue with China, particularly the dumping of Chinese goods.
AI, defense technology, chips, and rare earth minerals are at the center of these discussions. There will be targeted controls on exports of chips from the US and exports of rare earth minerals on the Chinese side, despite the current framework and deals agreed. In our view, these controls will be phased out until agreements are finalized, to maintain leverage and show TACO acronym backers that Trump is not “chickening out,” but rather maintaining a strong stance while negotiating trade deals with China and other countries.
In our analysis, despite positive headlines, the overhanging uncertainty has not dissipated. In fact, there is clarity that President Trump is willing to take the difficult road to negotiate from an apparent position of strength. Would this result in extension of trade deadlines or temporary increase in tariffs followed by an extension of deadlines? This remains to be seen!
If May CPI comes in lower than expectations, this will be a nudge in the direction that tariffs are not translating into higher inflation. We may see a rally in index futures.
On the contrary, any increase in CPI above the previous 2.3% YoY increase will be seen as tariff-induced inflation.
In our analysis, given lower energy prices, rent inflation stabilizing at levels last seen in late 2021, and services inflation in the US trending lower from the peak in January 2023, we are seeing embedded inflation in the prior two months and this may remain sticky in today’s release. However, any stability with lower energy prices seen in the prior month will point to a lower inflation print overall.
Comment with your favorite trade idea from our past trade ideas and what you would like to see more of.

US INFLATION, a decisive figure this week!This week, which runs from Monday June 9 to Friday June 13, sees two fundamental factors which will have a strong impact on the stock market: the continuation of the trade diplomacy phase which is currently acting as a fundamental red thread (particularly between China and the United States) and, above all, the US inflation update according to the PCI price index on Wednesday June 11.
The key issue is to determine whether tariffs in the so-called reciprocal tariffs trade war have begun to trigger a rebound in inflation. This is what the US Federal Reserve (FED) is watching to determine whether or not it should resume cutting the federal funds rate, which has been on hold since last December.
1) Federal funds rate cuts have been on hold since the end of 2024
Unlike the European Central Bank and other major Western central banks, the FED has paused its key interest rate cut since the beginning of the year. The ECB's key interest rate, meanwhile, has been cut several times and now stands at 2.15%, i.e. a key interest rate considered neutral for the economy (i.e. neither an accommodating nor a restrictive monetary policy).
This divergence in monetary policy between the FED and the ECB is perceived as a risk by the market, while the trade war could end up having a negative impact on US economic growth.
2) The market does not expect the FED to resume cutting rates before September.
But Jerome Powell's Federal Reserve (FED) is taking a hard line, believing that the Trump Administration's trade war could undermine its efforts to fight inflation. Although the FED's inflation target of 2% is not far off, according to the latest ECP and CPI updates, the FED wants confirmation that companies have not passed on sharp price rises to compensate for the tariffs. This is why the inflation figures published this May have a decisive dimension at a fundamental level. The Fed will be able to resume cutting the federal funds rate if, and only if, disinflation is not threatened by the trade war.
3) This is why the ICP US inflation update on Wednesday June 11 is the fundamental highlight of the week.
This Wednesday, June 11, we'll be keeping a very close eye on the publication of US inflation according to the ICP. The monthly reading will be closely watched, as will the year-on-year nominal and underlying inflation rates.
The consensus is relatively pessimistic, with inflation expected to rebound at both monthly and annual rates. Real-time inflation, as measured by TRUFLATION, is still under control, so the pessimistic consensus may be overturned.
DISCLAIMER:
This content is intended for individuals who are familiar with financial markets and instruments and is for information purposes only. The presented idea (including market commentary, market data and observations) is not a work product of any research department of Swissquote or its affiliates. This material is intended to highlight market action and does not constitute investment, legal or tax advice. If you are a retail investor or lack experience in trading complex financial products, it is advisable to seek professional advice from licensed advisor before making any financial decisions.
This content is not intended to manipulate the market or encourage any specific financial behavior.
Swissquote makes no representation or warranty as to the quality, completeness, accuracy, comprehensiveness or non-infringement of such content. The views expressed are those of the consultant and are provided for educational purposes only. Any information provided relating to a product or market should not be construed as recommending an investment strategy or transaction. Past performance is not a guarantee of future results.
Swissquote and its employees and representatives shall in no event be held liable for any damages or losses arising directly or indirectly from decisions made on the basis of this content.
The use of any third-party brands or trademarks is for information only and does not imply endorsement by Swissquote, or that the trademark owner has authorised Swissquote to promote its products or services.
Swissquote is the marketing brand for the activities of Swissquote Bank Ltd (Switzerland) regulated by FINMA, Swissquote Capital Markets Limited regulated by CySEC (Cyprus), Swissquote Bank Europe SA (Luxembourg) regulated by the CSSF, Swissquote Ltd (UK) regulated by the FCA, Swissquote Financial Services (Malta) Ltd regulated by the Malta Financial Services Authority, Swissquote MEA Ltd. (UAE) regulated by the Dubai Financial Services Authority, Swissquote Pte Ltd (Singapore) regulated by the Monetary Authority of Singapore, Swissquote Asia Limited (Hong Kong) licensed by the Hong Kong Securities and Futures Commission (SFC) and Swissquote South Africa (Pty) Ltd supervised by the FSCA.
Products and services of Swissquote are only intended for those permitted to receive them under local law.
All investments carry a degree of risk. The risk of loss in trading or holding financial instruments can be substantial. The value of financial instruments, including but not limited to stocks, bonds, cryptocurrencies, and other assets, can fluctuate both upwards and downwards. There is a significant risk of financial loss when buying, selling, holding, staking, or investing in these instruments. SQBE makes no recommendations regarding any specific investment, transaction, or the use of any particular investment strategy.
CFDs are complex instruments and come with a high risk of losing money rapidly due to leverage. The vast majority of retail client accounts suffer capital losses when trading in CFDs. You should consider whether you understand how CFDs work and whether you can afford to take the high risk of losing your money.
Digital Assets are unregulated in most countries and consumer protection rules may not apply. As highly volatile speculative investments, Digital Assets are not suitable for investors without a high-risk tolerance. Make sure you understand each Digital Asset before you trade.
Cryptocurrencies are not considered legal tender in some jurisdictions and are subject to regulatory uncertainties.
The use of Internet-based systems can involve high risks, including, but not limited to, fraud, cyber-attacks, network and communication failures, as well as identity theft and phishing attacks related to crypto-assets.

$USIRYY - U.S Inflation Rate Unexpectedly Slows (April/2025)ECONOMICS:USIRYY
April/2025
source: U.S. Bureau of Labor Statistics
- The annual inflation rate in the US eased to 2.3% in April, the lowest since February 2021, from 2.4% in March and below forecasts of 2.4%.
Prices of gasoline fell at a faster pace and inflation also slowed for food and transportation.
Compared to the previous month, the CPI rose 0.2%, rebounding from a 0.1% fall in March but below forecasts of 0.3%.
Meanwhile, annual core inflation rate steadied at 2.8% as expected, holding at 2021-lows.

For the last 5 times out of 6.For the last 5 times out of 6.
Gold bottomed when the inflation rate lost a rising support line.

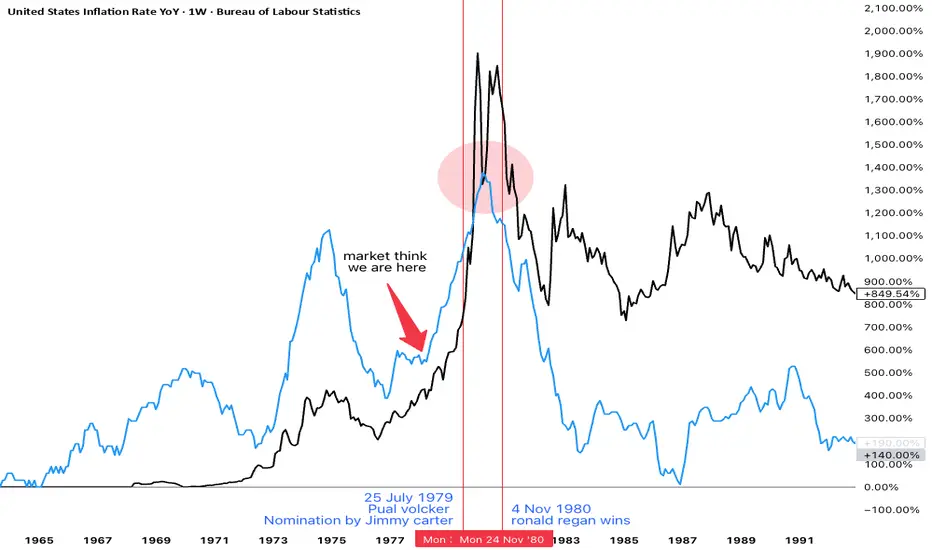
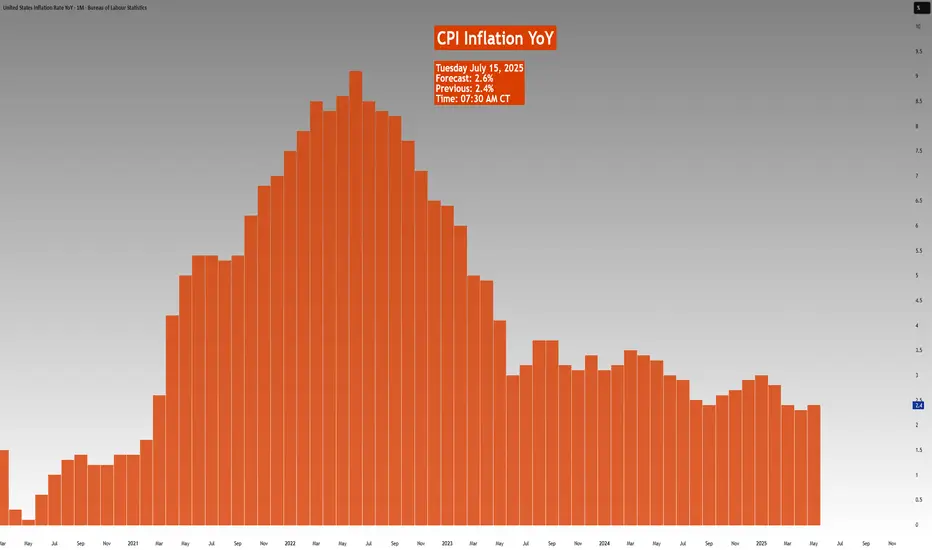
gold and inflation in 1970s stagflation fomc member repeatedly saying this is not stagflation like 1970s
but gold bug on social media constantly pump stagflation narrative after gold historic run from $2000 to $3000 in just one year
with usa cpi and gold chart in one image you can get idea
how gold moved in last stagflation crisis with big political news : when paul volcker comes into fed and when Ronald Reagan wins election
gold first makes double top before multi year bear market
inflation peaked after volcker get fed control but before election result.
is this is really replay of 1970s ?
we got same old president trump and same old fed chair powell
✅ biden forced fed to do big size 50bps cut pre election to choose inflation over higher unemployment which is stagflation
✅ in his first term trump in election year March 2020 use covid as excuse to cut 0% and do QE and trillion dollar fiscal policy stimulus check. choosing inflation over high employment which is stagflation but it was biden who has to face most of the inflation spike to 9%
✅trump raise tariff to 100 years high to choose high employment over inflation which is recession
✅ in next 4 years it will be clear is this replay of 70s or not.
in future we will have more inflation and gold price data to confirm