Let’s run an experiment. Read the following text twice: first, focus on the history (before the slash); then, focus on today’s reality (after the slash):
In 1965 / 2022, the US attempted the impossible: funding the Vietnam War / Ukraine & Israel conflicts, while maintaining the "Great Society" / COVID stimulus & "Green Deal" programs without raising taxes. The result: an explosion in money supply and the first inflation wave.
In 1971 / 2025, the second blow landed – the end of Bretton Woods / the rise of BRICS+ and de-dollarization. The dollar-gold link was severed, and silver staged a 215% / 325% parabolic jump in less than a year.
Two years later, after the US backed Israel in the Yom Kippur War / Iran escalation, the East hit back with an oil embargo / closure of the Strait of Hormuz. Energy prices quadrupled, the economy locked into stagflation, and gold began its historic ascent.
Oops... The last sentence is a SPOILER. It happened back then, but it's different now, right? Or is it?
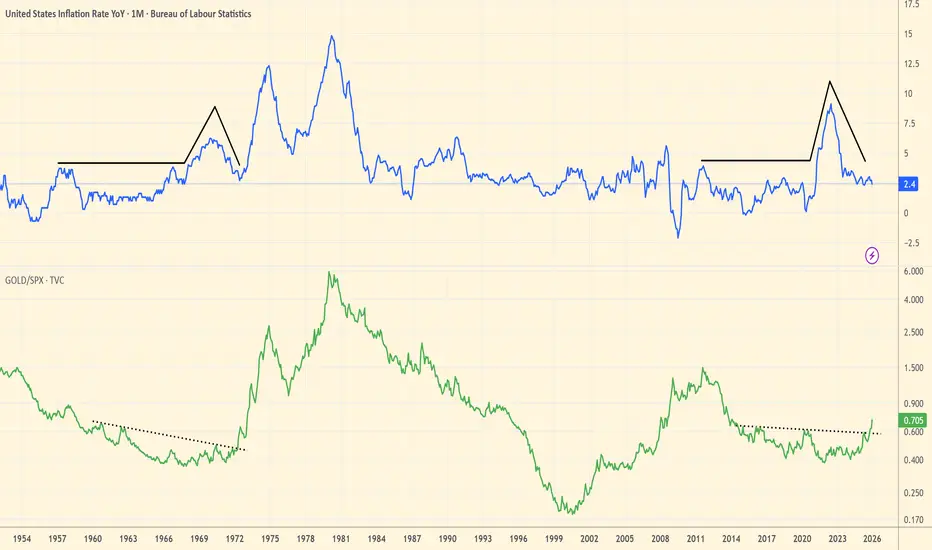
Take a look at the chart I’m working on. The blue line is US inflation; the green line is the Gold/SPX ratio. The mathematical precision is frightening:
Inflation:
> 1957 – 1968: Sideways movement with peaks around 4%, followed by a sharp increase. The period from trough to trough is 5 years.
> 2011 – 2021: Sideways movement with peaks around 4%, followed by the current spike. The period from trough to present is exactly 5 years.
GOLD/SPX Ratio:
> 1960 – 1972: Formation of a bottom with 4 touches of the trendline before the massive breakout.
> 2015 – 2025: Identical bottom with 4 touches before the breakout (the fractal is repeating with a phase 2 years shorter).
The Stagflation Thesis
With the Strait of Hormuz closed and resource shocks, the three inflationary peaks of the 70s are no longer a forecast—they are a repetition of history. We are currently at the bottom following the first peak, but with one critical difference: the world is at record-high debt levels today. In this context, stagflation is not just a crisis; it is a mechanism by which debt is devalued at the expense of savings.
You can print dollars, but you cannot print barrels of oil, copper, or nickel.
Closing the Strait of Hormuz is the "short line" (as described by Luke Gromen) that is rewriting the global balance. If energy is life, its scarcity is the economic death of the old model. The parabolic jump in gold and silver is just the beginning of this "liberation" from paper assets.
When the mathematics of debt meets the geopolitics of resources, real assets stop being just an investment—they become a sanctuary. The question isn't whether you believe in $150 or $250 oil, but whether your portfolio will be prepared when these prices become reality.
In 1965 / 2022, the US attempted the impossible: funding the Vietnam War / Ukraine & Israel conflicts, while maintaining the "Great Society" / COVID stimulus & "Green Deal" programs without raising taxes. The result: an explosion in money supply and the first inflation wave.
In 1971 / 2025, the second blow landed – the end of Bretton Woods / the rise of BRICS+ and de-dollarization. The dollar-gold link was severed, and silver staged a 215% / 325% parabolic jump in less than a year.
Two years later, after the US backed Israel in the Yom Kippur War / Iran escalation, the East hit back with an oil embargo / closure of the Strait of Hormuz. Energy prices quadrupled, the economy locked into stagflation, and gold began its historic ascent.
Oops... The last sentence is a SPOILER. It happened back then, but it's different now, right? Or is it?
Take a look at the chart I’m working on. The blue line is US inflation; the green line is the Gold/SPX ratio. The mathematical precision is frightening:
Inflation:
> 1957 – 1968: Sideways movement with peaks around 4%, followed by a sharp increase. The period from trough to trough is 5 years.
> 2011 – 2021: Sideways movement with peaks around 4%, followed by the current spike. The period from trough to present is exactly 5 years.
GOLD/SPX Ratio:
> 1960 – 1972: Formation of a bottom with 4 touches of the trendline before the massive breakout.
> 2015 – 2025: Identical bottom with 4 touches before the breakout (the fractal is repeating with a phase 2 years shorter).
The Stagflation Thesis
With the Strait of Hormuz closed and resource shocks, the three inflationary peaks of the 70s are no longer a forecast—they are a repetition of history. We are currently at the bottom following the first peak, but with one critical difference: the world is at record-high debt levels today. In this context, stagflation is not just a crisis; it is a mechanism by which debt is devalued at the expense of savings.
You can print dollars, but you cannot print barrels of oil, copper, or nickel.
Closing the Strait of Hormuz is the "short line" (as described by Luke Gromen) that is rewriting the global balance. If energy is life, its scarcity is the economic death of the old model. The parabolic jump in gold and silver is just the beginning of this "liberation" from paper assets.
When the mathematics of debt meets the geopolitics of resources, real assets stop being just an investment—they become a sanctuary. The question isn't whether you believe in $150 or $250 oil, but whether your portfolio will be prepared when these prices become reality.
Disclaimer
The information and publications are not meant to be, and do not constitute, financial, investment, trading, or other types of advice or recommendations supplied or endorsed by TradingView. Read more in the Terms of Use.
Disclaimer
The information and publications are not meant to be, and do not constitute, financial, investment, trading, or other types of advice or recommendations supplied or endorsed by TradingView. Read more in the Terms of Use.