Gold next move (weekly analysis)(30th Mar-3rd April-2026)Go through the analysis carefully, and do trade accordingly.
Anup 'BIAS for the week (30th Mar-3rd April-2026)
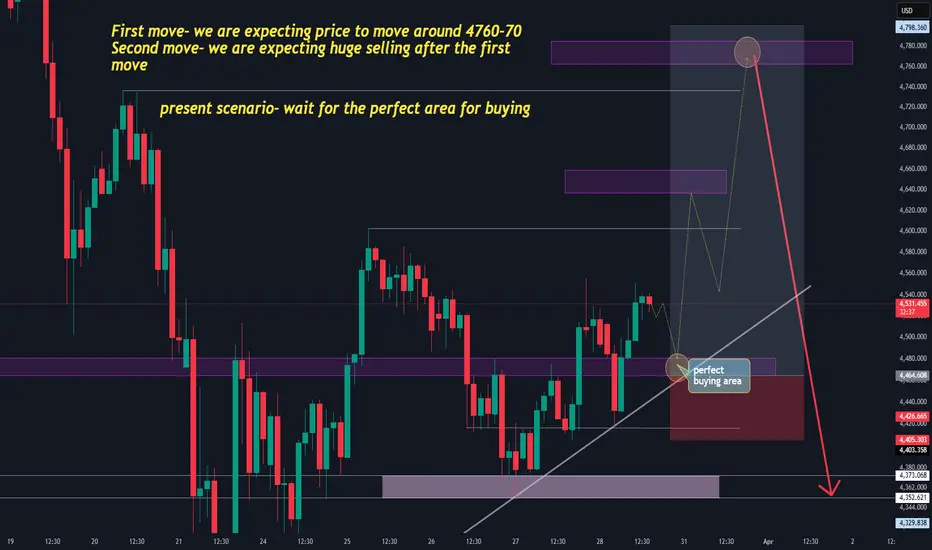
Current price- 4525
"if Price stays above 4410-20, then the next target is 4580, 4660 and 4760 and below it 4350 and 4300"
Present scenario-
1. Wait for the perfect area for buying
2. we can also take aggressive entry towards bullish side using small time frame support and demand.
What we expect
1. First move- we are expecting price to move around 4760-70
2. Second move- we are expecting huge selling after the first move
-POSSIBILITY-1
Wait (as geopolitical situation are worsening )
-POSSIBILITY-2
Wait (as geopolitical situation are worsening)
Best of luck
Never risk more than 1% of principal to follow any position.
Support us by liking and sharing the post.
Trend Analysis
You're Not Reading the Chart. You're Defending It.
Technical Analysis Doesn't Work. And Here's Why That's Your Mistake
The chart told you everything. You just didn't want to hear it.
That's not a market problem. That's a you problem - and it has a name.
Confirmation bias. Most people reading this are committing it right now. The ones who just thought "not me" - those are exactly the ones I mean.
You open the chart already knowing you want to buy. From that moment, your brain operates as a lawyer, not a judge. Bullish divergence on RSI? Noticed. Potential double bottom? Noticed. Bearish engulfing on the daily? Missed. Volume declining into the rally? Didn't see it.
This is the architecture of the mind. It is not a flaw you can fix with discipline alone. You cannot fix it until you start your analysis from the opposite end of the chart entirely.
━━━━━━━━━━━━━━━━━━━━━━━━━━━━━
Three moments in Bitcoin's history where the crowd saw one thing and the market did another
November 2021. BTC breaks $69,000. Everyone sees a flag on the weekly, targets $100,000. I was looking at the same chart and seeing Wyckoff distribution - the same signals, interpreted through a different lens. The majority didn't want to see it. Bitcoin spent the next 12 months collapsing to $15,500.
January 2023. BTC recovers to $23,000. "Bear market is over." "New bull cycle." I wrote at the time: this is a bear market rally, not a reversal. Those who saw what they wanted to see bought at $23,000 and sold at a loss a month later.
September 13, 2025. BTC at $95,000–$100,000. I closed all positions and published a post: the bull market is over. (The post is on my TradingView profile - the date is there, the words are there.) Three months later, those who saw only upside had lost 30–40%. This is not a claim. It is a record.
━━━━━━━━━━━━━━━━━━━━━━━━━━━━━
One shift that changes everything
Stop building analysis from a thesis. Build it from falsification.
Before entering any trade, ask yourself one question: what would have to happen on this chart for me to admit I was wrong?
Most traders cannot answer this. They enter without knowing when they're wrong. That's not analysis - it's gambling with a professional aesthetic.
Real analysis starts with locating liquidity. Where are the stops? Where does the market need to go to collect liquidity before the real move begins? When you look at a chart through this lens, you stop seeing patterns and start seeing mechanics.
━━━━━━━━━━━━━━━━━━━━━━━━━━━━━
What this looks like on the current chart
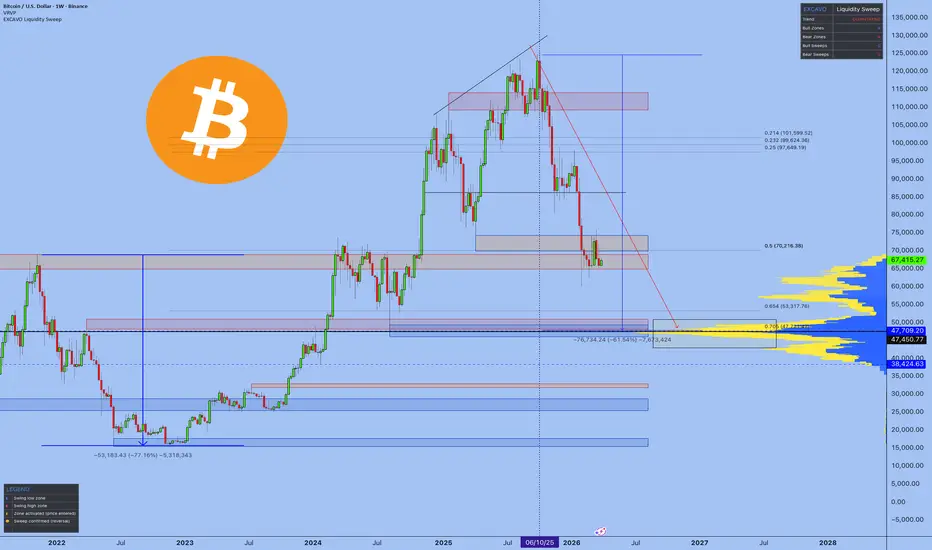
Right now, BTC is trading around $67,000. The majority sees a correction. A temporary pullback - before the continuation. That's the consensus. And the consensus is almost always where the liquidity sits.
On the weekly chart, the picture is different. My Liquidity Sweep indicator (available on my TradingView profile) shows activated bearish zones. Price has left the distribution range ($95,000–$120,000) and is moving structurally lower. The red arrow on the chart is not a scare tactic. It is mechanics.
Where are the stops of everyone "buying the dip"? Clustered directly below current support. The key liquidity zone: $47,000–$50,000. That is where the market needs to go before any credible case for reversal can be made.
Where BTC goes from here - the market will answer. What I'm telling you is this: traders buying the "correction" have already decided. They're not reading the chart anymore. They're reading permission slips.
━━━━━━━━━━━━━━━━━━━━━━━━━━━━━
Anti-bias checklist before entry
Write these down. On paper. Not in your head.
1. What do I see on this chart that argues against my idea? If you can't find one thing - you're not analyzing. You're praying.
2. Where are the stops of traders who think exactly like me - and is there a scenario where the market sweeps those stops before going where I expect?
3. If I were already positioned against this trade, what would I see?
4. What is the specific level - not a range, a level - at which I will say: I was wrong?
If you cannot answer question four, do not open the position. The market does not care about your thesis.
━━━━━━━━━━━━━━━━━━━━━━━━━━━━━
Here is a paradox worth writing down and taping above your monitor:
The most dangerous trader is not the one who ignores technical analysis. The most dangerous trader is the one who has mastered it — and uses that mastery to justify what he already wanted to do.
Knowledge gives you more tools to build a case. It gives you no immunity from building the wrong one. The more you know - the more convincing your mistake sounds.
Technical analysis works. It works very well. Just not in the hands of a trader who uses it to confirm a decision made before the chart was even opened.
Best Regards, EXCAVO
Gold 30Min Engaged ( Bearish Entry Detected )⚡Base : Hanzo Trading Alpha Algorithm
The algorithm calculates volatility displacement vs liquidity recovery, identifying where probability meets imbalance.
It trades only where precision, volume, and manipulation intersect —only logic.
✈️ Technical Reasons
/ Direction — SHORT / Reversal 4570
☄️Bearish rejection confirmed through sharp candle body.
☄️Lower-high forming beneath resistance supply region.
☄️Volume decreasing confirms exhaustion in price rally.
☄️Sellers regained imbalance with heavy top rejection.
☄️Algorithm detects fading demand and shift to control.
⚙️ Hanzo Alpha Trading Protocol
The Alpha Candle defines the day’s real control zone — the first battle of momentum.
From this origin, the Volume Window reveals where the next precision strike begins.
⚙️ Hanzo Volume Window / Map
Window tracked from 10:30 — mapping true market behavior.
POC alignment exposes institutional bias and breakout potential zones.
⚙️ Hanzo Delta Window / Pulse
Delta window monitors real buying vs. selling power behind each move.
Tracks volume aggression to expose who controls the candle — buyers or sellers.
When Delta aligns with Volume Map, momentum becomes undeniable.

BTC: Another Attempt To Start The Bullish TrendBTC: Another Attempt To Start The Bullish Trend
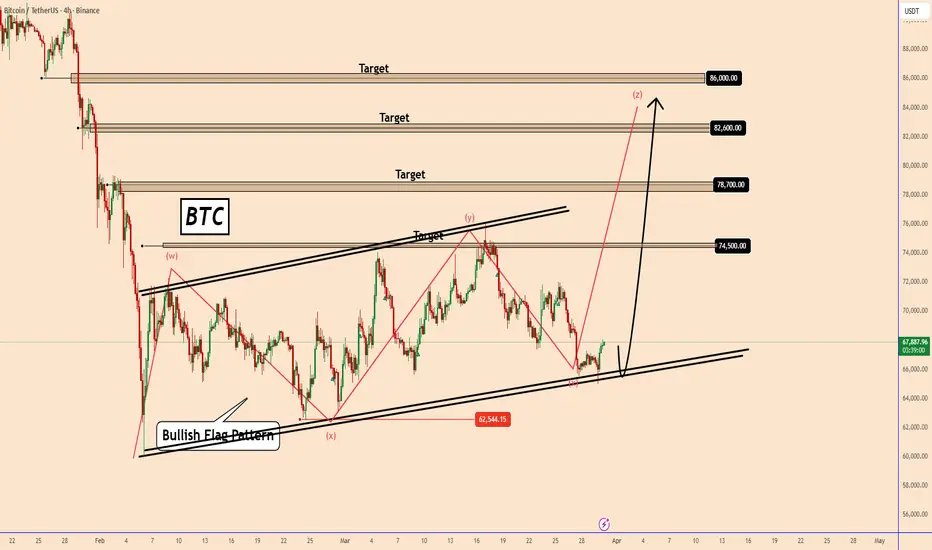
The current setup we have for BTC is one that I have shared before and it only managed to hit the first target and enter a larger structural area.
Currently BTC is transformed more but looks like we can be in a very large WXYXZ movement. BTC is on the Z wave and looks like it can be ready to start soon.
Overall is very risky with the market conditions until the price takes a clear direction.
So, let’s see how BTC will develop again, considering that the market dynamics are very high and everything is changing rapidly.
Key targets:
74500
78700
82600
8600
You may find more details in the chart.
Thank you and good luck! 🍀
BTCUSDTHello Traders! 👋
What are your thoughts on Bitcoin?
Bitcoin has formed a clear descending channel after consistently printing lower highs and lower lows. However, over the past two months, price has been consolidating within a trading range, moving sideways without a clear directional trend. Currently, price is positioned around the mid-range, and as long as this range remains intact, a sharp impulsive move is unlikely.
Bearish Scenario (Primary View):
Based on the current market structure, as long as price remains:
• Inside the descending channel
• Below the key resistance / supply zone
The overall bias remains bearish.
In this scenario:
• A breakdown below the range support
• Would confirm continuation of the downtrend
• Opening the path toward lower levels (channel lows and beyond)
Bullish Scenario (Alternative):
If price manages to:
• Break above the descending channel
• And reclaim the resistance zone with strong confirmation
Then the bearish outlook would be invalidated, suggesting a potential trend reversal or a deeper bullish correction.
Although the market is currently in a consolidation phase, the broader structure remains bearish. Therefore, until key breakout levels are taken, downside continuation remains the higher-probability scenario.
Please don’t forget to like and share your thoughts in the comments! ❤️

THIS IS NOT A REVERSAL, THIS IS HOW LIQUIDITY GETS TRAPPEDThe gold market enters the new week in a characteristic state of repricing after strong fluctuations, as the entire previous structure has been broken and capital is seeking a balance point. The macro context remains tug-of-war: growth shows signs of slowing but inflation has not truly cooled, making monetary policy expectations unpredictable. This is not a favorable environment for a sustainable upward trend, but an ideal condition for strong fluctuations – liquidity sweeps – and market psychology traps.
On the D1 frame, after a strong breakdown breaking the long-term upward trendline, gold has rebounded but was quickly blocked at the confluence zones of Fibo 0.5–0.618 and FVG above. This indicates that the recent increase has not been accumulative, but mainly a pullback in a larger downtrend. The weekly close with a slight reclaim above the short-term demand zone is not enough to confirm a reversal, but is likely just a rebalancing act before continuing to move.
This week, the important price zone to watch is 4750–4900, where the old demand, trendline, and medium-term Fibonacci levels converge. This will be the decisive area to see if the market continues to be rejected to maintain the downtrend, or can extend the rebound deeper. If the price cannot hold above this zone and shows signs of weakening, the main scenario remains a continuation down to the 4300–4100 area, where large liquidity is concentrated and has not been fully tested.
Conversely, if the capital is strong enough to keep the price above the 4900 zone and create a higher low structure on D1, the market may extend the rebound to higher zones around 5100–5300. However, it should be emphasized that in the current context, such increases should still be viewed as recovery in a downtrend, until clear accumulation over time appears.
Overall, gold is still in a phase where a long-term bottom has not formed. A real bottom does not come from a strong bounce, but from a long enough accumulation process to completely break market expectation psychology. Currently, that factor has not appeared, and capital still tends to take advantage of rebounds to distribute. Therefore, the week of 30/03–03/04 is likely to continue being a phase of liquidity testing and redefining the main direction, with a bias towards a downward scenario if important resistance zones are not conquered.
LucasGrayTrading

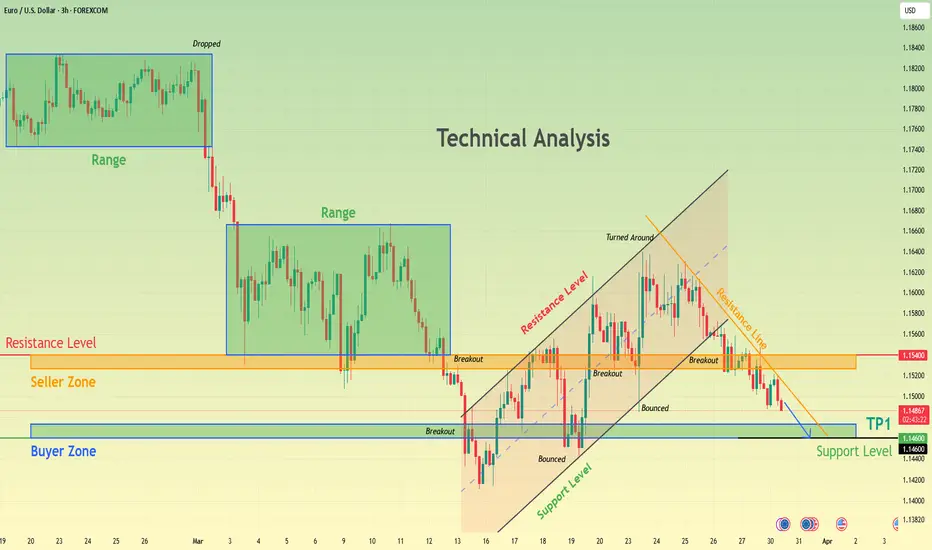
EURUSD Selling Pressure Builds - Support at 1.1460 AheadHello traders! Here’s my technical outlook based on the current EURUSD (3H) chart structure. Price initially moved inside a range before breaking down sharply, confirming strong bearish momentum. After the drop, EURUSD formed another consolidation range, which later broke to the downside, reinforcing the bearish trend. Currently, price is trading below the 1.1540 resistance (seller zone) and approaching the 1.1460 support (buyer zone). The market is also forming a lower high within a descending structure after rejecting the recent resistance trend line. As long as price remains below the 1.1540 resistance, the bearish bias stays valid. A continuation lower could push EURUSD toward the 1.1460 support (TP1), which is the main downside target. Please share this idea with your friends and click Boost 🚀
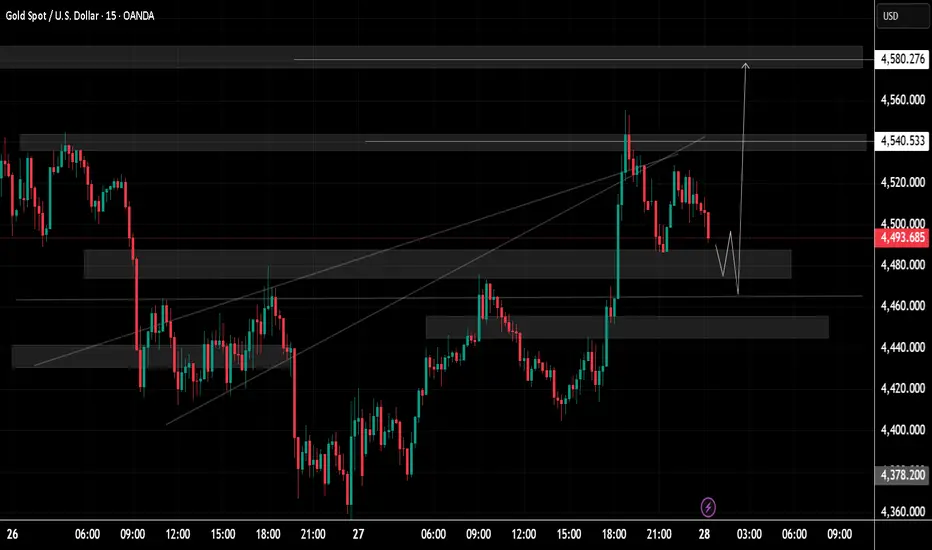
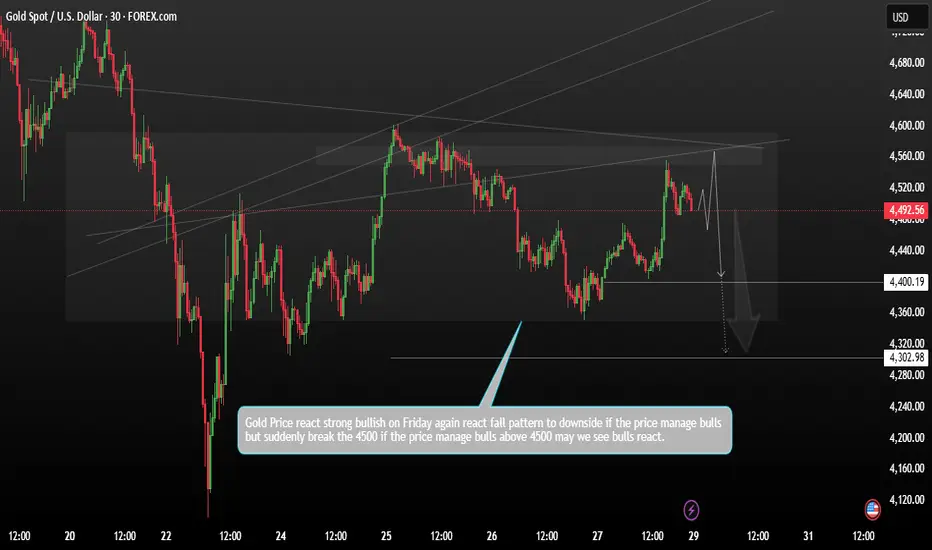
GOLD Price Update – Clean & Clear ExplanationGold is currently trading around 4,493, showing signs of short-term weakness after a strong bullish impulse. The market recently experienced a sharp upward move, pushing price into a key resistance zone near 4,540 – 4,580, where selling pressure has emerged.
now price in a downward phase, with sellers in control—price making lower highs and lower lows. That bearish pressure eventually slowed, and the market began to base and accumulate, forming a gradual transition into an uptrend.
Key zones to focus on
Resistance: 4,530 – 4,580
Support / Demand: 4,460 – 4,480
The Gold strong rally, price is now pulling back and consolidating below resistance the structure shows lower highs forming, indicating temporary bearish pressure.
“If you come across this post, please like, comment, and share. Thanks!”
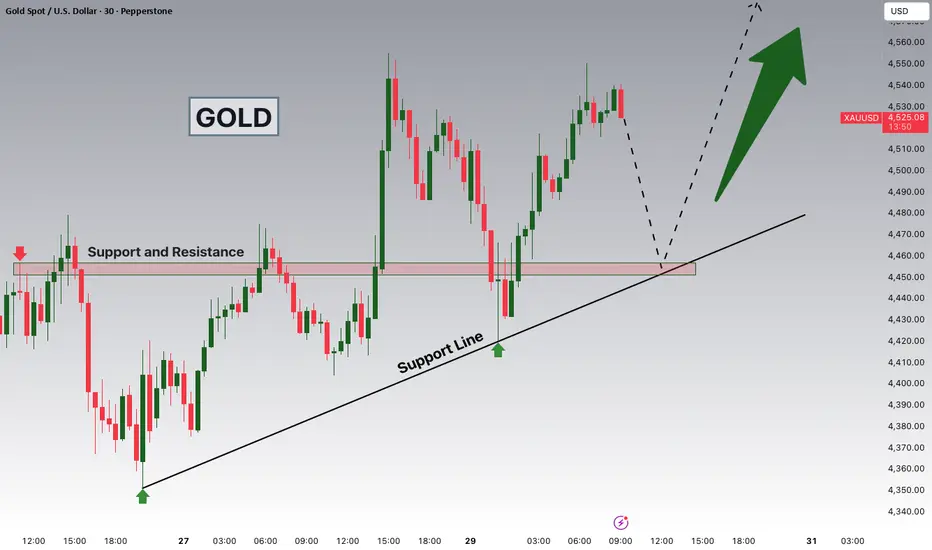
XAUUSD Bullish at 4460 Ahead of NFP and Geopolitical Risks!Hey Traders, in today's trading session we are monitoring XAUUSD for a buying opportunity around the 4,460 zone. Gold is trading in an overall uptrend and currently is in a correction phase in which price is approaching the trendline support around the 4,460 support and resistance area.
From the macro side, gold remains fundamentally supported by ongoing geopolitical tensions in the Middle East, which continue to keep safe-haven demand active across the market. At the same time, extreme volatility in oil prices is increasing inflation uncertainty, which keeps investors cautious and supportive of long-term gold demand.
Although the US Dollar is still trading near multi-month highs and Treasury yields remain elevated, gold’s recent pullback appears more corrective than structural. The move into the 4,460 demand zone aligns with dip-buying interest, especially as traders begin positioning ahead of this week’s high-impact US data releases, including ISM and Nonfarm Payrolls, which could quickly weaken the dollar if data misses expectations.
As long as price holds above the 4,460 support zone, the broader bullish structure remains intact, and we anticipate a continuation move toward higher resistance levels as safe-haven flows and macro uncertainty continue to support the upside.
Trade safe
Joe
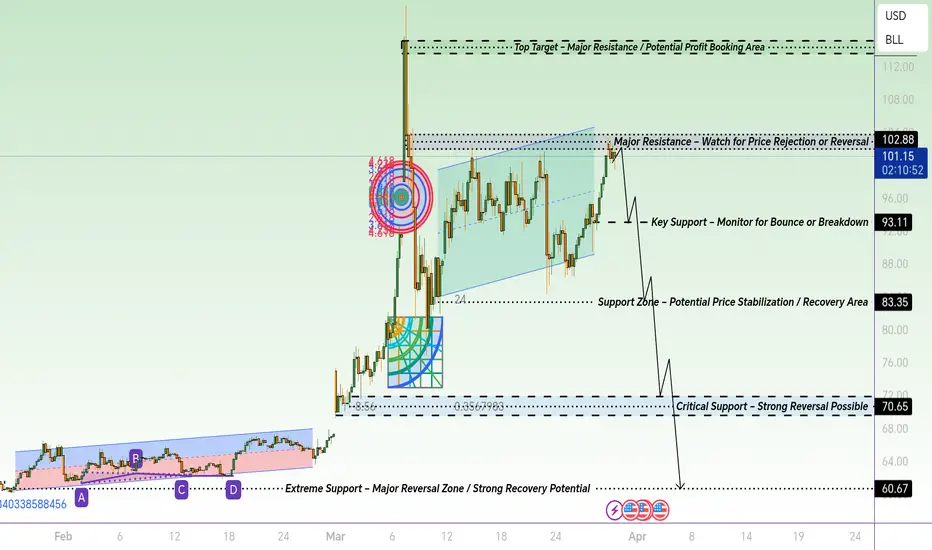
Oil Trend Analysis – Key Support & ResistanceThis chart outlines potential price movements for oil, highlighting critical support and resistance levels. The current structure suggests a possible downward correction from the 102.88 zone, with key targets at 93.11, 83.35, 70.65, and 60.67. Monitor the trend for price reactions, consolidation areas, and potential breakout or reversal points.
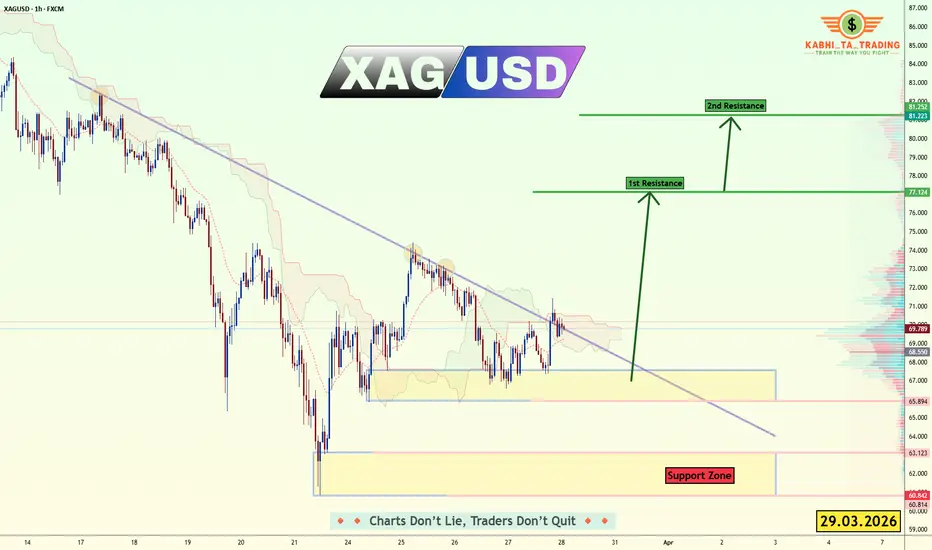
XAG/USD - Breakout Watch – Silver Ready for a Bullish Expansion?📊 Description & Setu p FX:XAGUSD
XAGUSD is currently consolidating within a strong support zone after breaking out of a major descending trendline on the 1h chart. If we see a decisive bounce and sustained momentum from this base, it opens the door for a high-probability play toward our upper resistance targets.
🧭 Daily Bias: Bullish 🟢
🎯 Trade Intent: Looking for BUY setups 📈
🛠️ Technical Confluences:
• Price reacting from strong demand zone (60.80 – 63.10)
• Multiple rejections from descending trendline resistance (weakening sellers)
• Consolidation structure indicating accumulation before expansion 📐🕯️
🌍 Macro & Fundamental Catalyst:
Precious metals are supported by safe-haven demand and shifting rate expectations. Any signs of USD weakness or dovish central bank tone could accelerate upside in silver. 🏦⚖️
🟢 Targets / Resistance:
R1: 77.124 (1st Resistance)
R2: 81.223 - 81.252 (2nd Resistance)
🔴 Invalidation / Support:
S1: 65.894 (Bottom of immediate accumulation zone)
S2: 63.123 - 60.842 (Major Lower Support Zone)
⚠️ Disclaimer
This analysis is for educational purposes only and not financial advice. Always manage your risk.
#XAGUSD #ForexTrading #TechnicalAnalysis #PriceAction #TradingSetup #Silver #PreciousMetals
If you find this analysis useful: 👍 Like the idea
💬 Comment your view — Are you taking the Buy or the Sell?
⭐️ Follow for daily high-probability setups
Charts Don’t Lie — Traders Don’t Quit. 📈
CRUDE OIL (USOIL): Bullish Continuation ConfirmedHere's an intraday bullish confirmation on 📈CRUDE OIL after a bullish breakout of an intraday horizontal resistance level on a 4-hour timeframe.
Upon retesting the previously broken structure, we see a violation of the resistance line of a bullish flag pattern.
From my perspective the market is likely to reach the 105.00 level soon.

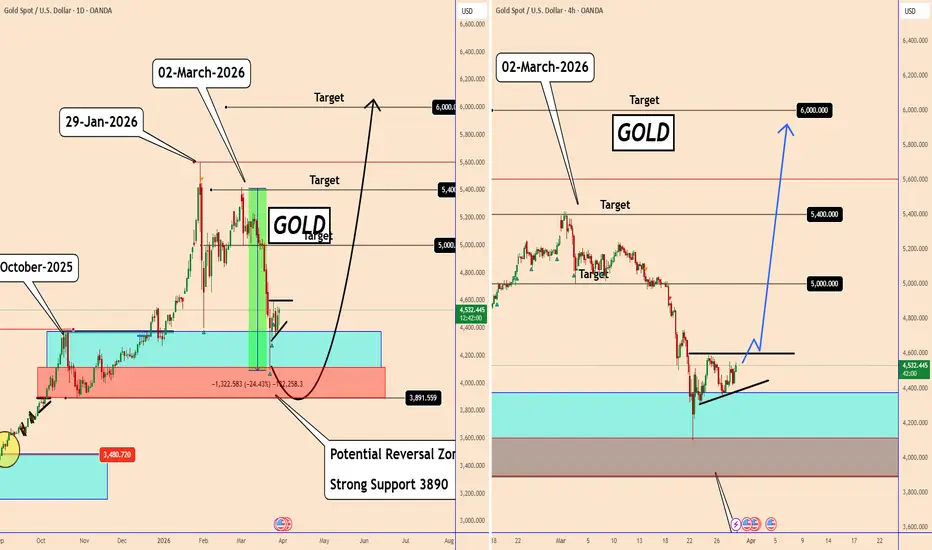
GOLD: From Manipulated Drop to Bullish SetupGOLD: From Manipulated Drop to Bullish Setup
From our old analysis, gold found a clear and strong support area near the red 4130 area after that huge -26% drop in a few days and all for no reason, as we all saw.
Currently on the 4-hour charts, the price seems to be gathering for an upward move and forming an ascending triangle. Once the price moves above the triangle, a bigger move could happen.
On the other hand, Trump is only making comments about reaching a peace agreement, but peace is the only thing Trump and Israel want, making geopolitical tension increase every day and supporting the rise in the price of gold.
Key Targets:
4650
5000
5400
6000
You may find more details in the chart.
Thank you and good luck! 🍀
❤️ If this analysis helps your trading day, please support it with a like or comment ❤️
Previous analysis:
Selena | XAUUSD · 30M – Channel Correction Between Demand & SuppPEPPERSTONE:XAUUSD FOREXCOM:XAUUSD
Structure | Trend | Key Reaction Zones
Gold is currently trading inside a rising corrective channel after reacting from a key demand zone.
Market Overview
After a strong bearish move, price swept liquidity near 4200 and formed a solid base around the 4300–4400 demand zone. The market is now moving in a corrective bullish channel, indicating short-term recovery. However, price is approaching the 4600–4700 supply zone, which aligns with previous structure and could act as resistance. The reaction from this zone will determine whether the market continues higher or resumes the bearish trend.
Key Scenarios
✅ Bullish Case 🚀
Continuation within channel.
🎯 Target 1: 4600
🎯 Target 2: 4700
🎯 Target 3: 4800 – 4900
Current Levels to Watch
Resistance 🔴: 4600 – 4700
Support 🟢: 4300 – 4400
⚠️ Disclaimer: This analysis is for educational purposes only. Not financial advice.

BTCUSDT Short: Weak Demand Signals Liquidity Sweep to 66KHello traders! Here’s my technical outlook based on the current BTCUSDT (4H) chart structure. BTC previously traded inside a range, after formed a rising trend line. The market faced rejection from a pivot high under a descending supply line, BTC broke below the trend line and the 68,400 supply zone.
Currently, price is trading below resistance and approaching the 66,000 demand zone, where a short-term reaction may occur. The structure now shows lower highs forming, indicating weakening bullish momentum.
As long as BTCUSDT remains below the 68,400 resistance and respects the descending supply line, the bearish bias stays valid. A continuation lower could push price toward the 66,000 support (TP1) as the next downside target. Manage your risk!

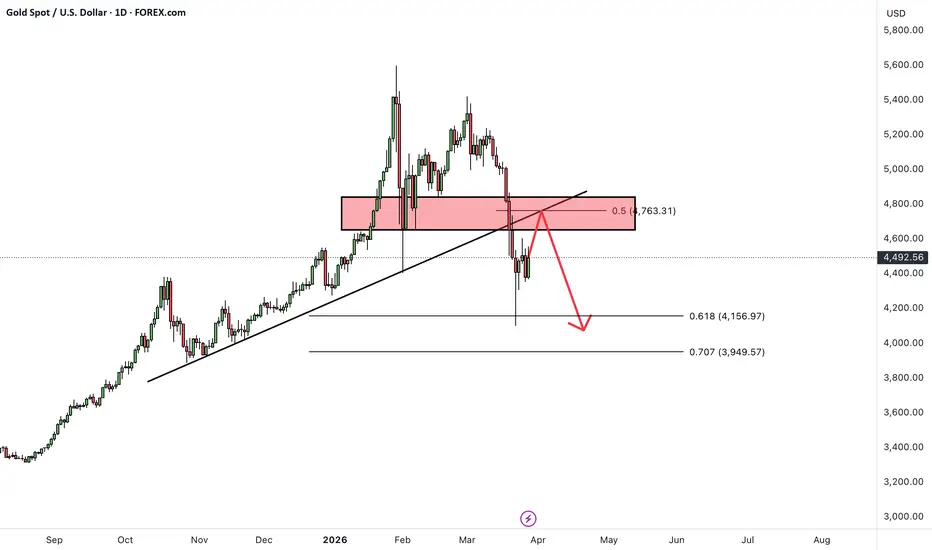
XAUUSDHello Traders! 👋
What are your thoughts on Gold?
Following a strong bullish rally, Gold has entered a corrective phase. The breach of the ascending trendline provides a clear signal that the previous bullish structure is weakening. Currently, the price is performing a pullback toward a key confluence area, where the supply zone aligns with the broken trendline and the 0.5 Fibonacci retracement level.
This convergence zone is expected to act as a significant resistance, potentially leading to a price rejection. Should the price react to this level and complete the pullback, it is anticipated to initiate a new bearish wave, targeting lower support levels.
A convincing break and sustained consolidation above this resistance zone will invalidate the bearish outlook.
Please don’t forget to like and share your thoughts in the comments! ❤️
Gold 30M Bullish Structure Holding Above SupportGold has shifted into a short-term bullish structure after a CHoCH, with price holding above the rising trendline support. The market is consolidating near support while maintaining higher lows, suggesting potential continuation to the upside.
Bullish continuation: if price holds the 4,485–4,465 support zone, it may continue higher toward the 4,600 weekly high resistance.
Deeper pullback: a break below support could lead to a retracement into the 4,420 demand zone (order block + FVG) before a potential rebound.
Key levels
Resistance: 4,600 (weekly high
Current resistance area: ~4,500
Support zone: 4,485–4,465
Lower demand zone: ~4,420
Short-term bullish while above 4,465, with upside targets in focus.
This is a technical analysis idea for educational purposes, not financial advice.

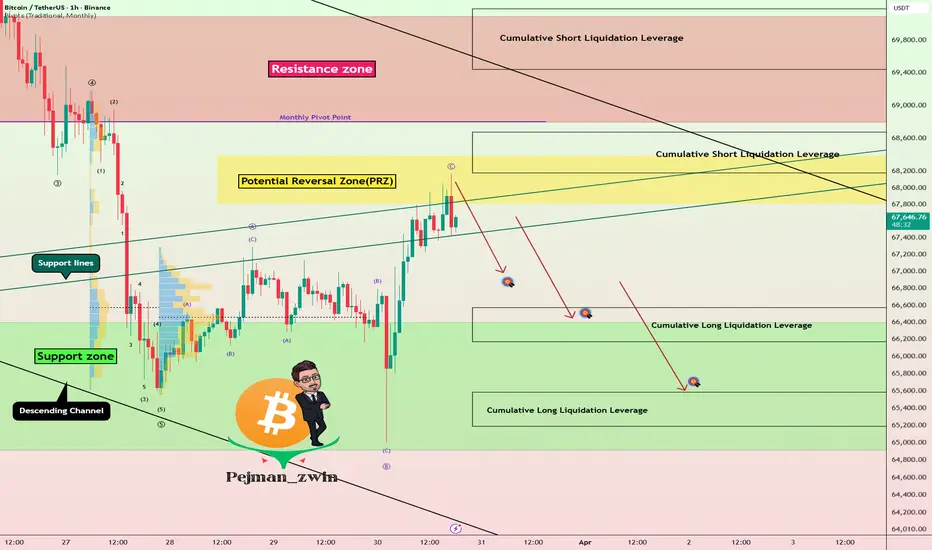
Bitcoin Reached the PRZ | Now the Reaction Matters MostAs I expected in the previous idea , Bitcoin ( BINANCE:BTCUSDT ) started rising from the support zone($66,400-$64,900) and reached all of its targets (full target).
Currently, Bitcoin is moving near the potential reversal zone (PRZ) and the Cumulative Short Liquidation Leverage ($68,670-$68,180). This recent move can be seen as a pullback to the broken support lines.
From an Elliott Wave theory perspective, it seems that Bitcoin is completing a corrective Expanding Flat(ABC/3-3-5), finishing its wave C.
I expect that, in the coming hours, Bitcoin will once again start declining and drop at least to $66,833.
First Target: $66,833
Second Target: Cumulative Long Liquidation Leverage($66,570-$66,170)
Third Target: Cumulative Long Liquidation Leverage($65,580-$65,190)
Stop Loss(SL): $68,890
Points may shift as the market evolves
Cumulative Short Liquidation Leverage: $70,190-$79,440
CME Gap: $84,560-$79,660
Note: The speech from Powell or any other important economic figure can influence the market trend if they discuss interest rates or significant economic topics.
Note: Any news or escalation of the Middle East conflict can cause a sudden shift in Bitcoin’s trend, so, once again, manage your capital carefully in your trades.
What do you think about Bitcoin—can it rise above $69,000, or will we see another decline again?
💡 Please respect each other's opinions and express agreement or disagreement politely.
📌Bitcoin Analysis (BTCUSDT), 1-hour time frame.
🛑 Always set a Stop Loss(SL) for every position you open.
✅ This is just my idea; I’d love to see your thoughts too!
🔥 If you find it helpful, please BOOST this post and share it with your friends.
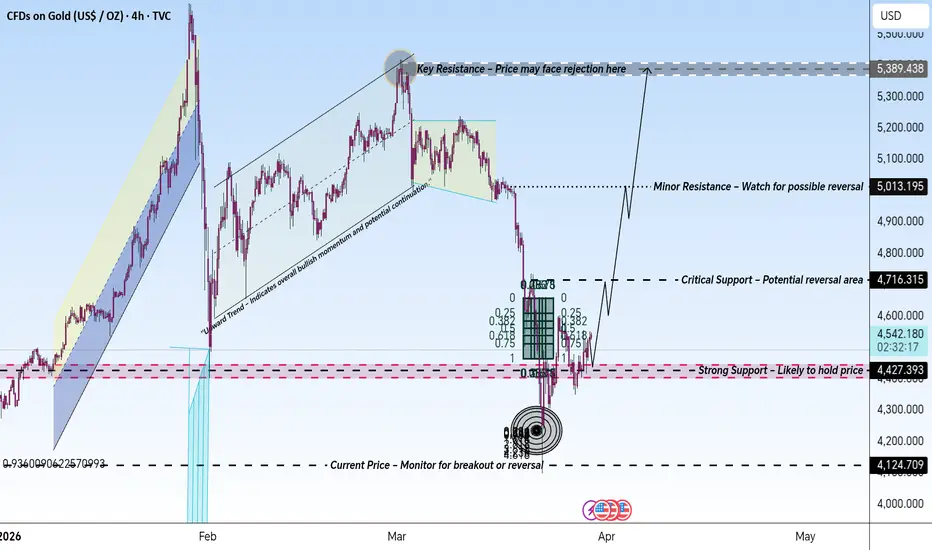
Gold Price Action – Key Support and Resistance Levels with TrendThis chart provides a detailed analysis of Gold (XAU/USD), focusing on crucial support and resistance levels. The Key Resistance at 5,389.438 USD marks a strong potential rejection point. Minor Resistance at 5,013.195 USD could signal a price reversal, while the Critical Support at 4,716.315 USD represents an important level to watch for price action.
The Current Price at 4,542.445 USD is an active level to monitor closely for either a breakout or reversal. Strong Support at 4,427.393 USD is expected to hold the price, potentially leading to a bullish move.
The Upward Trend Channel suggests overall bullish momentum, indicating that price may continue moving upward, with further opportunities at these key levels. Traders should monitor these levels to adjust their positions accordingly based on market behavior.
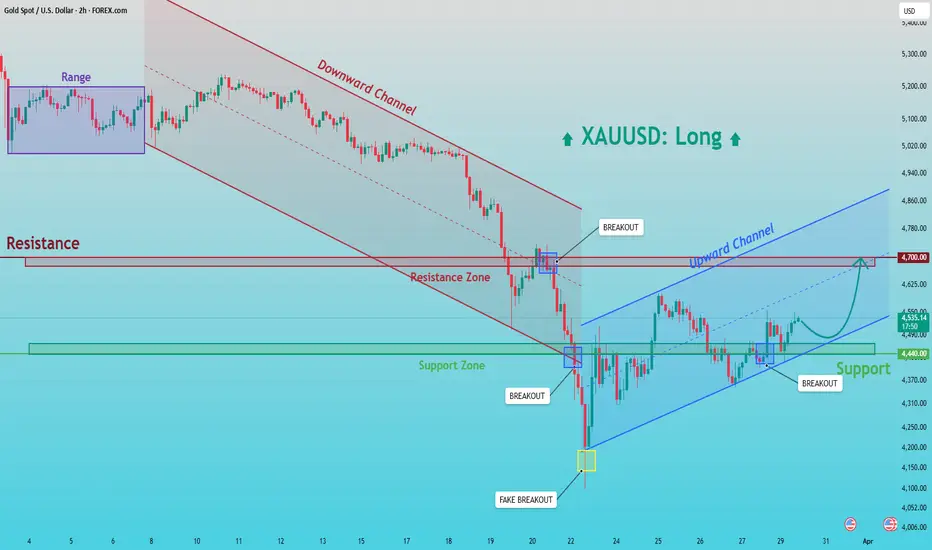
XAUUSD: Bullish Recovery from 4,440 - Price Targets 4,700 SupplyHello everyone, here is my breakdown of the current XAUUSD setup.
Market Analysis
Gold was previously trading inside a downward channel, showing consistent bearish pressure with lower highs and lower lows. After a strong drop, price found support around the 4,440 zone and formed a base, followed by a breakout above resistance, signaling a shift in momentum.
Currently, price is trading inside an upward channel and holding above the 4,440 support zone, confirming it as a key demand area. At the same time, gold is approaching the 4,700 resistance zone, which aligns with a previous rejection level.
My Scenario & Strategy
As long as XAUUSD holds above the 4,440 support and respects the ascending channel, the bullish bias remains valid. A continuation higher could push price toward the 4,700 resistance, which is the main upside target.
However, if price breaks below 4,440, the bullish scenario would weaken and a deeper pullback could follow.
That’s the setup I’m tracking. Thank you for your attention, and always manage your risk.
Micron Technology - Heading for another -50%!☠️Micron Technology ( NASDAQ:MU ) is perfectly following all structure:
🔎Analysis summary:
I remember literally everyone hating on me calling the top on Micron Technology. Yet just two weeks later, we are witnessing a harsh -30% correction. Looking at the higher timeframe this is just the beginning and Micron Technology can correct another -50%.
📝Levels to watch:
$150
SwingTraderPhil
SwingTrading.Simplified. | Investing.Simplified. | #LONGTERMVISION

GOLD market is leaning slightly bearishGold is trapped in a range near resistance, and the market is leaning slightly bearish. Unless buyers can break above 4,550 with strength, the more probable move ,
Tecnically few sessions, gold has gone through a sharp sell-off followed by a steady recovery. After the deep drop (visible on the left side), buyers stepped in strongly, pushing price back up. However, that recovery lost momentum as price approached a major resistance zone around 4,550 Since then, the market has transitioned into a sideways consolidation phase, forming a range Inside this range, price action has become choppy, with lower highs forming near resistance, suggesting that buyers are struggling to push higher. At the same time, support has been tested multiple times, which weakens it over time.
Resistance ; 4520 / 4600
Support ; 4400 / 4300
The most recent movement shows a failed attempt to push higher, followed by hesitation just below resistance a classic sign of distribution, where buying strength may be fading.
You may find more details in the chart,
Trade wisely best of luck buddies.
Ps; Support with like and comments for better analysis Thanks for Supporting.
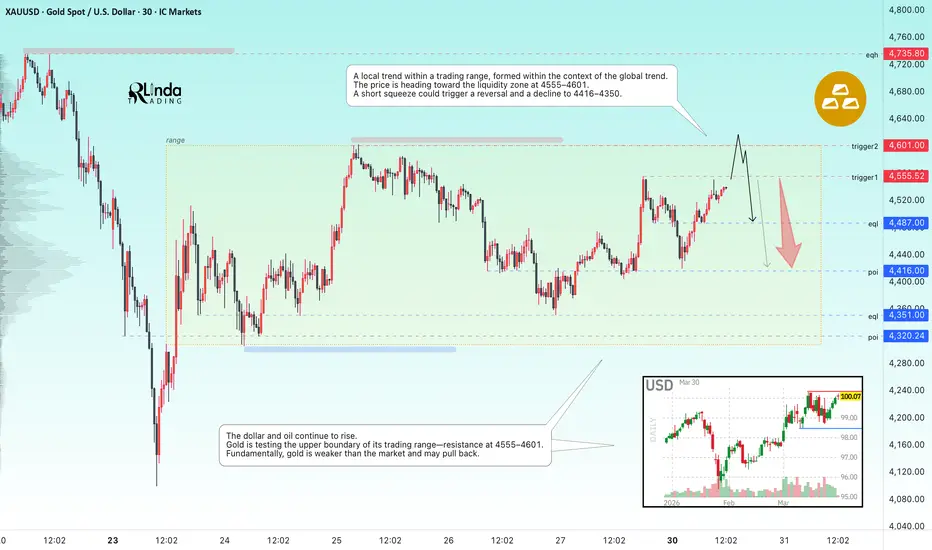
GOLD - A countertrend correction before a decline ICMARKETS:XAUUSD is under pressure again at the start of the week. A counter-trend retest of the 4555–4600 range is forming amid a strong dollar and rising oil prices.
The conflict in the Middle East is escalating, and threats to global trade are mounting. Iran is preparing for a possible U.S. ground invasion of Kharg Island. With the risk of the Bab el-Mandeb Strait being blocked by Yemeni Houthis, such a blockade would further boost the dollar and oil prices, exerting enormous pressure on markets and driving up inflation.
As the war expands to new fronts (the Red Sea, Lebanon) and the Fed shows no rush to ease policy, gold will remain under pressure. The bearish trend persists, with a key trigger at 4600
Resistance levels: 4550, 4600, 4735
Support levels: 4487, 4416, 4350
Technically, if bears hold the resistance of the current range, gold may remain within it and head toward the liquidity zone formed at 4416. I do not rule out the possibility of a rally to 4735 as part of market manipulation before a stronger decline.
Best regards, R. Linda!