📊 Candlesticks — the most popular way to read price action
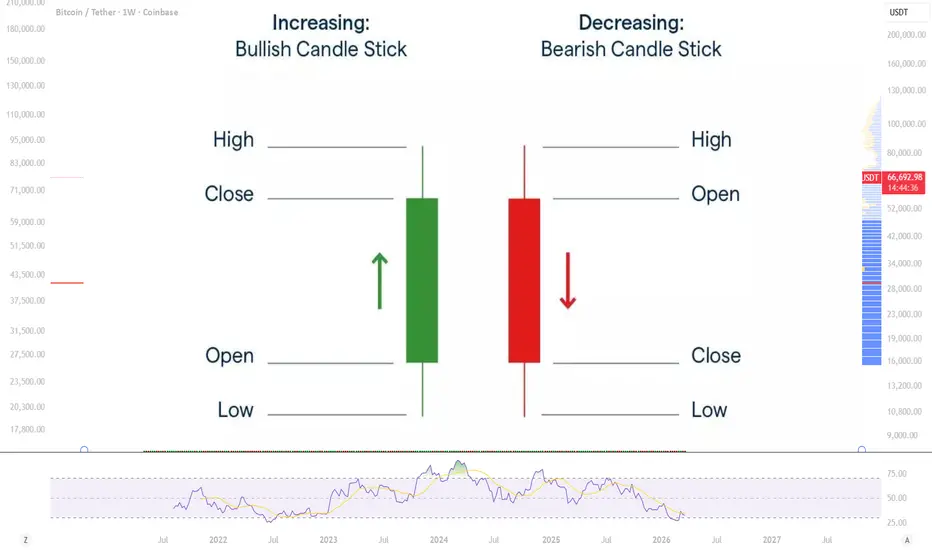
The wide part of the candle is called the body.
It shows the price range between the open and close for a given period.
🟥 A red candle forms when the close is below the open
🟩 A green candle forms when the close is above the open
The thin lines above and below the body are called wicks(shadows)
They represent the highest and lowest prices during that session
Important: The higher the timeframe — the more reliable the candlestick pattern

📚 Spinning tops are candles with a small body that reflect a strong battle between buyers and sellers.
Typically, this pattern is considered neutral and often appears within a tight trading range.
Spinning tops can be both bullish(green) and bearish(red).
💭 Doji is a type of candlestick with little to no body.
The entire candle is basically made up of wicks.
This pattern forms when the open and close are the same(or very close) within a trading session.
The length of the wicks can vary — they can be short or very long.
🔨 Hammer and Hanging Man are among the most popular reversal patterns.
What makes them interesting is that they can be both bullish or bearish, depending on where they appear in the market cycle.
If this candle appears after a downtrend, it signals weakening selling pressure — this is called a Hammer.
If the same candle appears after an uptrend, it signals weakening buying pressure — this is called a Hanging Man.
🔍 How to identify them:
1️⃣ The body is located at the top of the price range
2️⃣ The lower wick is at least 2x longer than the body
3️⃣ There is little to no upper wick
The longer the lower wick and the smaller the body, the stronger the signal — whether it’s a bullish Hammer or a bearish Hanging Man.
📲 Engulfing pattern is formed by two candles with opposite-colored bodies and is one of the most important reversal signals in the market.
Key conditions:
1️⃣ There must be a clear uptrend or downtrend in the market
2️⃣ The pattern consists of two candles, where the second candle fully engulfs the first one
3️⃣ The second candle must be opposite in color
Factors that increase the probability of a reversal:
1️⃣ The first candle has a small body, while the second one is much larger — this shows the previous trend is weakening and a new one is gaining strength
2️⃣ The engulfing pattern appears after a prolonged or strong trend
3️⃣ The second candle is formed with high trading volume
4️⃣ The second candle engulfs multiple previous candles
☁️ Dark Cloud Cover is a two-candle pattern that appears after an uptrend and signals a potential top reversal.
The first candle should have a strong bullish(green) body. On the next session, the price opens above the previous high, but then closes near the lows, covering a significant part of the previous bullish candle.
The lower the close of the second candle, the higher the probability of a trend reversal.
Key factors that strengthen the signal:
1️⃣ The closer the red candle closes to the open of the previous green candle, the higher the chance of a market top
2️⃣ If after a prolonged uptrend there is a strong bullish candle(open = low, close = high), followed by a strong bearish candle(open = high, close = low), this is often referred to as an extreme reversal day
3️⃣ If the second candle opens above a key resistance level and then drops, it shows that buyers are losing control
4️⃣ A high trading volume on the second candle increases the probability of the uptrend ending
⛅️ Piercing Pattern is the opposite of the Dark Cloud Cover. It consists of two candles that appear during a downtrend and signals a potential bottom reversal.
The first candle is bearish(red), and the second one is a strong bullish(green) candle.
This pattern is purely bullish and closely related to the bullish engulfing pattern:
The green candle only partially covers the previous red candle. The more of the red body it covers, the higher the probability of a reversal.
In an ideal setup, the green candle should close above the midpoint of the previous red candle.
Variations(weaker bullish signals):
1️⃣ Weak — the green candle closes near the low of the previous candle
2️⃣ Moderate — the green candle closes slightly above the red candle’s close
3️⃣ Shallow push — the green candle fails to reach the midpoint of the red candle
⭐️ Star pattern is a reversal formation represented by a candle with a small body that gaps away from a previous candle with a large body. Wicks can overlap — that’s acceptable.
Stars can appear both at tops and bottoms, and there are several variations of this pattern.
Morning Star(bullish reversal)
A bottom reversal pattern consisting of:
1️⃣ A strong bearish(red) candle
2️⃣ Followed by a small-bodied candle that gaps down(the star)
3️⃣ Then a strong bullish(green) candle that covers a significant portion of the first candle
This indicates that buyers are taking control.
Evening Star(bearish reversal)
The bearish counterpart of the Morning Star, signaling a top reversal:
1️⃣ A strong bullish(green) candle
2️⃣ Followed by a small-bodied candle(the star)
3️⃣ Then a strong bearish(red) candle that covers a significant part of the first candle
Factors that strengthen the signal:
▪️ Gaps between the first candle and the star, as well as between the star and the third candle
▪️ The third candle covers a significant portion of the first candle’s body
▪️ Low volume on the first candle and high volume on the third candle
🌟 Shooting Star is a two-candle pattern that warns of a potential end of an uptrend, but it’s not considered one of the strongest reversal signals.
1️⃣ The candle has a small body located at the lower part of the range and a long upper wick
2️⃣ Like other star patterns, the color of the body doesn’t matter
3️⃣ Ideally, the body forms a gap relative to the previous candle, but this is not required
Inverted Hammer looks very similar to a Shooting Star. It has a small body at the lower part of the range and a long upper wick.
However, unlike the Shooting Star, the Inverted Hammer appears after a downtrend and signals a potential bullish reversal at the bottom.
1️⃣ You should wait for the next candle to confirm the signal — ideally, it opens above the body of the Inverted Hammer
2️⃣ The larger the gap, the stronger the bullish signal
3️⃣ Another confirmation is a strong green candle closing higher
🌿 Harami is a candlestick pattern where a small candle forms within the body of a previous larger candle.
The word “harami” translates from Japanese as “pregnant” — the large candle is the “mother”, and the small candle is the “baby”.
Key features:
1️⃣ The small candle must be fully inside the body of the previous candle(wick length does not matter)
2️⃣ The smaller the “baby” candle, the stronger the signal
3️⃣ Harami is not a strong reversal signal — it usually indicates a pause in the market and the end of the previous trend
Harami Cross is a variation of this pattern:
Instead of a small-bodied candle, a Doji appears after the large candle.
This makes the pattern a much stronger reversal signal.
👮♀️ Belt Hold is a candlestick pattern represented by a long candle.
In the bullish case, it’s a strong green candle that opens at the low of the previous candle and then moves upward.
For the bearish version, everything works in reverse.
The longer the Belt Hold candle, the stronger its impact on the market.
Key points:
1️⃣ If the next candle closes above a bearish Belt Hold, it increases the probability of a continuation of the uptrend
2️⃣ If the next candle closes below a bullish Belt Hold, it signals that selling pressure is increasing again
_ _ _ _ _
👉 If you want to trade like a professional and not like a gambler — follow for real insights and strategies 🚀
The wide part of the candle is called the body.
It shows the price range between the open and close for a given period.
🟥 A red candle forms when the close is below the open
🟩 A green candle forms when the close is above the open
The thin lines above and below the body are called wicks(shadows)
They represent the highest and lowest prices during that session
Important: The higher the timeframe — the more reliable the candlestick pattern
📚 Spinning tops are candles with a small body that reflect a strong battle between buyers and sellers.
Typically, this pattern is considered neutral and often appears within a tight trading range.
Spinning tops can be both bullish(green) and bearish(red).
💭 Doji is a type of candlestick with little to no body.
The entire candle is basically made up of wicks.
This pattern forms when the open and close are the same(or very close) within a trading session.
The length of the wicks can vary — they can be short or very long.
🔨 Hammer and Hanging Man are among the most popular reversal patterns.
What makes them interesting is that they can be both bullish or bearish, depending on where they appear in the market cycle.
If this candle appears after a downtrend, it signals weakening selling pressure — this is called a Hammer.
If the same candle appears after an uptrend, it signals weakening buying pressure — this is called a Hanging Man.
🔍 How to identify them:
1️⃣ The body is located at the top of the price range
2️⃣ The lower wick is at least 2x longer than the body
3️⃣ There is little to no upper wick
The longer the lower wick and the smaller the body, the stronger the signal — whether it’s a bullish Hammer or a bearish Hanging Man.
📲 Engulfing pattern is formed by two candles with opposite-colored bodies and is one of the most important reversal signals in the market.
Key conditions:
1️⃣ There must be a clear uptrend or downtrend in the market
2️⃣ The pattern consists of two candles, where the second candle fully engulfs the first one
3️⃣ The second candle must be opposite in color
Factors that increase the probability of a reversal:
1️⃣ The first candle has a small body, while the second one is much larger — this shows the previous trend is weakening and a new one is gaining strength
2️⃣ The engulfing pattern appears after a prolonged or strong trend
3️⃣ The second candle is formed with high trading volume
4️⃣ The second candle engulfs multiple previous candles
☁️ Dark Cloud Cover is a two-candle pattern that appears after an uptrend and signals a potential top reversal.
The first candle should have a strong bullish(green) body. On the next session, the price opens above the previous high, but then closes near the lows, covering a significant part of the previous bullish candle.
The lower the close of the second candle, the higher the probability of a trend reversal.
Key factors that strengthen the signal:
1️⃣ The closer the red candle closes to the open of the previous green candle, the higher the chance of a market top
2️⃣ If after a prolonged uptrend there is a strong bullish candle(open = low, close = high), followed by a strong bearish candle(open = high, close = low), this is often referred to as an extreme reversal day
3️⃣ If the second candle opens above a key resistance level and then drops, it shows that buyers are losing control
4️⃣ A high trading volume on the second candle increases the probability of the uptrend ending
⛅️ Piercing Pattern is the opposite of the Dark Cloud Cover. It consists of two candles that appear during a downtrend and signals a potential bottom reversal.
The first candle is bearish(red), and the second one is a strong bullish(green) candle.
This pattern is purely bullish and closely related to the bullish engulfing pattern:
The green candle only partially covers the previous red candle. The more of the red body it covers, the higher the probability of a reversal.
In an ideal setup, the green candle should close above the midpoint of the previous red candle.
Variations(weaker bullish signals):
1️⃣ Weak — the green candle closes near the low of the previous candle
2️⃣ Moderate — the green candle closes slightly above the red candle’s close
3️⃣ Shallow push — the green candle fails to reach the midpoint of the red candle
⭐️ Star pattern is a reversal formation represented by a candle with a small body that gaps away from a previous candle with a large body. Wicks can overlap — that’s acceptable.
Stars can appear both at tops and bottoms, and there are several variations of this pattern.
Morning Star(bullish reversal)
A bottom reversal pattern consisting of:
1️⃣ A strong bearish(red) candle
2️⃣ Followed by a small-bodied candle that gaps down(the star)
3️⃣ Then a strong bullish(green) candle that covers a significant portion of the first candle
This indicates that buyers are taking control.
Evening Star(bearish reversal)
The bearish counterpart of the Morning Star, signaling a top reversal:
1️⃣ A strong bullish(green) candle
2️⃣ Followed by a small-bodied candle(the star)
3️⃣ Then a strong bearish(red) candle that covers a significant part of the first candle
Factors that strengthen the signal:
▪️ Gaps between the first candle and the star, as well as between the star and the third candle
▪️ The third candle covers a significant portion of the first candle’s body
▪️ Low volume on the first candle and high volume on the third candle
🌟 Shooting Star is a two-candle pattern that warns of a potential end of an uptrend, but it’s not considered one of the strongest reversal signals.
1️⃣ The candle has a small body located at the lower part of the range and a long upper wick
2️⃣ Like other star patterns, the color of the body doesn’t matter
3️⃣ Ideally, the body forms a gap relative to the previous candle, but this is not required
Inverted Hammer looks very similar to a Shooting Star. It has a small body at the lower part of the range and a long upper wick.
However, unlike the Shooting Star, the Inverted Hammer appears after a downtrend and signals a potential bullish reversal at the bottom.
1️⃣ You should wait for the next candle to confirm the signal — ideally, it opens above the body of the Inverted Hammer
2️⃣ The larger the gap, the stronger the bullish signal
3️⃣ Another confirmation is a strong green candle closing higher
🌿 Harami is a candlestick pattern where a small candle forms within the body of a previous larger candle.
The word “harami” translates from Japanese as “pregnant” — the large candle is the “mother”, and the small candle is the “baby”.
Key features:
1️⃣ The small candle must be fully inside the body of the previous candle(wick length does not matter)
2️⃣ The smaller the “baby” candle, the stronger the signal
3️⃣ Harami is not a strong reversal signal — it usually indicates a pause in the market and the end of the previous trend
Harami Cross is a variation of this pattern:
Instead of a small-bodied candle, a Doji appears after the large candle.
This makes the pattern a much stronger reversal signal.
👮♀️ Belt Hold is a candlestick pattern represented by a long candle.
In the bullish case, it’s a strong green candle that opens at the low of the previous candle and then moves upward.
For the bearish version, everything works in reverse.
The longer the Belt Hold candle, the stronger its impact on the market.
Key points:
1️⃣ If the next candle closes above a bearish Belt Hold, it increases the probability of a continuation of the uptrend
2️⃣ If the next candle closes below a bullish Belt Hold, it signals that selling pressure is increasing again
_ _ _ _ _
👉 If you want to trade like a professional and not like a gambler — follow for real insights and strategies 🚀
🤟 Enjoyed this post and want more like it?
✔️ Then join my Telegram
👉 t.me/+1v6UHltC22xlMDdi
_ _ _ _ _
💰 I trade on the BingX 👉 bingx.com/partner/cassiustrade
🎁 Welcome bonus up to $10,800 + trading fee discounts
✔️ Then join my Telegram
👉 t.me/+1v6UHltC22xlMDdi
_ _ _ _ _
💰 I trade on the BingX 👉 bingx.com/partner/cassiustrade
🎁 Welcome bonus up to $10,800 + trading fee discounts
Disclaimer
The information and publications are not meant to be, and do not constitute, financial, investment, trading, or other types of advice or recommendations supplied or endorsed by TradingView. Read more in the Terms of Use.