You're Not Reading the Chart. You're Defending It.
Technical Analysis Doesn't Work. And Here's Why That's Your Mistake
The chart told you everything. You just didn't want to hear it.
That's not a market problem. That's a you problem - and it has a name.
Confirmation bias. Most people reading this are committing it right now. The ones who just thought "not me" - those are exactly the ones I mean.
You open the chart already knowing you want to buy. From that moment, your brain operates as a lawyer, not a judge. Bullish divergence on RSI? Noticed. Potential double bottom? Noticed. Bearish engulfing on the daily? Missed. Volume declining into the rally? Didn't see it.
This is the architecture of the mind. It is not a flaw you can fix with discipline alone. You cannot fix it until you start your analysis from the opposite end of the chart entirely.
━━━━━━━━━━━━━━━━━━━━━━━━━━━━━
Three moments in Bitcoin's history where the crowd saw one thing and the market did another
November 2021. BTC breaks $69,000. Everyone sees a flag on the weekly, targets $100,000. I was looking at the same chart and seeing Wyckoff distribution - the same signals, interpreted through a different lens. The majority didn't want to see it. Bitcoin spent the next 12 months collapsing to $15,500.
January 2023. BTC recovers to $23,000. "Bear market is over." "New bull cycle." I wrote at the time: this is a bear market rally, not a reversal. Those who saw what they wanted to see bought at $23,000 and sold at a loss a month later.
September 13, 2025. BTC at $95,000–$100,000. I closed all positions and published a post: the bull market is over. (The post is on my TradingView profile - the date is there, the words are there.) Three months later, those who saw only upside had lost 30–40%. This is not a claim. It is a record.
━━━━━━━━━━━━━━━━━━━━━━━━━━━━━
One shift that changes everything
Stop building analysis from a thesis. Build it from falsification.
Before entering any trade, ask yourself one question: what would have to happen on this chart for me to admit I was wrong?
Most traders cannot answer this. They enter without knowing when they're wrong. That's not analysis - it's gambling with a professional aesthetic.
Real analysis starts with locating liquidity. Where are the stops? Where does the market need to go to collect liquidity before the real move begins? When you look at a chart through this lens, you stop seeing patterns and start seeing mechanics.
━━━━━━━━━━━━━━━━━━━━━━━━━━━━━
What this looks like on the current chart
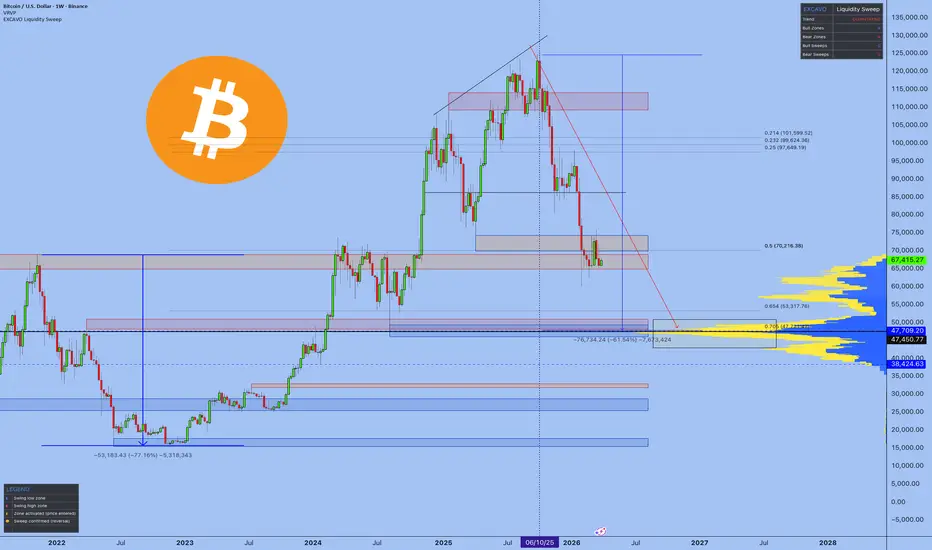
Right now, BTC is trading around $67,000. The majority sees a correction. A temporary pullback - before the continuation. That's the consensus. And the consensus is almost always where the liquidity sits.
On the weekly chart, the picture is different. My Liquidity Sweep indicator (available on my TradingView profile) shows activated bearish zones. Price has left the distribution range ($95,000–$120,000) and is moving structurally lower. The red arrow on the chart is not a scare tactic. It is mechanics.
Where are the stops of everyone "buying the dip"? Clustered directly below current support. The key liquidity zone: $47,000–$50,000. That is where the market needs to go before any credible case for reversal can be made.
Where BTC goes from here - the market will answer. What I'm telling you is this: traders buying the "correction" have already decided. They're not reading the chart anymore. They're reading permission slips.
━━━━━━━━━━━━━━━━━━━━━━━━━━━━━
Anti-bias checklist before entry
Write these down. On paper. Not in your head.
1. What do I see on this chart that argues against my idea? If you can't find one thing - you're not analyzing. You're praying.
2. Where are the stops of traders who think exactly like me - and is there a scenario where the market sweeps those stops before going where I expect?
3. If I were already positioned against this trade, what would I see?
4. What is the specific level - not a range, a level - at which I will say: I was wrong?
If you cannot answer question four, do not open the position. The market does not care about your thesis.
━━━━━━━━━━━━━━━━━━━━━━━━━━━━━
Here is a paradox worth writing down and taping above your monitor:
The most dangerous trader is not the one who ignores technical analysis. The most dangerous trader is the one who has mastered it — and uses that mastery to justify what he already wanted to do.
Knowledge gives you more tools to build a case. It gives you no immunity from building the wrong one. The more you know - the more convincing your mistake sounds.
Technical analysis works. It works very well. Just not in the hands of a trader who uses it to confirm a decision made before the chart was even opened.
Best Regards, EXCAVO
Crypto market
BTC: Another Attempt To Start The Bullish TrendBTC: Another Attempt To Start The Bullish Trend
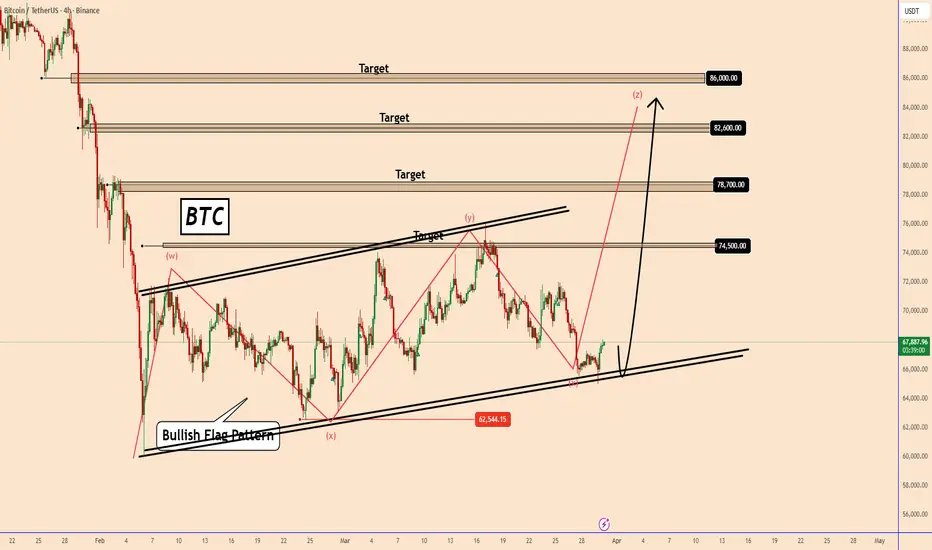
The current setup we have for BTC is one that I have shared before and it only managed to hit the first target and enter a larger structural area.
Currently BTC is transformed more but looks like we can be in a very large WXYXZ movement. BTC is on the Z wave and looks like it can be ready to start soon.
Overall is very risky with the market conditions until the price takes a clear direction.
So, let’s see how BTC will develop again, considering that the market dynamics are very high and everything is changing rapidly.
Key targets:
74500
78700
82600
8600
You may find more details in the chart.
Thank you and good luck! 🍀
The 90 Day Mission That Will Change Your Trading ForeverI know people will attack me for this. But, it's possible if you really want something and you isolate yourself and put all the focus and energy in to it. You can make it. Today I will give you exact plan how I would do it, if I have to start from scratch.
1️⃣ First of all stop believing someone has a magic secret formula to be 100% right on the markets. Strategy that makes you rich in a week and solve all your financial problems? No one has it. It doesn't exist.
You want Lambo? Ok, materialistic goals can be also driver of your inner motivation, but it's not gonna happen in 90 days. Im talking about learning to trade in 90 days. Not getting rich. 2️⃣ Trading Random Patterns – Price Action Overfitting
If you’re trading random patterns and every trade has different logic, then you don’t have an edge. Random trading logic = random results.
‼️ Knowing all these 👇 and fitting them to the chart is not trading edge. Im not saying, these patterns cant work, but you must focus to the one and become a master. Not randomly choosing what fits to the chart today and taking trade on different logic tomorrow.
‼️ If your strategy is trading random patterns you know,
You can’t measure strategy performance. ⏩ What you can’t measure — you can’t improve or backtest. ⏩ And that means you’re don't have statistical data - its core of all problems.
💊 Solution:
Whatever pattern you like - Head and Shoulders, Triangle, Wedge, Channels, Cup and handle. Whatever but pic one, defined step by step process how you will be trading it. And always use mechanical aprocah how you will be trading it. Narrow criteria for every element of a trade to eliminate subjective decisions.
🛡️ You should have :
• Defined your pattern
• Method to define key levels
• Fixed method how to define a trend
• Fixed method how to trade continuation with your pattern
• Fixed method how to trade reversal by using your pattern
Define one trading pattern ( 1 kick ) Practice it 10 000 times become master 👇 For your inspiration, you can check this strategy, its eliminating subjective decisions.
🔗 Click the picture below to learn more. 👇 Approach information I gave above as Bruce Lee : Adapt useful, Reject useless and something specifically your own.
-----------------------------------------------------------------
If you are really committed and not here just for trying but you want it from your heart here it the Plan for the next 90 days for those who has 9 - 5.
1️⃣ Lets Cut Distraction's
❌ 1 . Adjust your phone - Social media and set Do not disturb permanently
Delete the apps or block them during your work window. I know it can feel hard, but harder it feels more you need it. Social media and short term content is distraction loop. During the mission Im cutting it completely and I go to this device. In normal life ( I have 30 minutes planned window) Social media are not bad if you visit them with intention. Just for curiosity put phone usage timer on your main desktop you will see how much time you waste daily if its more then 90 minutes, you got it. Thats whats holding you back.
❌ 2. Reduce Social Activity
When I am in Monk mode, I say no to most social stuff for a short period of time. No parties, Bar meetings and Alcohol. Not even meeting for coffee. As Im father then family duties must stay. That is non negotiable. But outside of that, I shrink my interactions down to almost zero unless the meeting clearly helps my Monk mode goal. Example
❌If I am focused on passing a prop challenge or backtesting some element I want to add to my strategy and someone invites me to a weekend full of drinking and late nights, it is a hard no.
✅If a trader that also trades same strategy invites me to a serious work session to review data or refine something, I will go. That supports the mission.
❌ 3. Cut porn and junk dopamine completely.
This is the uncomfortable part almost nobody wants to talk about, but it matters.If you are constantly stimulating yourself with porn and random adult content, your brain is fried with dopamine. Your focus span goes to zero. Your discipline collapses.
• No porn
• No “thirst trap” scrolling
• No mindless sexual content
• No dating apps
This should not be only for a monk mode. Porn is cancer for your focus cut it out from your life completely. After a few days without this junk, your energy levels change. You wake up more driven. You sit at the charts and you actually want to work. You start feeling like a hunter again, not a zombie.
❌ 4) Cancel Netflix and stop Watching news
Netflix is waste of time. Same is for the news. It doesn't matter knowing what orange mans says or how some sport results ended. You need to focus on your project
2️⃣ Once you ready to cut all above - Lets make a plan now
📅 Plan for people those who has 9 - 5 job
First start with your calendar and plan everything 90 days in advance when and where you will be doing your activities that will take you further in the trading. Now lets go here is activities
✅ 1. One Project — Your Core Mission 🎯
This is your main quest, for next 90 days it is powerful, because it removes decision fatigue it could be:
• Watching the educational Videos and making notes
• Backtesting 300+ trades of one model
• Building your strategy framework properly
• Creating your full trading plan
• Fixing your routine and sticking to it
Rules:
• Defined Activities - Mission
• Work on it daily
• Don’t switch
• Clear finish line ✅ 2. One book 📖
School didn’t prepare you for trading. You have to learn the parts nobody teaches:
• Mindset
• Psychology
• Discipline
• Focus
• Execution
• Stoicism
• Peak performance
30 minutes a day is enough.
Books give you depth. Unlike social media gives you shallow noise of social feeds. I suggest you Atomic Habits - from James clear if never read it. Also FLOW from Mihaly Csikszentmihalyi
✅ 3.One meditation - to reset your mind 🧘♂️
Meditation is like a gym without weights. I keep it simple. Twenty minutes every day, but you can start with 10 minutes if you didn't meditate ever. You can find some guided meditations on YouTube. But, dont let yourself catch in to a trap by scrolling and finding meditation. Prepare one in advance and put It to the playlist or just:
• Sit down
• Close your eyes
• Focus on your breath
• Let thoughts pass without judging or chasing them
Meditation help you regain control over your attention
✅ 4..One workout 💪
You can do either gym or calisthenic training. But not hard cardio, rather resistance training that builds strength. Instead of cardio you got walks. When Im in the monk mode I do Powerlifters training. Its simple, it increases your strength and I do not have to think about training complexity to much. I just come to the gym and finish my session in 45 minutes.
Measure you max weights and add 10%. Then start with 60% of the weight and add 5% every week. You can do more complex weight progression after 4 weeks but that would be for whole article. Search for Stefan Corte Powerlifting training. But dont overthink it. In Monk mode you want stupid repetitive routine.
Squats 6 x 6 - 60% - 65% - 70% - 75%
Bench 6 x 6 - 60% - 65% - 70% - 75%
Deadlift 6 x 6 - 60% - 65% - 70% - 75%
👉 Train hard 3 times a week - Mo / We / FR .. take a break on the weekends.
👉 Other 3 days focus on mobility training and stretching
👉 Take a break one day
Don't forget for 10 minutes warm
Do proper stretching after the training session.
✅ 5. Long walks (No phone , No music) 🚶♂️🌲
Long walks for clarity and aha moments. I go out for around 60 minutes, ideally in nature, with no phone and no music. Just walking, being present and thinking on my project
TIP - if you go for walk on the mornings and fasted, you body will take energy from fats.
As you are in the mode when focusing on project. Ideas begin to connect. You ll start seeing patterns, solutions, better rules. Many parts of my strategies, my routines, even my lifestyle changes were born on these walks.
✅ 6. Eat like an athlete, not a garbage bin 🥦
Food is another big lever. On your mission work in a light, fasted state during the main focus hours. I have my first real meal after I finish my most important work for the day. Before that I of course drink water, but nothing that spikes blood sugar. Because when you are full, heavy and bloated, your brain slows down. That is the last thing you want when you need to do deep work.
Keep it simple
1. Protein
2. Good carbs
3. Healthy fats
4. Minimal junk
Obviously in normal life I sometimes eat in Mc Donald or have Popcorn when taking daughter to the cinema. But No pizza and chips, No such a things in Monk mode. You are trying to become sharp, not sleepy.
🎯 Thats all easy said but how to do it.
You will most likely fail in the discipline, but it doesnt mean you cant start again over and over. Adjust your schedule, when you remove Netflix, Social media and contacts you gain new time, but you will have to put it somewhere in a day. I highly suggest to make it on the morning because after work you will be tired and your focus will not be so sharp.
You can do it , I believe in you. It's not possible to be on a Mission for whole year but you can disappear for some time and level up few times in a year. Im still doing it time to time when Im working on myself in trading, fitness or something in personal development.
David Perk
🟣 I promised myself I’d become the person I once needed the most as a beginner. Below are links to a lessons I shared on Tradingview. Hope it can help you avoid years of mistakes, trial and errors I went thru.
📊 Sharpen your trading Strategy
⚙️ 100% Mechanical System - Complete Strategy
🔁 Daily Bias – Continuation
🔄 Daily Bias – Reversal
🧱 Key Level – Order Block
📉 How to Buy Lows and Sell Highs
1️⃣ CLS Model 1 Explanation
2️⃣ CLS Model 2 Explanation
⚡ Order Block Master
🔮 FVG Mastery
💯 Institutional Levels
⏰ 9:30 Strategy
🎯 Dealing Range – Enter on pullbacks
💧 Liquidity – Basics to understand
🕒 Timeframe Alignments
🚫 Market Narratives – Avoid traps
🐢 Turtle Soup Master – High reward method
🧘 How to stop overcomplicating trading
🕰️ Day Trading Cheat Code – Sessions
🇬🇧 London Session Trading
🔍 SMT Divergence – Secret Smart Money signal
📐 Standard Deviations – Predict future targets
🎣 Stop Hunt Trading
💧 Liquidity Sweep Mastery
🔪 Asia Session Setups
📀 Gold Strategy
🧠 Level Up & Mindset
🛕 Monk Mode – Transition from 9–5 to full-time trading
⚠️ Trading Enemies – Habits that destroy success
🔄 Trader’s Routine – Build discipline daily
💪 Get Funded - $20 000 Monthly Plan
🧪 Winning Trading Plan
⭕ Backtesting vs Reality
❌ Don't Fear Being Wrong
✅ Advice For Beginners
🛡️ Risk Management
🏦 Risk Management for Prop Trading
📏 Risk in % or Fixed Position Size
🔐 Risk Per Trade – Keep consistency
🧪 Risk Reward vs Win Ratio
💎 Catch High Risk Reward Setups
☯️ Smart Money - Who control Markets
🔱 Risk Reward vs Win rate
⚠️ CLS Risk Management
💊 Survive Loosing Streak

BTCUSDTHello Traders! 👋
What are your thoughts on Bitcoin?
Bitcoin has formed a clear descending channel after consistently printing lower highs and lower lows. However, over the past two months, price has been consolidating within a trading range, moving sideways without a clear directional trend. Currently, price is positioned around the mid-range, and as long as this range remains intact, a sharp impulsive move is unlikely.
Bearish Scenario (Primary View):
Based on the current market structure, as long as price remains:
• Inside the descending channel
• Below the key resistance / supply zone
The overall bias remains bearish.
In this scenario:
• A breakdown below the range support
• Would confirm continuation of the downtrend
• Opening the path toward lower levels (channel lows and beyond)
Bullish Scenario (Alternative):
If price manages to:
• Break above the descending channel
• And reclaim the resistance zone with strong confirmation
Then the bearish outlook would be invalidated, suggesting a potential trend reversal or a deeper bullish correction.
Although the market is currently in a consolidation phase, the broader structure remains bearish. Therefore, until key breakout levels are taken, downside continuation remains the higher-probability scenario.
Please don’t forget to like and share your thoughts in the comments! ❤️

BTCUSDT Short: Weak Demand Signals Liquidity Sweep to 66KHello traders! Here’s my technical outlook based on the current BTCUSDT (4H) chart structure. BTC previously traded inside a range, after formed a rising trend line. The market faced rejection from a pivot high under a descending supply line, BTC broke below the trend line and the 68,400 supply zone.
Currently, price is trading below resistance and approaching the 66,000 demand zone, where a short-term reaction may occur. The structure now shows lower highs forming, indicating weakening bullish momentum.
As long as BTCUSDT remains below the 68,400 resistance and respects the descending supply line, the bearish bias stays valid. A continuation lower could push price toward the 66,000 support (TP1) as the next downside target. Manage your risk!

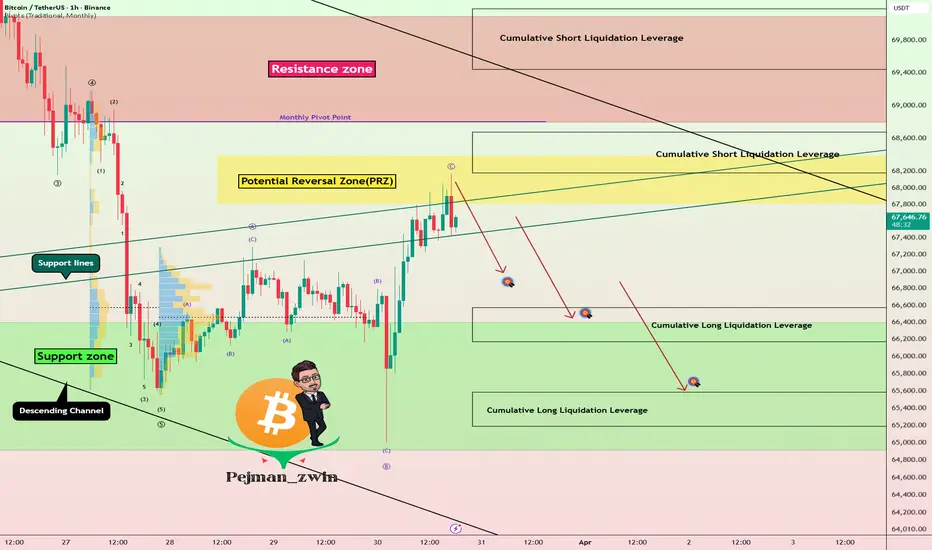
Bitcoin Reached the PRZ | Now the Reaction Matters MostAs I expected in the previous idea , Bitcoin ( BINANCE:BTCUSDT ) started rising from the support zone($66,400-$64,900) and reached all of its targets (full target).
Currently, Bitcoin is moving near the potential reversal zone (PRZ) and the Cumulative Short Liquidation Leverage ($68,670-$68,180). This recent move can be seen as a pullback to the broken support lines.
From an Elliott Wave theory perspective, it seems that Bitcoin is completing a corrective Expanding Flat(ABC/3-3-5), finishing its wave C.
I expect that, in the coming hours, Bitcoin will once again start declining and drop at least to $66,833.
First Target: $66,833
Second Target: Cumulative Long Liquidation Leverage($66,570-$66,170)
Third Target: Cumulative Long Liquidation Leverage($65,580-$65,190)
Stop Loss(SL): $68,890
Points may shift as the market evolves
Cumulative Short Liquidation Leverage: $70,190-$79,440
CME Gap: $84,560-$79,660
Note: The speech from Powell or any other important economic figure can influence the market trend if they discuss interest rates or significant economic topics.
Note: Any news or escalation of the Middle East conflict can cause a sudden shift in Bitcoin’s trend, so, once again, manage your capital carefully in your trades.
What do you think about Bitcoin—can it rise above $69,000, or will we see another decline again?
💡 Please respect each other's opinions and express agreement or disagreement politely.
📌Bitcoin Analysis (BTCUSDT), 1-hour time frame.
🛑 Always set a Stop Loss(SL) for every position you open.
✅ This is just my idea; I’d love to see your thoughts too!
🔥 If you find it helpful, please BOOST this post and share it with your friends.
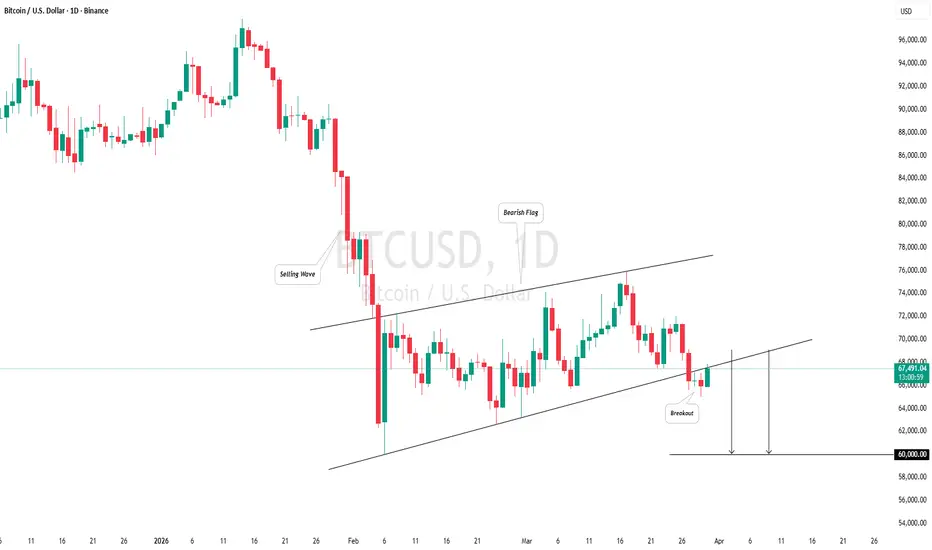
BITCOIN (BTC/USD): Classic Trend-Following PatternI see a significant bearish pattern on 📉BITCOIN a daily timeframe.
The price formed a bearish flag.
Trading in a bearish trend, the violation of a support of the flag is a strong
trend-following signal.
Consequently, we might anticipate a downward movement towards the 60,000 level.
Ethereum formed a fake bearish H&S, creating a bear trapBased on the bullish CH on the chart and the formation of higher lows, the structure is bullish on the hourly timeframes.
The market maker has created a wide ranging zone to hunt liquidity. With each drop, it gives traders the impression that sellers have stepped in, but the structure remains bullish on the hourly.
A bearish head and shoulders pattern is also visible (marked in light purple), but in our view, such patterns are ineffective in a bullish structure and mainly serve as liquidity traps.
There is also a small liquidity pool above, where retail traders place their stops behind the wicks, leading to liquidity buildup.
We have marked the zone where strong, real sell orders are located.
As long as the demand zone holds, price can move toward the targets and the marked area.
With all that said, don’t forget risk management it's more important than correctly predicting market direction.
If you would like us to analyze a coin or altcoin for you, first like this post, then comment the name of your altcoin below.
What is your opinion about Ethereum?

Bitcoin showing strong market structureBitcoin is currently showing strong market structure after holding key support zones and maintaining higher price levels. The recent price action suggests that BTC is not weak — instead, it is building momentum for a potential bullish continuation.
Bitcoin correction phase, Bitcoin is consolidating in a tight range, which usually indicates accumulation by smart money. This type of price behaviour often comes before a strong breakout move.
Tecnically Bitcoin has respected major support zones showing that buyers are active and defending the market. This confirms demand is still strong Higher Highs & Higher Lows market structure is bullish on higher timeframes. BTC continues to form higher lows, which is a key sign of an uptrend Liquidity Build-Up Price is ranging below resistance creating liquidity above. markets often move toward liquidity meaning a breakout to the upside is likely.
You may find more details in the chart,
Trade wisely best of luck buddies.
Ps; Support with like and comments for better analysis Thanks for Supporting.

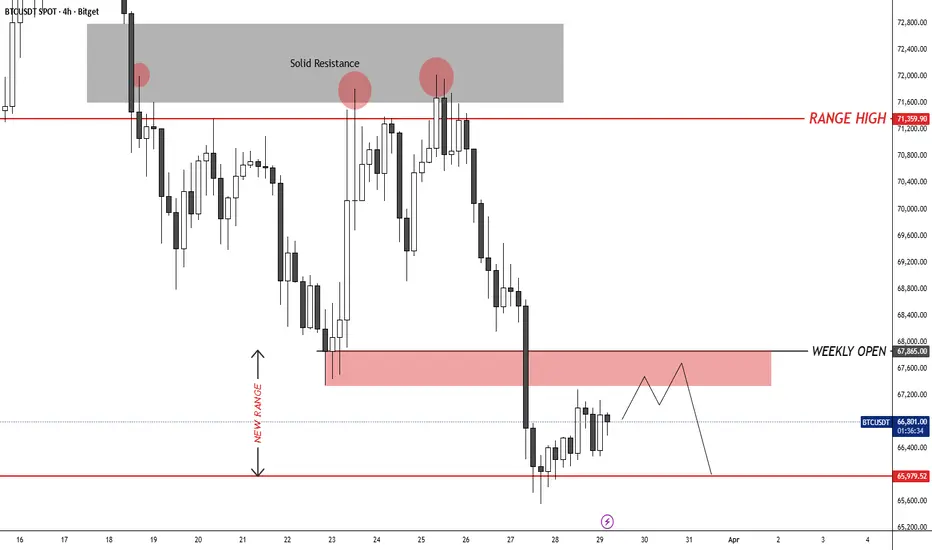
BTCUSDT – 4H Outlook: New Consolidation RangeHello traders,
Bitcoin is showing signs of structural weakness after failing to hold the Weekly Open. This rejection suggests the market is entering a "New Range" phase, with the potential for a deeper correction if bulls can't reclaim key pivots
💡Trade Sentiment
The close below the Weekly Open is a bearish signal in the short term. We are likely looking at two main scenarios:
Range Bound: Price chops between $66k and $67.8k to build liquidity.
A Rejection: A weak move into the $67.3k area followed by a sharp rejection, confirming a move toward the $63k-$64k
🔑 Key Levels to Watch
Resistance: $67,300 - $67,865 - $71,359 – $72,000
Support: $65,979 - $64,000 – $63,000
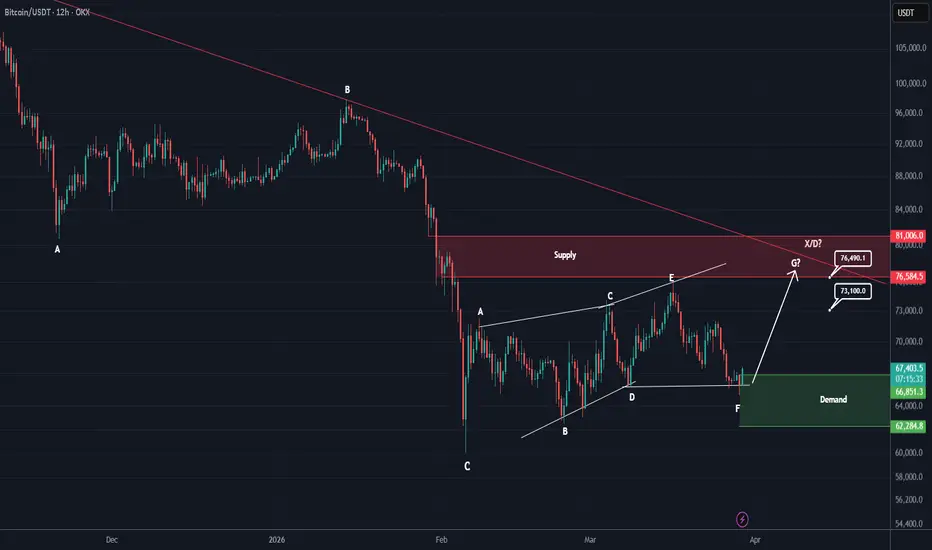
Bitcoin may spike and liquidate $13B in short positionsThis analysis is an update to the one you can see in the Related Releases section:
First of all, you should know that, based on data shared by crypto statistics sites over the past few days, there is about $13 billion in short positions and only $3 billion in long positions! This liquidity makes hunting and capturing positions attractive for market makers.
It appears we have a diametric pattern, where wave F has extended, causing the price to drop further.
Now, by holding the green zone, Bitcoin could gradually conclude wave F and enter wave G, which is a bullish wave.
The red zone, where the main orders are located, has not been reached yet, so we do not have a strong and reliable drop. Currently, if Bitcoin can hold the green zone, it could move toward the targets marked on the chart, especially considering that Tether dominance is at a resistance level and the structure of altcoins is strong and bullish on hourly timeframes.
Bitcoin has been volatile due to market sentiment, the conflict in the Middle East, and other factors, making trading in these areas challenging. This means proper risk and capital management is essential.
If you have a coin or altcoin you want analyzed, first hit the like button and then comment its name so I can review it for you.
Do you also think BITCOIN is bullish?
Bitcoin (BTC) | Expecting Rejection From Current Retest Zone2 ways we can look at this chart here: some might say that we had recently an MSB on lower zones and this is a trend reversal, whereas others might say that we are retesting the previous break of structure zone.
Now both ways of thinking are correct, and that's why the current test zone is important for us.
If all goes as we plan and we see the rejection, we could catch a good short position from here, where if buyers manage to break out from here, then we might be looking for upside momentum.
As of now, we are expecting the rejection so that's what we are going to look and wait for, a proper MSB on smaller timeframes so no rush here!
Swallow Academy

BTCUSDT: Weak Structure Signals Move Toward 65.5KHello everyone, here is my breakdown of the current BTCUSDT setup.
Market Analysis
BTC is trading inside a triangle, with descending resistance and rising support. Price failed to hold above the 67,400 supply, confirming strong resistance.
Currently, price is trading below resistance and approaching the 65,500 support zone, with repeated tests suggesting weakening buyer strength.
My Scenario & Strategy
As long as BTCUSDT remains below the 67,400 resistance and respects the descending structure, the bearish bias stays valid. A rejection from this area could push price toward the 65,500 support (TP1) as the next downside target.
However, if price manages to break and hold above 67,400, the bearish scenario would weaken and the market could shift into consolidation or a short-term recovery.
That’s the setup I’m tracking. Thank you for your attention, and always manage your risk.

XRP — Key Confluence Zone ApproachingXRP has been overall bearish, trading within the falling red channel.
Price is currently approaching a very strong confluence zone.
Where are we now?
XRP is retesting the intersection of:
• Lower bound of the falling channel 🔻
• Major support zone in blue 🔵
• Psychological round number at $1
This creates a high-probability reaction area.
What’s the plan?
As long as this zone holds,
we will be looking for long-term longs 📈
A clean bullish reaction from this area could trigger a move back toward:
• The upper bound of the channel
• The red resistance zone above
When does this fail?
If XRP breaks below this confluence zone decisively,
then the bullish scenario is invalidated ❌
And further downside becomes likely.
⚠️ Disclaimer: This is not financial advice. Always do your own research and manage risk properly.
📚 Stick to your trading plan regarding entries, risk, and management.
Good luck! 🍀
All Strategies Are Good; If Managed Properly!
~Richard Nasr

BTC – $62K Breaking Point: Next Stop $50K?BTC remains under pressure within a broader bearish structure, struggling to regain strength after multiple rejections.
The key level to watch now is the $62,000 low.
If BTC breaks below this level, it would likely trigger another bearish impulse, opening the path toward the $50K region as the next major target.
Until then, this level remains the line between temporary support… and acceleration lower.
⚠️ Disclaimer: This is not financial advice. Always do your own research and manage risk properly.
📚 Stick to your trading plan regarding entries, risk, and management.
Good luck! 🍀
All Strategies Are Good; If Managed Properly!
~Richard Nasr

BTCUSDT 4H – Weak Follow-Through After MA CrossOn the 4H chart, BTC showed a short-term bullish signal as the 5MA crossed above the 20MA.
However, the move failed to follow through.
Price quickly lost momentum and printed a bearish candle back below the 5MA, indicating that the strength was not sustained.
⸻
Structure Analysis
At the moment, the market is showing mixed signals:
• Short-term bullish crossover (5MA > 20MA)
• Immediate rejection and loss of 5MA
• No clear continuation or confirmation
This kind of price action often reflects indecision rather than direction.
⸻
What This Means
A single MA crossover is not enough.
Without follow-through and structure confirmation, these moves can easily turn into traps.
Right now, the market is not clean.
• No strong bullish structure
• No confirmed bearish continuation
• Just noise between moving averages
⸻
My Approach
I don’t trade based on a single signal.
I wait for alignment.
• Clean MA structure
• Clear direction
• Strong follow-through
Until then:
No structure = no trade
⸻
Key Levels / Scenarios
• Reclaim and hold above the 5MA → potential continuation
• Continued rejection below MAs → bearish pressure remains
• Sideways movement → stay patient
⸻
Conclusion
This is a classic example of why patience matters.
Not every crossover leads to a trend.
The best trades come from clear structure, not early signals.

XRPUSDT - Ready for a decline. Focus on 1.27–1.14BINANCE:XRPUSDT is preparing to transition from a consolidation phase to a distribution phase. The altcoin appears weaker than the broader market...
Bitcoin confirms the bearish market structure; against this backdrop, XRP looks much weaker than the flagship.
XRP maintains a local bearish trend that aligns with the global one. The altcoin is forming a trading range of 1.3612–1.3152 and is testing the support level. If XRP breaks below 1.3152, the decline could continue to 1.269, and then to 1.1400
Resistance levels: 1.335, 1.3612
Support levels: 1.3152, 1.269, 1.1400
The cryptocurrency market is still in the crypto winter phase, but XRP stands out from the rest of the list due to its weakness, suggesting that the altcoin may continue to fall before the others. Trigger 1 - 1.335 (short squeeze), Trigger 2 - 1.3152 (close below the level)
Best regards, R. Linda!

Arbitrum (ARB) | Resistance Into Reversal – Short Setup FormingLooks like a sweet spot for a short here; sellers managed to turn this resistance zone into a successful reversal area where we will need to see similar MSB (on smaller timeframes like 30M) like we had on the 26th of March.
So the game plan is simple: look for proper market structure break here and as soon as we get one, we are looking for an ideal entry for a short position with good RR ratio.
Swallow Academy

BTC Breakout & Retest — Continuation Incoming?“ CRYPTOCAP:BTC breaking out cleanly from a key resistance zone and now reacting around the retest area 👀
Trendline support is holding for now, keeping the structure bullish. If price maintains this zone, continuation towards higher levels becomes possible
However, this is a key area to watch — any weakness here could shift momentum.
What do you think — continuation or fakeout?
Stay disciplined, manage risk, and follow your own plan.
This idea is for educational purposes only.”

Bullish Bounce Into High-Volume Supply Area in BTCUSDPrice has formed a clear bearish leg followed by a structured recovery, indicating a short-term shift in momentum after an impulsive sell-off. The current upward move appears corrective, as it is approaching a previously active high-volume zone (“Volume Bursts”), where strong participation and potential supply were present earlier.
Such zones often act as reaction areas, as they represent points where the market previously moved aggressively — leaving behind unfilled orders or institutional interest. The ongoing bullish move is now entering this region, suggesting that price is moving into an area where selling pressure may re-emerge. The structure still reflects a broader corrective environment rather than a confirmed bullish reversal.
Speculative Outlook
If price shows rejection within the volume burst zone — through slowing momentum, wicks, or bearish confirmations — it could lead to a continuation of the broader downside movement, potentially retesting lower liquidity areas.
However, if buyers manage to break through and sustain above this high-volume resistance, it would indicate strength and could shift the market into a deeper bullish retracement or short-term reversal phase.
The key focus remains on how price behaves inside this zone — rejection favors continuation, while acceptance opens the path for upside expansion.

btc going down imminent see for yourself last chance for entries. same pattern playing out dont be a fool

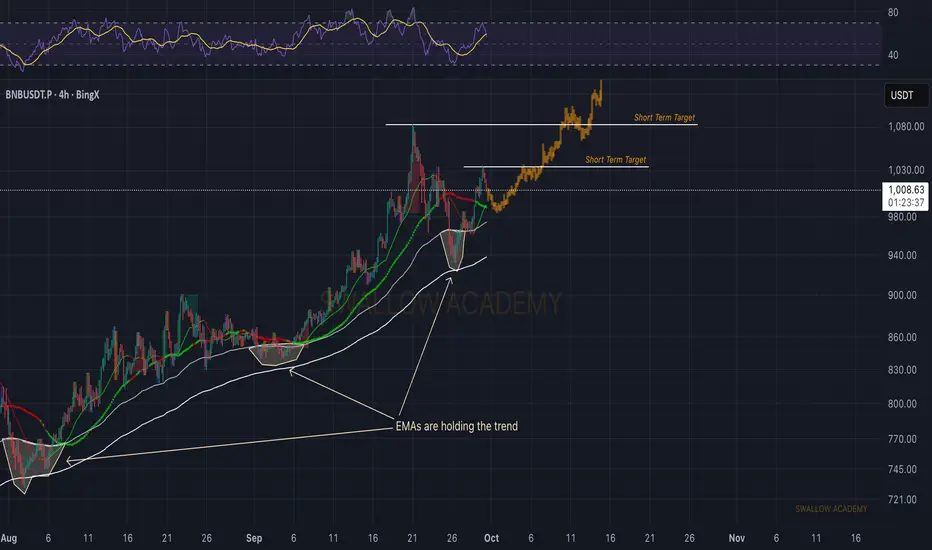
Binance Coin (BNB): Respecting the EMAs | Bullish AFBNB continues to respect the EMAs, with each dip finding strong support and buyers stepping in to hold the trend.
The bounce from the latest retest shows momentum is still in buyers’ favor, and as long as this structure is protected, short-term targets are around $1,030 and $1,080 (as long as buyers maintain the EMAs).
Swallow Academy
XRP AND 777 FOLLOWERS 🥳 Here's a toast to 777 Followers or friends as I like to say. I feel so honored and blessed to be here looking back now on how far we've come.
🥳 It feels like a dream if I'm being quite frank. Never would have imagined I'd hit so many followers, not to mention 777 and that number just seems to keep climbing by the day.
🥳 I owe much of this success to Trading view for giving me the space to share my thoughts and ideas while being able to share them with a community of likeminded traders and the support from so many of you has kept me pushing and motivated.
🥳 Much like a Rock I've persisted through many storms and it truly does feel like a blessing to be here before all of you and make this post. I know this is an idea I'll look back on with pride and a sense of contentment knowing I've made it this far and my band of Rocks has grown to 777 and more by the day.
🥳 Love keeping up with the charts and XRP as always, trusting in the future and focused on the long run, if I had quit at the first few followers and slow growth I never would have made it this far. Goes to show that sometimes, focusing on the long term really does make a difference.
🥳 Technically I'm watching $1.32 for some support though it's pretty clear much of this bearish movement the last few days has been thanks to losing that 200 EMA and our 20, 50 EMA's converging prompting the domino effect as sales and stop loss orders hit the market, it's the market that's been dragging XRP down mainly, so just watching those supports and keeping an open mind.
🥳 We're in a period of unrest and many geopolitical tensions, understandably markets are shaken and confidence is low. But that's where I'll strike the mark again on the long term. We're not here to focus on tomorrow, or the next day, we're focused on the long term and what the real value and utility of XRP may be off of it's real use case. We already know most of the market is strongly correlated so best thing right now is to keep in mind what will split from that and has the best chances, odds.
🥳 One way or another, XRP will prove it's value and I trust in the process. It's been this many years and I'm not giving up anytime soon, things work out and things happen for a reason. This is only the beginning and there is much more to come for us.
🥳 Thanks for joining me on today's celebratory idea, had to celebrate 777 followers and counting. Here's to many more ideas and the bright future we seek and will manifest. 🥂
Best regards,
~ Rock ' 🥂
