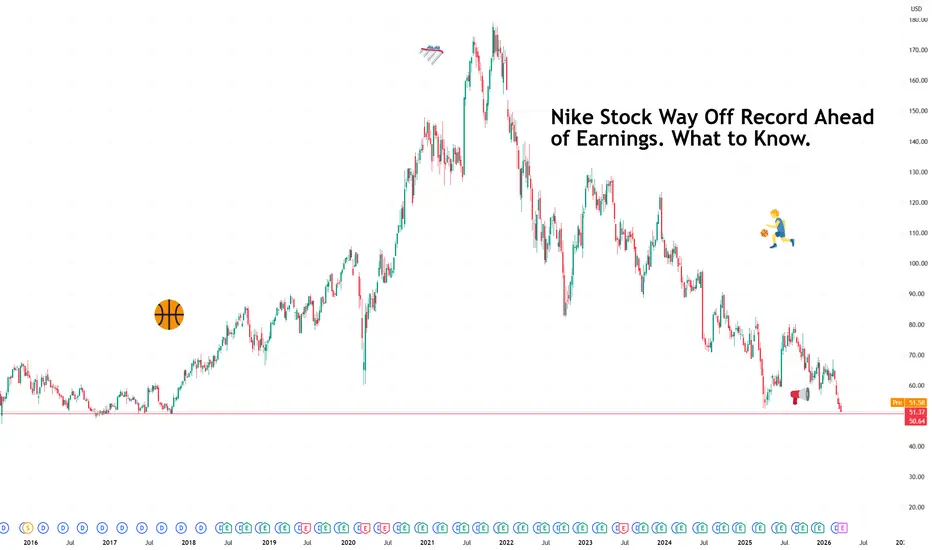
Nike Stock Way Off Record Ahead of Earnings. What to Know.There is a particular kind of corporate humbling that comes not from collapse but from irrelevance creeping in at the edges.
Nike NYSE:NKE is still the world's largest sportswear brand, still moving tens of billions in revenue, still on the feet of more athletes than any other company on earth.
And yet at around $50 a share, nine-year lows, off 70% from its 2021 peak, the stock is asking a question the company has to answer on Tuesday: So how’s that reset going? (insert "well we’re waiting.gif")
The earnings calendar rolls on with Nike’s earnings day next .
📉 How Did We Get Here?
Nike's November 2021 high of $178 looks almost fictional from today's vantage point. The shares are lower by more than 20% this year alone and have spent the past several months hovering near levels last seen when athleisure was still a novelty.
The company is in the middle of what it calls a business reset , refocusing on wholesale partnerships after a years-long push toward selling direct to consumers that did not deliver the margins management had anticipated.
Wholesale means selling through retailers like Foot Locker rather than exclusively through Nike's own stores and app. The retreat is sensible but the execution has been choppy, and the market has been keeping score.
🌍 Three Problems, One Earnings Call
Investors heading into Tuesday's report are watching three specific pressure points.
Europe is slowing. Consumer confidence across the continent has softened, and discretionary spending, the kind that goes on premium trainers, tends to be the first casualty when household budgets tighten.
The US wholesale business, the very channel Nike is trying to reinvigorate, remains unhealthy. Rebuilding retailer relationships after deprioritizing them takes time, and the inventory and shelf-space dynamics are still normalizing. All the while profits are slumping .
Outside the tariff woes from a year ago , China continues to disappoint. The post-pandemic recovery that Nike and many other consumer brands were counting on has been more stubborn than anticipated, with local competitors gaining ground and consumer sentiment remaining soft.
The market is expecting revenue of roughly $11.1 billion for the quarter, flat year on year, an improvement on the 9.3% decline recorded in the same period last year.
Earnings per share, meaning profit divided across all outstanding shares, is expected to land at 29 cents. Last quarter Nike beat on both revenue and earnings, so the bar exists, even if it is not set particularly high.
👟 The Cool Factor Problem
Beyond the financials, Nike has a cultural challenge that balance sheets struggle to capture. The brand that defined athletic aspiration for four decades is working harder than usual to stay relevant.
Its answer, at least partly, is a sneaker called Mind, a shoe focused on mindfulness. Whether a mindfulness sneaker moves the needle on coolness is a question the market will eventually answer, but it is the kind of product that signals a company actively searching for its next identity.
🆕 New Balance Is Having a Moment
While Nike searches, New Balance is sprinting. The 120-year-old brand, once synonymous with sensible footwear for people who prioritize comfort over style, grew sales 19% last year and 180% since 2020.
It has raised average prices by roughly 30% over the past five years, proving consumers will pay a premium for a brand they believe in. It opened 80 new stores last year, aggressively rebuilding physical retail presence at the exact moment Nike was stepping back from it.
New Balance expects to cross $10 billion in sales this year, putting it roughly $2 billion behind Nike's quarterly revenue run rate. That gap is closing, and it is closing fast.
🎯 What to Watch Tuesday
The headline numbers are important, for sure, but the language around China and wholesale recovery will tell the more important story. So grab your two shares and listen for whether management sounds like a team executing a plan or a team revising one.
At $50, Nike is cheap relative to its own history. Cheap and done falling are different things, though.
Off to you : What’s your outlook for Nike? Share your views in the comments!
In-depth trading ideas
Nike Just Hit an 8-1/2-Year Low. Here's What Its Chart SaysNike NYSE:NKE plans to report earnings next week at a time when the shoe-and-apparel giant's stock is trading at about an 8-1/2-year low, having fallen some 70% since its November 2021 all-time high. Let's see what its chart and fundamentals can tell us.
Nike's Fundamental Analysis
NKE is set to release fiscal Q3 results after the closing bell next Tuesday, with the Street looking for $0.29 in GAAP earnings per share on $11.22 billion of revenue.
That would represent a 46.2% drop from the $0.54 in GAAP EPS that Nike reported for the same quarter last year, as well as a 0.4% sales contraction from the year-ago period's $11.27 billion of revenue.
Interestingly, just three of the 23 analysts that I know of who track the stock have revised their estimates since the quarter began -- even though the group's earnings forecasts span from $0.24 to $0.35 in GAAP EPS.
Two analysts have downwardly revised their numbers, while one did an upward revision. The remaining 20 analysts have sat on their hands.
Nike's Technical Analysis
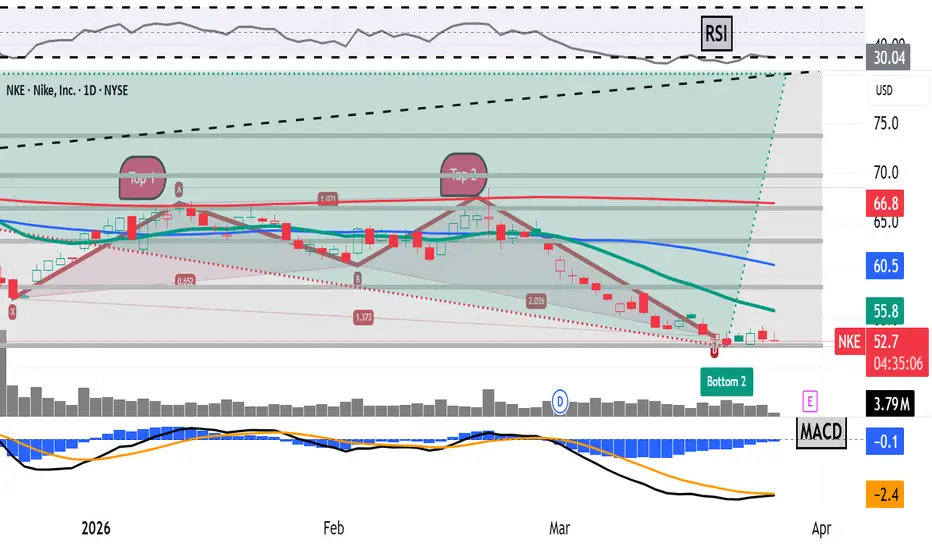
Next, let's look at NKE's chart going back some nine months and running through Tuesday afternoon (March 24):
Readers will see that Nike has produced two double-top patterns of bearish reversal since last summer, as marked with red boxes and pink shading at the above chart's left and right.
Both patterns worked as one might have thought, with Nike stock falling each time.
The second double-top pattern occurred just recently, bearing a $60 apparent pivot. Nike appears to have bottomed out (at least for now) coming out of that second double top, falling to a $52.18 intraday low on March 20. That's the stock's lowest trading level since October 2017.
So, what are the technical indicators telling us now?
First, readers will see that NKE has now completed a 100% Fibonacci retracement of its April 2025-to-August 2025 rally, as shown by the gray horizontal lines and gray shading above.
As that's been happening, the stock's Relative Strength Index (or "RSI," marked with a squiggly gray line at the chart's top) appears to have come out of a technically oversold state.
And while Nike's daily Moving Average Convergence Divergence indicator (or "MACD," denoted by blue bars and black and gold lines at the chart's bottom) is still postured rather bearishly, it's showing a few technical positives.
For one thing, the histogram of Nike's 9-day Exponential Moving Average (or "EMA," marked with blue bars) is approaching zero from below. A move into positive territory would be technically bullish.
On top of that, the stock's 12-day EMA (the black line) is moving upward toward its 26-day EMA (the gold line). A crossover of these two lines would represent a bullish signal as well.
An Options Option
Bullish options traders are likely using Nike's 21-day EMA (the green line above) as a pivot for what's known as a bull-call spread.
That's where you buy one call and sell another with a higher strike price, but where both expire on the same day. Here's an example:
-- Long one NKE call with an April 2 expiration (i.e., after next week's earnings) and a $57 strike price. That cost about $1.20 at recent prices.
-- Short one NKE April 2 call with a $61 strike price. That would currently bring in a roughly $0.40 credit.
Net Debit: $0.80.
Such traders are trying to bring in $4 while risking an $0.80 net debit, for a $3.20 maximum theoretical net profit. They would realize this if NKE trades at or above $61 at expiration.
Conversely, this trade's maximum theoretical loss is the $0.80 net debit. Investors would see that if NKE traded at or below $57 at expiration.
(Moomoo Technologies Inc. Markets Commentator Stephen "Sarge" Guilfoyle had no position in NKE at the time of writing this column.)
This article discusses technical analysis, other approaches, including fundamental analysis, may offer very different views. The examples provided are for illustrative purposes only and are not intended to be reflective of the results you can expect to achieve. Specific security charts used are for illustrative purposes only and are not a recommendation, offer to sell, or a solicitation of an offer to buy any security. Past investment performance does not indicate or guarantee future success. Returns will vary, and all investments carry risks, including loss of principal. This content is also not a research report and is not intended to serve as the basis for any investment decision. The information contained in this article does not purport to be a complete description of the securities, markets, or developments referred to in this material. Moomoo and its affiliates make no representation or warranty as to the article's adequacy, completeness, accuracy or timeliness for any particular purpose of the above content. Furthermore, there is no guarantee that any statements, estimates, price targets, opinions or forecasts provided herein will prove to be correct.
Options trading is risky and not appropriate for everyone. Read the Options Disclosure Document ( j.moomoo.com ) before trading. Options are complex and you may quickly lose the entire investment. Customers should consider their investment objectives and risks carefully before investing in options. Because of the importance of tax considerations to all options transactions, the customer considering options should consult their tax advisor as to how taxes affect the outcome of each options strategy. Supporting documents for any claims will be furnished upon request.
Options trading subject to eligibility requirements. Strategies available will depend on options level approved.
Maximum potential loss and profit for options are calculated based on the single leg or an entire multi-leg trade remaining intact until expiration with no option contracts being exercised or assigned. These figures do not account for a portion of a multi-leg strategy being changed or removed or the trader assuming a short or long position in the underlying stock at or before expiration. Therefore, it is possible to lose more than the theoretical max loss of a strategy.
Moomoo is a financial information and trading app offered by Moomoo Technologies Inc. In the U.S., investment products and services on Moomoo are offered by Moomoo Financial Inc., Member FINRA/SIPC.
TradingView is an independent third party not affiliated with Moomoo Financial Inc., Moomoo Technologies Inc., or its affiliates. Moomoo Financial Inc. and its affiliates do not endorse, represent or warrant the completeness and accuracy of the data and information available on the TradingView platform and are not responsible for any services provided by the third-party platform.
NYSE – S&P 500 | Nike, Inc. | 25 Mar 2026Structure
Structure: Structural Distribution
Context: Ongoing Phase
Position
Trend: Weakening / Bearish Bias
Location: Upper-to-Mid Range
Behaviour: Corrective / Distribution
Structural Insight
Structure assessed from earliest reliable data
Long-term advance transitioning into distribution structure
Currently showing sustained corrective behaviour following peak formation
Reference
Part of the S&P 500 Structural Census.
Disclaimer
This analysis is for educational purposes and reflects structural market observation.
Structure → Level → Trigger → Probability
#SP500Census #MarketStructure #NKE

Is Nike at a Major Bottom?Technical Analysis
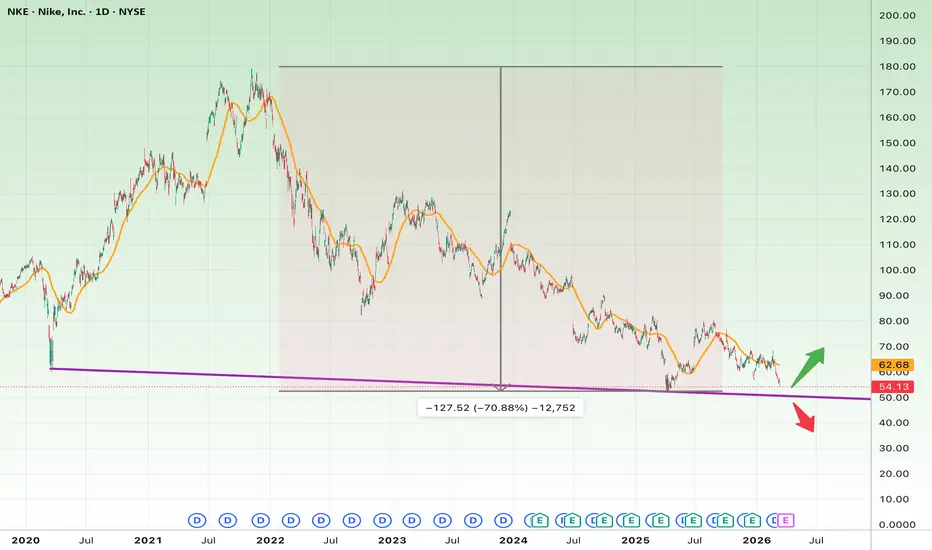
The daily chart of Nike Inc. (NKE) shows that the stock has been in a long-term downtrend after reaching its previous highs.
Overall, the stock has declined by more than 70% from its peak, bringing price into a critical long-term support zone around $50–$55.
This level aligns with a major long-term trendline, making it a very important technical area.
The reaction here could determine the stock’s direction for the coming months.
Bullish Scenario
If buyers manage to defend the $50–$55 support zone, a relief rally could develop.
Potential upside targets:
First target: $65
Second target: $75
Third target: $90
Suggested stop loss:
$48
A break above $75 could shift the structure from bearish to neutral or even bullish.
Bearish Scenario
If price breaks below the $50 support level, the long-term downtrend may continue.
Potential downside targets:
First target: $45
Second target: $38
Third target: $30
Stop loss for short positions:
$60
Fundamental Analysis
Key fundamental factors affecting Nike include:
1. Slowing Revenue Growth
Nike’s revenue growth has slowed in recent years due to changing consumer trends and macroeconomic pressures.
2. Increasing Competition
Companies such as Adidas and Under Armour are intensifying competition in the athletic apparel market.
3. Direct-to-Consumer Strategy
Nike is expanding its direct-to-consumer (DTC) model through its website and mobile apps, which could improve profit margins.
4. Global Brand Strength
Despite recent challenges, Nike remains one of the strongest global sports brands, supported by major athlete partnerships and sponsorship deals.
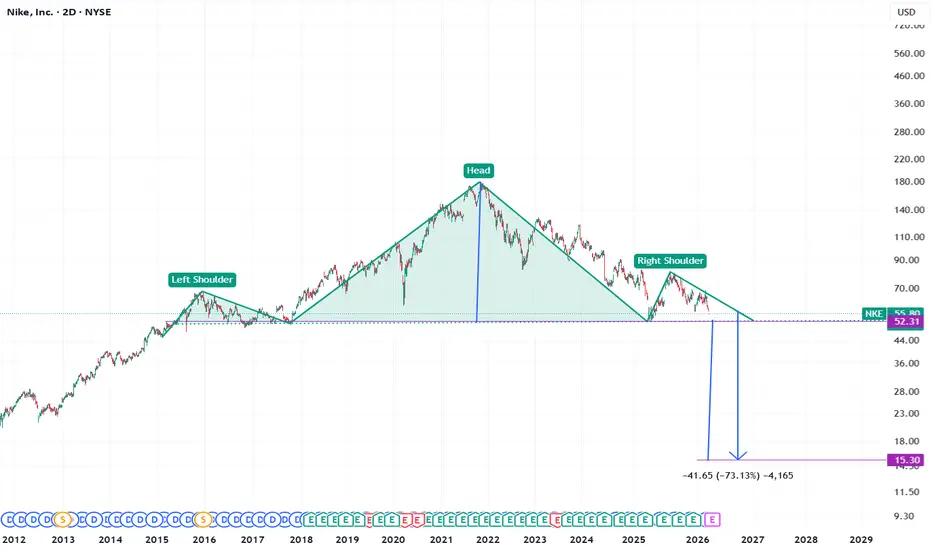
Nike to fall 73% if Head and Shoulders plays outBearish about to drop through the floor,
* **Weak demand in China** – One of Nike’s largest markets is slowing, with lower consumer spending and stronger local competitors hurting sales.
* **Profit margins under pressure** – Higher costs (tariffs, promotions, supply chain) are squeezing margins even when revenue grows.
* **Tariff impact and rising costs** – Nike expects tariffs to cost roughly **$1B**, forcing cost cuts and potential price increases.
* **Restructuring and layoffs** – Around **$300M in restructuring charges** tied to layoffs signals operational challenges in the short term.
* **Slowing direct-to-consumer / digital sales** – Nike’s push into direct sales hasn’t grown as expected, leading to a shift back toward wholesale partners.
* **Longer-term downtrend in the stock** – The share price has been below its 2021 highs for years, so rallies tend to get sold as investors wait for clear turnaround signals.
NKE 52.5P 4/17bearish, earnings play. Looking to take advantage of NIKE internal restructuring and historical March earnings downtrend.
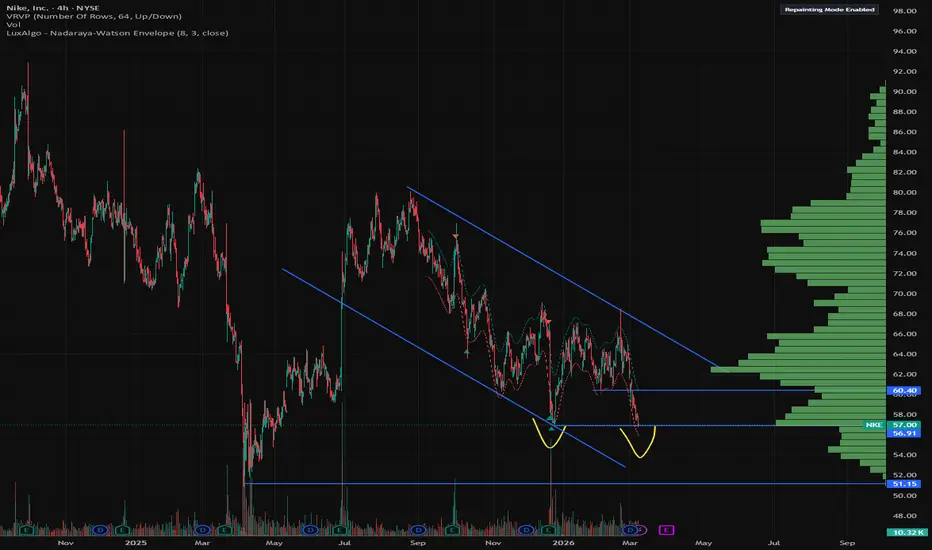
Nike May Be StaggeringNike has been staggering for months, and some traders may see downside risk.
The first pattern on today’s chart is the series of higher lows since late December. The footwear company closed below that line yesterday, which could be interpreted as a bear-flag breakdown.
Second, the series of lower highs since late 2025 (marked with yellow arrows) may reflect a longer-term downtrend.
Third, the 50-day simple moving average (SMA) had a “death cross” below the 200-day SMA in November. That could also reflect long-term weakness.
Fourth, the 8-day exponential moving average (EMA) is below the 21-day EMA. Does that signal short-term bearishness?
Next, some traders may expect prices to revisit their seven-year low at $52.28.
Finally, NKE is an active underlier in the options market. (It averages about 90,000 contracts per session, according to TradeStation data.) That could help traders take positions with calls and puts.
TradeStation has, for decades, advanced the trading industry, providing access to stocks, options and futures. If you're born to trade, we could be for you. See our Overview for more.
Past performance, whether actual or indicated by historical tests of strategies, is no guarantee of future performance or success. There is a possibility that you may sustain a loss equal to or greater than your entire investment regardless of which asset class you trade (equities, options or futures); therefore, you should not invest or risk money that you cannot afford to lose. Online trading is not suitable for all investors. View the document titled Characteristics and Risks of Standardized Options at www.TradeStation.com . Before trading any asset class, customers must read the relevant risk disclosure statements on www.TradeStation.com . System access and trade placement and execution may be delayed or fail due to market volatility and volume, quote delays, system and software errors, Internet traffic, outages and other factors.
Securities and futures trading is offered to self-directed customers by TradeStation Securities, Inc., a broker-dealer registered with the Securities and Exchange Commission and a futures commission merchant licensed with the Commodity Futures Trading Commission). TradeStation Securities is a member of the Financial Industry Regulatory Authority, the National Futures Association, and a number of exchanges.
Options trading is not suitable for all investors. Your TradeStation Securities’ account application to trade options will be considered and approved or disapproved based on all relevant factors, including your trading experience. See www.TradeStation.com . Visit www.TradeStation.com for full details on the costs and fees associated with options.
Margin trading involves risks, and it is important that you fully understand those risks before trading on margin. The Margin Disclosure Statement outlines many of those risks, including that you can lose more funds than you deposit in your margin account; your brokerage firm can force the sale of securities in your account; your brokerage firm can sell your securities without contacting you; and you are not entitled to an extension of time on a margin call. Review the Margin Disclosure Statement at www.TradeStation.com .
TradeStation Securities, Inc. and TradeStation Technologies, Inc. are each wholly owned subsidiaries of TradeStation Group, Inc., both operating, and providing products and services, under the TradeStation brand and trademark. When applying for, or purchasing, accounts, subscriptions, products and services, it is important that you know which company you will be dealing with. Visit www.TradeStation.com for further important information explaining what this means.
SinnSeed | #Nike (#NKE) in 2026 - idea - 26.02.2026🗓 SinnSeed | #Nike (#NKE) in 2026: the tariff window the market hasn’t priced in yet
🕯 As of February 26, 2026, NKE is trading around 64 USD (63.40–65.00), with a market cap of ~94–95 bn USD.
💼 Dividend yield is roughly 2.5% (0.41 USD per share; record date: March 2). At these levels, this is not a story about an “perfect company,” but about skewed expectations and a potentially meaningful re-rating.
📈 Where Nike stands today
Nike is in the middle of a restructuring under CEO Elliott Hill. Management views FY2026 as a transition year: rapid actions to restore sales without permanent discounting, strengthen partner retail channels, refresh the product portfolio, and reduce the share of “aged” inventory. Improvements are starting to show, but the stock price reflects them only partially.
🛒 What looks strong
North America (about 45% of revenue) is recovering noticeably. Partner (wholesale) sales in Q2 grew 8%. Inventory is coming down and the markdown mix looks healthier—an important sign Nike is gradually regaining control over pricing and demand. Product momentum in running, basketball, kids, and Jordan provides additional support.
📉 What continues to weigh
The main weak spot is Greater China: a soft consumer, competition from Anta and Li-Ning, plus consumer nationalism. Nike’s direct digital sales continue to decline (NIKE Digital -14% in Q2). Gross margin in Q2 fell by 300 bps, with a meaningful portion driven by tariffs.
🗺 And importantly: Nike has already baked in about 1.5 bn USD of annual incremental tariff costs in FY2026.
🧮 Regional snapshot (Q2 FY2026, through November 30, 2025)
Total revenue: 12.43 bn USD (+1% YoY reported).
North America: 5.633 bn (+9%).
EMEA (Europe, Middle East & Africa): 3.392 bn (+3% reported).
Greater China: 1.423 bn (-17%).
Asia Pacific & Latin America: 1.667 bn (-4%).
North America and EMEA represent nearly three quarters of the business and remain resilient, while China and other regions continue to drag on the overall picture.
⏱ Core idea for 2026: tariffs may flip from a “headwind” into a “tailwind”
After the US Supreme Court ruled the IEEPA-based tariff framework unlawful, the administration shifted to Section 122 (15%), set to run until July 24, 2026 without Congressional approval. The market reacted emotionally to the headline, but has not fully modeled what may matter more: partial or full removal by the deadline and possible refunds of previously paid duties. Wharton estimates the industry is discussing up to 175 bn USD in potential refunds; for Nike, that could mean the already-modeled 1.5 bn USD cost headwind turns into a one-off cash inflow and a margin boost.
⚖️ The price action supports the underpricing thesis: a short-term pop on the news followed by a pullback—classic “sell the fact,” without a deep scenario repricing.
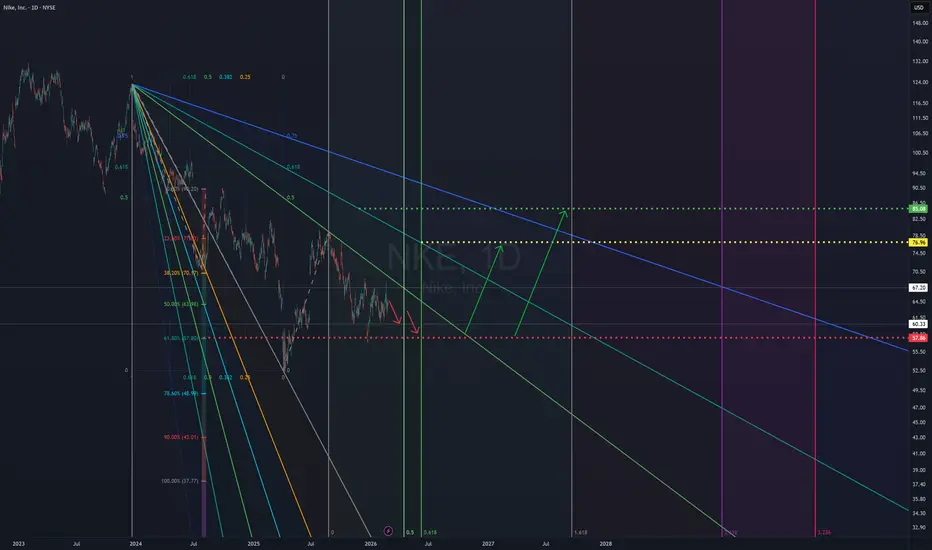
🎯 NKE price scenarios by end-2026 (from ~64 USD)
🛫 Base case: 75–78 USD (+17–22%). Restructuring stays on track; tariff pressure eases partially. Probability ~55%.
🛫 Bull case: 85–92 USD (+33–44%). Section 122 is removed/neutralized by July and duty refunds reach 50–70% of the modeled 1.5 bn USD. Probability ~35%.
🛫 Bear case: 55–60 USD (-6–14%). Shift to harsher tariff mechanisms plus further deterioration in China. Probability ~10%.
✍️ My midpoint target: 82–85 USD by December 2026 (+28–33%).
💵 Why Nike could outperform peers
Because Nike’s tariff factor is among the largest in absolute dollars, import dependence is high, and margin expectations are already depressed. If the tariff window starts to close, the impact on earnings and valuation could be disproportionately strong.
🗓 Watchlist calendar
Over the next 2–4 weeks: track news on duty refunds and importer lawsuits.
March 19: Q3 earnings (key question: does North America strength persist?).
April–July: peak catalyst window ahead of the July 24 deadline.
⚠️ Key risks
A shift to a tougher tariff framework, no guarantee of full refunds due to legal complexity, and prolonged weakness in China slowing margin recovery.
💡 Bottom line
Nike in 2026 is one of the more interesting retail setups precisely because of the tariff window. The market is still reacting cautiously—and that can be the opportunity. Building a position on pullbacks below 62 USD makes sense, and a move above 80 USD looks achievable if the tariff narrative turns more favorable into July.
NFA | DYOR
With respect to everyone,
Yours, 🫡 #SinnSeed
Candle Structure Clashes With Ichimoku As Recovery Takes Hold
Nike is printing a conflicted setup where candle patterns overwhelmingly favor bulls but trend indicators disagree. The 2.1x recovery bounce shows buyers are responding to the pullback, though the structural split demands caution before calling this a turn.
Price is at 232.75 after a -3.8% retrace with an 8.1% bounce at 2.1x expansion, reading as recovered. Price percentile and range data are unavailable on this exchange listing but the recovered regime confirms the bounce has more than doubled the retrace distance. This is a market where dip buyers have shown up with intent.
Bias is moderate bull at 64.3% with a 27:15 signal count out of 112. But the internal conflict is striking. Candles are almost unanimously bullish at 13:1, one of the most lopsided candle readings possible. Counter-trend signals also lean strongly bullish at 11:3. Yet Ichimoku reads 3:10 firmly bearish and EMAs are flat at 0:0 providing no trend confirmation. Spread strength is 28.6% in the moderate zone. Clarity is low at 38% reflecting this internal disagreement.
The candle versus Ichimoku split tells a clear story. Short-term price action through candle patterns is decisively bullish but the broader trend structure through Ichimoku cloud and equilibrium lines still reads bearish. This is typical of early-stage reversals where price is turning before the trend indicators have caught up. It can also signal a bear market rally that gets rejected once it reaches trend resistance.
No squeeze is active with bandwidth at 11.99% which is wide. Momentum is bullish and pointing upward. Squeeze momentum is expanding downward at 365.1% creating a divergence with the bullish momentum direction. The wide bandwidth means volatility is elevated and any move from here will have room to travel.
Volume is steady at -0.29 Z on just 3 contracts and 698.25 in dollar terms. This is a low-liquidity listing. Direction reads neutral with falling momentum at -0.18. Bull and bear Z scores are perfectly matched at -0.16 and -0.16. OBV at 0.17 shows mild inflow with normal divergence. No whale activity.
The low volume on this exchange listing means the signals should be interpreted with extra context from the primary listing. The mild OBV inflow is a positive but not decisive given the thin participation.
Scenario 1 (55%) — Bull recovery extends as the 13:1 candle dominance and 11:3 counter-trend advantage translate into trend structure improvement. Ichimoku lagging indicators begin to flatten and eventually cross bullish as price maintains the recovered regime. The 2.1x bounce establishes a higher low framework.
Scenario 2 (45%) — Ichimoku resistance at 3:10 proves correct and the candle strength is a bear market rally. If price fails to sustain above the bounce level and momentum fades, the 0:0 EMA reading could tip bearish rather than bullish. The wide bandwidth environment would amplify a rejection move.
Watch for EMAs to break the 0:0 deadlock in either direction as the tiebreaker signal. Ichimoku beginning to narrow from 3:10 would confirm the candle structure is leading. OBV maintaining inflow and volume Z improving above zero would add conviction to the recovery case.
Risk is moderate with low clarity. The 38% clarity score reflects the genuine structural disagreement. The candle conviction is impressive but trend indicators carry weight. Position for the recovery but size conservatively until the Ichimoku conflict resolves.
More analysis on my profile.
NIKE, NKE, Nike, retail, consumer, recovery, candles, equities

**NIKE (NKE) — The Anatomy of a Blue Chip in Decline**NIKE (NKE) — The Anatomy of a Blue Chip in Decline**
*5-Year Financial Deep Dive | 7 Critical Red Flags | 2026 Scenario Analysis*
📅 February 2026 | Current Price: $64 | Weighted Fair Value: $42–52
---
**EXECUTIVE SUMMARY**
Nike is one of the most recognizable brands on earth. It is also, by the numbers of its own financial statements, a business in structural decline. Revenue has fallen from a peak of $51.4B in 2024 to $46.3B in 2025. Net profit margin has compressed from nearly 13% to 7%. Free cash flow has been cut in half. And the stock, at $64, still trades at nearly 30x earnings.
This analysis examines five years of Nike's income statement, balance sheet, and cash flow data to answer a single question: is the market correctly pricing a recovery, or has it not yet caught up with the severity of the deterioration?
Key metrics at a glance:
— Revenue 2025: $46.3B (↓ from $51.4B peak in 2024)
— Net Margin 2025: 7.0% (↓ from 12.9% average 2021–22)
— Free Cash Flow 2025: $3.3B (↓ from $6.6B in 2024)
— PE Ratio 2025: 29.6x (expensive for a declining business)
— Graham Number: $20.86 (stock trades at 3x intrinsic value)
— ROIC vs WACC: 11.1% vs 9.4% (margin narrowing rapidly)
---
**PROFITABILITY — THE REAL PICTURE (2021–2025)**
Using corrected data across all five years:
Gross Margin: 45% / 45% / 44% / 46% / 45% (2025→2021)
Operating Margin: 8.0% / 12.3% / 11.5% / 14.3% / 15.5%
Net Margin: 7.0% / 11.1% / 9.9% / 12.9% / 12.9%
FCF Margin: 7.0% / 12.9% / 9.5% / 9.5% / 13.4%
EPS Diluted: $2.16 / $3.93 / $3.23 / $3.75 / $3.71
The gross margin story is actually stable and consistent — 43–46% across all five years. This means Nike's pricing power and cost of goods have held up reasonably well. The problem is entirely in the operating cost structure below the gross profit line. SG&A has ballooned to 34.7% of revenue in 2025 versus a prior average of 31.5%, and operating margin has collapsed from 15.5% in 2021 to just 8.0% in 2025. The deterioration is real, linear, and structural — not cyclical noise.
---
**SEVEN RED FLAGS THAT DEMAND ATTENTION**
🚩 RED FLAG 1 — Inventory That Won't Clear
At $7.5B in 2025, inventory represents 16% of revenue and has barely moved despite a $5B revenue decline. In consumer discretionary, stagnant inventory signals demand failure, not supply management. The inventory in 2025 ($7.49B) is nearly identical to 2024 ($7.52B) despite lower sales — product obsolescence risk is rising quarter by quarter.
🚩 RED FLAG 2 — Zero Reported R&D
Nike built its entire identity on innovation — Air Max, Flyknit, Vaporfly, React foam. Zero R&D in 2025 means either aggressive capitalization of development costs or the innovation engine has genuinely stalled. Meanwhile On Running, Hoka, and New Balance increased R&D investment and took significant market share in the fastest-growing running and lifestyle segments.
🚩 RED FLAG 3 — Rising Dividend on Collapsing Free Cash Flow
DPS grew to $1.66 from $1.19 while FCF fell from $6.6B to $3.3B. Dividend payments on 1,476M shares now consume approximately 73% of FCF before any other capital needs. Management raising the dividend while the business shrinks is a signal of misaligned incentives — not financial strength. This trajectory is unsustainable beyond 1–2 years at current earnings levels.
🚩 RED FLAG 4 — $10B+ in Buybacks at Peak Prices
Nike spent $2.4B in 2025, $3.6B in 2024, and $4.8B in 2023 buying back stock at $78–$128 per share. The stock now trades at $64. This represents one of the worst capital allocation decisions by a blue-chip company in recent memory — value destruction of historic proportions that cannot be undone.
🚩 RED FLAG 5 — Capex Cut Nearly in Half
Capex fell from $969M in 2023 to just $430M in 2025 — below 1% of revenue. For a manufacturing-adjacent business with bloated inventory and falling margins, cutting reinvestment this aggressively signals management is preserving short-term cash optics rather than fixing structural problems. You cannot cost-cut your way to growth.
🚩 RED FLAG 6 — SG&A Creep on Falling Revenue
SG&A rose to 34.7% of revenue in 2025 from a prior average of ~31.5%. As revenue falls, the fixed cost base is not adjusting proportionally. This creates severe negative operating leverage — every dollar of lost revenue hits the bottom line harder than historical ratios suggest. Without restructuring, stable revenue still means declining margins.
🚩 RED FLAG 7 — The DTC Pivot Disaster
Nike's 2020–2022 decision to aggressively cut wholesale partners — including Foot Locker and DSW — to push Direct to Consumer permanently inflated SG&A, destroyed the inventory management buffer that wholesale partners provided, eliminated the demand signal that retailer orders gave, and directly caused the revenue and margin collapse visible throughout 2023–2025. This was the root cause of everything above.
---
**2026 SCENARIO ANALYSIS**
The following projections are built from clean 2021–2025 data, current trajectory analysis, and macro scenario assumptions. The current stock price of $64 is stress-tested against each scenario.
────────────────────────────────────
📉 SCENARIO 1: RECESSION — Probability 20%
GDP contraction, unemployment rising, consumer discretionary collapses. Cycling and premium sportswear are big-ticket purchases that get cut first. Fixed cost base doesn't shrink with revenue. Inventory impairment charges likely. Dividend cut becomes probable.
Revenue Est.: $38–40B (-14 to -18%)
Operating Margin: 4–5%
EPS Est.: $0.80–1.10
FCF Est.: $1.0–1.5B
Nike Fair Value: $28–35
vs. Current $64: -45% to -56% downside
────────────────────────────────────
📊 SCENARIO 2: INFLATION CPI 3–4% — Probability 30% (Most Likely)
Elevated inflation without recession. Consumer spending shifts to essentials. Input costs — materials, logistics, manufacturing — rise, squeezing already thin margins. With no R&D to differentiate, pricing power is limited. SG&A continues inflating in absolute terms. The dividend becomes a trap — management holds it to signal confidence while FCF barely covers it.
Revenue Est.: $43–45B (-3 to -7%)
Operating Margin: 6–7%
EPS Est.: $1.65–1.90
FCF Est.: $2.3–2.8B
Nike Fair Value: $42–48
vs. Current $64: -25% to -34% downside
────────────────────────────────────
📈 SCENARIO 3: STABLE — Probability 25%
No growth, no recession. Revenue flatlines, margins stabilize at current depressed levels. Warning: stable is not actually stable for this company. Rising SG&A and input cost inflation mean margins continue drifting lower even without a macro shock. Stable revenue with this cost structure is slow deterioration.
Revenue Est.: $45–47B (flat)
Operating Margin: 7–8%
EPS Est.: $1.90–2.20
FCF Est.: $2.8–3.2B
Nike Fair Value: $48–55
vs. Current $64: -14% to -25% downside
────────────────────────────────────
🚀 SCENARIO 4: GROWTH / RECOVERY — Probability 25%
Soft landing achieved, consumer confidence recovers, wholesale re-entry succeeds, inventory clears, margins recover. Requires simultaneous execution across multiple fronts — none of which are currently visible in the data. This scenario essentially demands a full reversal of every negative trend at once.
Revenue Est.: $49–51B (+5 to +10%)
Operating Margin: 10–11%
EPS Est.: $3.10–3.40
FCF Est.: $5.0–5.5B
Nike Fair Value: $78–90
vs. Current $64: +22% to +41% upside
────────────────────────────────────
PROBABILITY-WEIGHTED FAIR VALUE: $42–52
At $64, the market is pricing the Growth scenario as its base case — before it has happened.
---
**THE NIKE FACTOR — DOES THE BRAND CHANGE ANYTHING?**
Yes, partially. Knowing this is Nike rather than a generic consumer company changes the analysis in two important ways.
What the brand improves: Nike has a globally recognized brand with genuine emotional resonance, estimated at $30–33B in brand value. This justifies a premium PE versus sector peers and provides a floor that a generic company would not have. It also means a successful turnaround is more credible and faster than it would be for a weaker brand — the wholesale infrastructure still exists and partners still want Nike product.
What knowing it is Nike makes worse: A company that invented Flyknit and Vaporfly reporting zero R&D is inexcusable. A management team that spent $10B+ on buybacks at $128 and now watches the stock trade at $64 cannot claim sophisticated capital allocation. And the DTC pivot — cutting established wholesale relationships that took decades to build — was a strategic blunder of the highest order that a company of Nike's resources and market intelligence had no excuse to make.
The return of Elliott Hill as CEO in late 2024 is the one genuine positive in this entire dataset. He understands Nike's core identity in a way his predecessor did not. The strategic reversal — re-engaging wholesale, refocusing on sport, acknowledging the DTC overreach — is the right diagnosis. The question is whether execution is fast enough and deep enough to matter before competitive displacement in running and lifestyle becomes permanent.
Nike's brand lifts the recovery probability and raises the floor versus a generic peer. Revised probability-weighted fair value for Nike specifically: $42–52 versus $35–42 for a generic company. The downside is less severe. But it is still downside from $64.
---
**TURNAROUND BLUEPRINT — WHAT RECOVERY ACTUALLY REQUIRES**
These are non-negotiable, in order of priority:
① REBUILD WHOLESALE — IMMEDIATELY
The single highest-impact action available. Re-entry with Foot Locker, DSW, and regional accounts could recover $4–6B in revenue within 18 months because the infrastructure and partner appetite still exist. Already underway under Hill but pace matters — every quarter of delay is market share lost to Hoka and On Running permanently.
② INVENTORY LIQUIDATION BELOW $5B
Must be resolved within 12 months. Requires promotional pricing and wholesale channel clearing — a short-term margin hit necessary to restore working capital health. Holding $7.5B in inventory while revenue falls is not a strategy; it is a liability accumulating obsolescence risk daily.
③ SUSPEND OR CUT THE DIVIDEND
FCF of $3.3B cannot sustainably support $2.4B in annual dividend payments plus reinvestment needs. Growing the dividend while the business shrinks is the clearest sign of misaligned incentives in this dataset. Capital must return to the business. A dividend cut is painful short-term but financially necessary.
④ STOP ALL BUYBACKS
Every remaining dollar of FCF should flow to inventory reduction, debt paydown, and operational reinvestment. Continuing buybacks at $64 is better mathematics than $128 but still strategically wrong when the business urgently needs reinvestment capital.
⑤ REINSTATE R&D AT 2–3% OF REVENUE
A $900M–$1.4B annual R&D commitment is the minimum credible signal that the innovation engine is restarting. The company that created Flyknit and Vaporfly cannot compete in 2026–2030 on zero reported R&D while competitors invest aggressively in material science and platform technology.
⑥ REBUILD CAPEX TO 2.5–3% OF REVENUE
Minimum $1.2–1.5B annually to modernize supply chain, reduce per-unit costs, and rebuild gross margin toward 47–48%. At 0.93% of revenue, current capex is below maintenance level — a signal of financial distress management, not strategic confidence.
⑦ RETURN TO PERFORMANCE — LEAVE LIFESTYLE TO LIFESTYLE BRANDS
Nike lost performance credibility to On and Hoka by chasing fashion during the Donahoe era. Reconnecting with elite athletes, funding visible performance innovation, and re-anchoring the brand in sport is both a marketing and a product mandate. The swoosh means something. It should be earned again.
Realistic turnaround timeline: 18–36 months minimum if actions begin immediately in 2026. The stock is unlikely to re-rate positively until inventory normalizes, FCF stabilizes above $4B, and management demonstrates capital discipline consistently over multiple quarters.
---
**FINAL VERDICT**
Nike is not a dying company. It is a great brand that made a catastrophic strategic error, compounded it with poor capital allocation, and is now navigating the aftermath under new leadership. The financial damage is real, measurable, and not yet fully reflected in a $64 stock price that implies recovery before recovery has occurred.
Weighted Fair Value: $42–52
Current Price: $64
Implied Downside: -19% to -34%
For long-term investors with a 3–5 year horizon who believe in Elliott Hill's execution, the $40–45 range represents a more rational entry point — where you are paying for the business as it is, not the turnaround as management hopes it will be. At $64, you are buying the market's optimism, not its caution.
The brand is real. The moat is real. The recovery is possible. The current price simply requires too much faith before the evidence arrives.
---
*DISCLAIMER: This article is for informational and educational purposes only and does not constitute financial advice or investment recommendation. All financial data is sourced from publicly available statements. Past performance does not guarantee future results. Always conduct your own due diligence and consult a qualified financial advisor before making investment decisions.*

Is Downtrend Over For Nike (NKE)? On the Weekly timeframe, Nike has been following the global trendline since November 21, and a potential breakout above it and 70.50 resistance could be supported not only technically but also fundamentally.
Earnings resilience
Recent earnings reports showed Nike still managing to beat profit expectations despite industry pressure, reducing the risk of immediate fundamental downside during a price recovery.
Stable North American demand
Nike’s core market remains relatively strong, while the company continues to balance wholesale and direct-to-consumer channels.
Cost optimization & digital focus
Ongoing restructuring and efficiency efforts may help stabilize margins over the upcoming quarters.
Institutional interest remains
Several analysts maintain cautiously optimistic medium-term outlooks, creating room for gradual recovery after the prolonged correction.
Technical standpoint:
The price follows the global trendline, and the 50-MA gives additional pressure.
MACD oscillator, however, crosses the o-line upwards, suggesting a potential breakout.
A clean break above 70.50 could attract buyers and push the price toward the next liquidity zone on the OB (order block) at the 120.00 resistance level.
However, risks remain
China's sales recovery is still uncertain.
Margin pressure and competition in sportswear remain strong.
Markets may quickly take profits on rallies.
Not financial advice. Trade responsibly and manage risk.

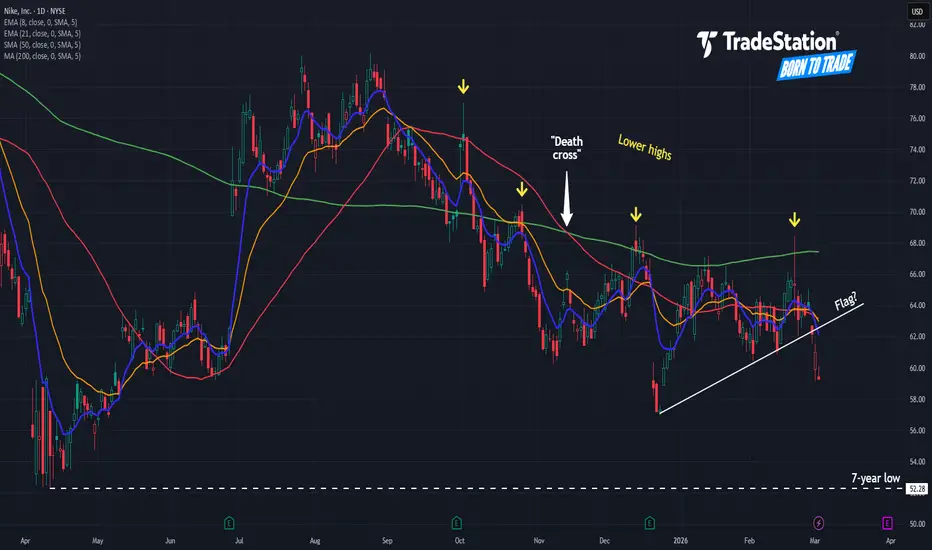
Is This a Wyckoff Secondary Test? A High Risk–Reward ZoneIf we are currently in a Wyckoff Accumulation phase, then what we are likely seeing now is a series of Secondary Tests.
To trade this area properly, I believe we should combine Wyckoff analysis with an additional technical setup in order to better define our risk-reward profile.
In this case, the inverse head and shoulders pattern forming in this zone - together with the Secondary Test - creates a very interesting area to look for long entries above the neckline breakout.
If our count is correct and this is indeed a Wyckoff Secondary Test, then the first target would be around the Automatic Rally high.
At that point, the stock will have to decide whether it is ready to shift the larger trend from bearish to bullish - or whether it wants to roll over again for a possible third test, maybe even a final shakeout before a real breakout higher.
Either way, this zone offers an excellent opportunity with a very attractive risk–reward ratio of approximately 3.4:1.
This is for educational purposes only - not financial advice.

Nike's Contrarian Setup: Political Noise vs. Brand ResilienceThe sportswear giant (NKE) is trading near multi-year lows following EEOC investigation headlines, creating a classic disconnect between political optics and underlying brand economics. While the stock faces near-term headwinds, the risk/reward asymmetry at current levels warrants attention for income-focused strategies.
The Political Catalyst:
On February 5th, the EEOC filed a subpoena enforcement action against Nike over DEI-related discrimination allegations—notably, not stemming from employee complaints, but from a Commissioner's Charge initiated in May 2024. Legal experts characterize this as Nike "being made an example of" under the Trump administration's anti-DEI initiatives. The company responded that the action feels like a "surprising and unusual escalation" after extensive good-faith cooperation, having already submitted thousands of pages of documentation.
Market reaction? Counterintuitively, shares rose 5.4% post-disclosure, suggesting investors view this as political theater rather than a fundamental business threat.
The Oversold Context:
Nike has lost 65% of its market value since November 2021 highs—down 29.8% in 2022, 7.2% in 2023, 30.3% in 2024, and 22.4% year-to-date. The stock now trades at $62, well below the analyst consensus target of $76.34 (23 Buy ratings vs. 2 Sell), representing implied upside of +25%.
Despite recent struggles (Q3 guidance projects low-single-digit revenue decline, margin compression of 175-225 basis points), CEO Elliott Hill framed the situation clearly: "We're in the middle innings of our comeback." Recent Q2 earnings beat expectations with wholesale segment growing 8%, though Nike Direct declined 9%.
The Turnaround Thesis:
The bear case is well-telegraphed: margin pressure, China weakness, DTC transition challenges. But the investment community appears anchored on near-term noise while overlooking the durability thesis. Nike's global brand moat, $90B market cap, and 2.5% dividend yield provide a foundation that political investigations cannot erode.
My Approach:
I'm considering utilizing option premium around the psychological $60 level—a price point that has demonstrated support throughout this multi-year decline. The 8-day timeframe aligns with capturing premium decay as the EEOC headlines fade from front pages and focus returns to fundamental execution.
Setup Structure:
Evaluating Feb 13 puts around the $60 strike
Entry premium targeting ~$0.55 (mid-market)
Projected yield: 0.92% on collateral over 8 days
Risk buffer: -0.21 delta / 3.9% safety margin
Time horizon: Hold through expiration
Risk Parameters:
Circuit breaker protection at 3x premium ($1.66) guards against tail events. The setup requires conviction in Nike's brand resilience despite operational headwinds—this is capital allocation under uncertainty, not a guarantee of mean reversion.
The Contrarian Logic:
When a blue-chip brand trades at multi-year lows due to largely political (vs. operational) catalysts, while analysts maintain bullish consensus and management frames the narrative as "mid-comeback," income strategies at support levels offer asymmetric risk/reward for patient capital.
⚠️ Risk Disclosure:
This analysis is educational only and does not constitute financial advice. Options trading involves substantial risk including total premium loss. Political and regulatory investigations carry unpredictable outcomes. Nike's operational challenges (margin compression, China exposure) present legitimate downside risks beyond political noise. Always conduct independent research and verify live market conditions before trading decisions. Past brand strength does not guarantee future performance.

Got back into $NKE. These small box breaks at the low of the rGot back into $NKE.
These small box breaks at the low of the range usually offers good odds with favorable risk/reward.
Also like the recent CEO buying.

Bullish Deep Crab + Double Bottom at PCZPattern Identified: Bullish Deep Crab (0.886B/1.618XA with 2.0 BC Projection Confluence) with strong confluence at Potential Reversal Zone (PRZ).
Key Confluence:
Retracement Profile: Dual 0.886 retracements at B and C indicate powerful but potentially exhausted counter-trend momentum
Perfect Crab Ratios: 0.886B/1.618XA is the classic Deep Crab definition
BC Projection Strength: 2.0 extension adds significant confluence to the 1.618 XA level
Confirmation Signals Needed:
Increasing volume on reversal from PRZ and breakout of downwards trendline (green diagonal line).

Bottom Developing-Early Entry200 SMA ever so slightly turning upward after an undecided golden cross.
This all correlates to a low set March 2020
I am making first entry in the right shoulder area. Looking for a first move to resistance.

NIKE : Long From Demand Zone With Target at $75Nike is trading near the lower end of its recent range after a sharp pullback, approaching a clear demand zone where selling pressure is starting to fade. The downside move looks corrective rather than impulsive, with price stabilizing after flushing late sellers.
From a sentiment perspective, Wall Street remains constructive. Based on 23 analyst ratings, NKE is rated Moderate Buy, with multiple price targets clustered in the $75–100 range. This supports a mean-reversion long thesis from current levels.
I’m looking at this as a structure-based long, not a momentum play. Risk is well-defined below demand, while upside offers an attractive asymmetric setup.
Trade Plan (Long):
• Entry: 61-64
• Target: 75
• Invalidation: Daily close below 52

LONG SETUP: Nike, Inc. (NKE)📈 LONG SETUP: Nike, Inc. (NKE)
Hunters, the sentiment is flipping! 🚀 After recent consolidation, Nike is serving up a clean and clear "easy trade" opportunity on the long side.
Nike stock ( NYSE:NKE ) has successfully defended a crucial price level, and the market structure is now favoring the bulls. We have clearly defined risk and logical upside targets.
🔍 Technical Analysis & Reasons for Entry:
Higher Low Formation: Following the correction, the price respected the previous bottom, confirming buyer strength in this zone. We refused to go lower, which is the first signal of a short-term trend reversal.
Reaction at Support: We see a clear bounce off the key support zone. The market has stopped accepting lower prices, and buying volume is starting to pick up.
Room to Run: We have "Clean Traffic" up to the nearest significant resistance, giving us space for a quick and fluid move upward without unnecessary obstacles.
📊 Trade Parameters:
Entry: Current Market Price (Market Order)
Direction: LONG (Buy)
Stop Loss: Below the previous swing low (uncompromising capital protection). If the price drops below this level, the thesis is invalid.
Targets (TP): We are targeting the nearest resistance zones where profit-taking is expected (local highs and liquidity above them).
Risk Reward Ratio (RRR): Very favorable, as the stop loss is tight and the profit potential to resistance is multiple times higher.
This setup is the definition of "Keep It Simple" trading. We trade what we see, not what we think.
Disclaimer: This is not financial advice. Trade responsibly and stick to your risk management.
#StockHunterSimon #Trading #Stocks #Nike #NKE #LongPosition #Bullish #MarketUpdate #January2026

45% minimum by May?Nike has delivered strong earnings, even with the imposition of tariffs, but what could be the catalyst for a rally that allows it to recover value over the next four months? Perhaps the new acquired economies generated by Trump’s actions, I am referring to Venezuela. These artificial expansions of the economy could help drive an expansion in corporate multiples.

$NKE: The "Repair Job" in Progress for NIKE👟👟
Nike is currently like a classic sneaker getting dusted down and cleaned up.
It’s not quite "dead money," but it’s definitely not back to full speed yet.
The "Hype" (Why Bulls like it)
The Big Bosses are Buying: CEO Elliott Hill and even Tim Cook (Apple CEO/Nike Board) just dropped millions of their own cash into NYSE:NKE shares. Usually, when the insiders buy the dip, they know something we don't.
Back to Basics: Nike is ditching the "lifestyle" fluff and winning again in Performance Running (up 20% recently!).
North American sales are finally waking up, proving the "Win Now" strategy isn't just a slide deck.
The "Haters" (Why Bears are wary)
China is Still "Meh": Sales in China have been sliding for over a year. It's a tough market to crack right now.
Tariff Trouble: Global trade drama and higher costs are eating into the profits (margins are down about 3%).
The Wait: Management says it’s "middle innings" of a comeback. In other words: bring your patience.
The Bottom Line
If you believe in the "Insider Effect" and the running shoes reboot, this is your entry zone. If you need proof, wait for the $69 breakout.
#NKE #Nike #Turnaround #ValuePlay #TechnicalAnalysis

Trend is your Friend. #NKE is a prime example...fade the bullish moves
look for continuation down
that is going to be the money maker
shorting into resistance
not longing on reversals

Nike accumulation? I'm looking at Nike for a while now and it's a really interesting chart, we have been in a downtrend since 2021 and the stock has lost quite a lot of value due to inflation, tariffs and rising competition. Nike's leadership has changed and a new CEO has been leading the company for a year now. Also big money has started to accumulate Nke stock like Tim Cook and other players (DYOR). The stock has also hit a strong demand zone (blue box on the chart) where we've seen quite a lot of buyers come in the market and the volume also shows that. I've started to buy the stock and will acumulate it until we either go up or break the blue box which is the demand zone.

NKENIKE ( NYSE:NKE ): Turnaround or a New Wave of Decline?
The Big Picture: Earnings, Insiders, and Technical Resistance
Nike’s Q2 FY26 report shows a modest 1% revenue growth ($12.4B), but the surface growth hides structural decay.
Gross margin plummeted 300 bps to 40.6%, driven by aggressive tariffs and heavy discounting to clear inventory.
Regional & Segment Breakdown:
North America (+1%): Stagnant momentum.
Greater China (-17%): Six consecutive quarters of decline. The "Guochao" trend (preference for local brands) is a structural nightmare for Nike.
DTC (-8%): The "Nike Direct" strategy is faltering, while the brand has already lost crucial shelf space at major wholesalers.
🔎
