Technical Analysis
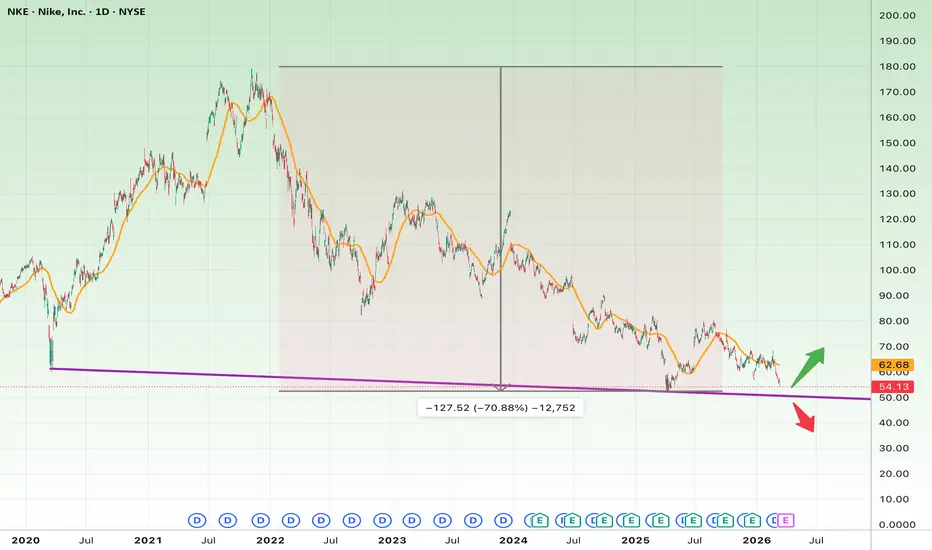
The daily chart of Nike Inc. (NKE) shows that the stock has been in a long-term downtrend after reaching its previous highs.
Overall, the stock has declined by more than 70% from its peak, bringing price into a critical long-term support zone around $50–$55.
This level aligns with a major long-term trendline, making it a very important technical area.
The reaction here could determine the stock’s direction for the coming months.
Bullish Scenario
If buyers manage to defend the $50–$55 support zone, a relief rally could develop.
Potential upside targets:
First target: $65
Second target: $75
Third target: $90
Suggested stop loss:
$48
A break above $75 could shift the structure from bearish to neutral or even bullish.
Bearish Scenario
If price breaks below the $50 support level, the long-term downtrend may continue.
Potential downside targets:
First target: $45
Second target: $38
Third target: $30
Stop loss for short positions:
$60
Fundamental Analysis
Key fundamental factors affecting Nike include:
1. Slowing Revenue Growth
Nike’s revenue growth has slowed in recent years due to changing consumer trends and macroeconomic pressures.
2. Increasing Competition
Companies such as Adidas and Under Armour are intensifying competition in the athletic apparel market.
3. Direct-to-Consumer Strategy
Nike is expanding its direct-to-consumer (DTC) model through its website and mobile apps, which could improve profit margins.
4. Global Brand Strength
Despite recent challenges, Nike remains one of the strongest global sports brands, supported by major athlete partnerships and sponsorship deals.
Disclaimer
The information and publications are not meant to be, and do not constitute, financial, investment, trading, or other types of advice or recommendations supplied or endorsed by TradingView. Read more in the Terms of Use.
Disclaimer
The information and publications are not meant to be, and do not constitute, financial, investment, trading, or other types of advice or recommendations supplied or endorsed by TradingView. Read more in the Terms of Use.