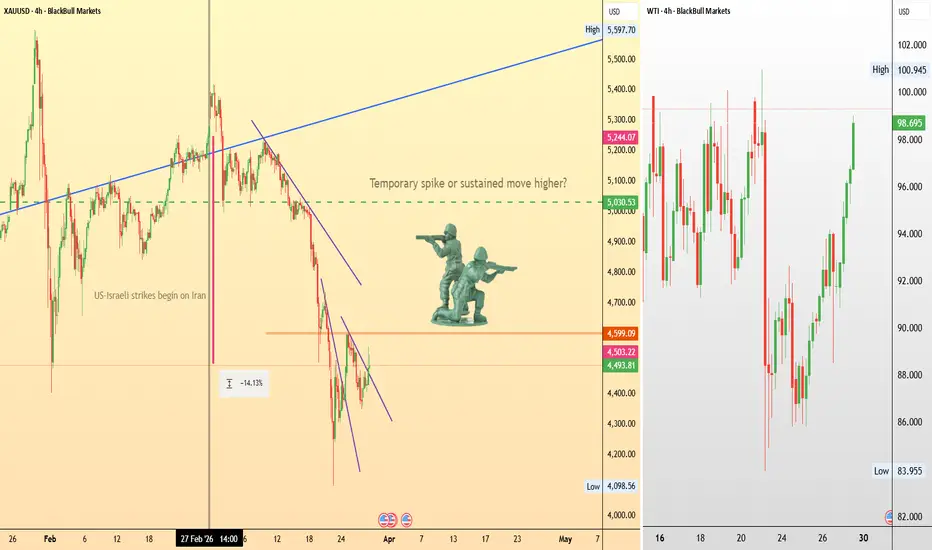
Will a ground invasion finally move gold?From a technical perspective, gold is currently in a clear short-term downtrend following the initial geopolitical spike. Gold appears to be waiting for a stronger catalyst.
Are ground troops what gold needs to start moving upward?
Iran has claimed it could mobilise more than 1 million troops to counter what it describes as a “suicidal” U.S. ground war on Iranian soil.
The United States has deployed approximately 5,000 Marines from bases in Japan and California, alongside 2,000 personnel from the elite 82nd Airborne Division. In addition, the USS Tripoli has just arrived carrying a further 3,500 troops.
Although, diplomatic efforts are apparently still active. Talks between the U.S. and Iran are expected to take place in Pakistan in the coming days.
The key level to watch is around $4,600, which is now acting as a potential resistance.
The key trading question around any ground troop invasion announcement is whether gold would deliver only a brief spike on the news or begin a more sustained move higher.
Goldtrader
Continue shorting gold.Yesterday, the gold market experienced an epic collapse, with bulls suffering a series of defeats. After retreating to a low of around 4099, it began a corrective rebound, reaching a high of around 4513 before retreating again. During the US session, it fluctuated at low levels, with buying gradually entering the market. It closed at around 4406, with the decline narrowing. The market has transitioned from a panic sell-off to a low-level consolidation phase, marking its ninth consecutive day of decline, the longest losing streak in nearly two years. The bulls were routed, while the bears were unstoppable. Gold opened near 4413 today, touching a low of around 4305 before rebounding strongly in the European session, reaching a high of around 4448. These figures reflect the significant volatility in gold recently, with both sharp drops and rebounds involving fluctuations of tens of points in an instant, increasing the difficulty of trading. Currently, the daily chart shows a long lower shadow, indicating strong support around 4100. However, the moving average system is bearish, with short- and medium-term moving averages diverging downwards, suppressing any rebound. The overall downward trend remains unchanged; the only test is the strength of any rebound. The intraday high around 4450 may become a short-term high, so we can continue to place short orders below this level. If gold rebounds to around 4425-4445, we can continue to short.

Respect the market; only by surviving can you have a chance!Looking at the current overall volatility in gold, the price fluctuations have significantly increased, with swings of one or two hundred US dollars, making short-term trading much more difficult. However, this high volatility also means that opportunities and risks coexist. In this environment, instead of blindly pursuing large single profits, it's better to take controllable profits in stages during the fluctuations. For example, during the morning's one-sided decline, we have already seized two short-selling opportunities. Although we didn't deliberately try to maximize the potential gains, in the current market, being able to steadily secure profits is key. Our strategy remains unchanged: avoid chasing orders, patiently wait for opportunities, participate with the trend, and control the pace and position size. It's important to note that once the market reverses, the continuation is often strong. Therefore, the market actually offers many trading opportunities; the key is whether you can grasp the rhythm. For short-term trading, pay close attention to the resistance area of 4480-4500. If the rebound is met with resistance and fails to break through effectively, consider placing short orders in batches. In this highly volatile environment, stability is more important than aggressiveness. Controlling risk is the key to long-term success.

How to properly seize gold trading opportunities?Gold Technical Analysis: Gold has broken through the lows again, currently reaching around 4100. To be honest, in the current market, chasing the rise is risky, and shorting is risky as it may rise further. What should you do? It's all just a game of strategy. The current market has fallen from the 5000 mark to around 4100, and it's unlikely to reach 4000 today. Plus, the current volatility is easily in the hundreds of points, so there's really no good advice to give.
In the short term, the market remains weak, with the rebound momentum still limited. The short-term trend remains bearish, with resistance currently around 4400. If the European session continues to face resistance at 4400, the market will remain weak, and short-term trading should focus on selling. The key support area below is between 4100 and 4080, a crucial and strong support zone. A direct break below this zone would indicate that the downward momentum and speed have not slowed. Conversely, if the rate of decline slows and the volatility decreases within this range, it would suggest that the bearish momentum is weakening. If the decline accelerates again, it could very well head straight for the 4400 area. In the current situation, we need to follow up with short-term trades. Going long is not an option, and shorting is only suitable for short-term trading. It is important to note that once this wave of panic subsides and the bear market ends, a rebound is inevitable. Once signs of stabilization appear and a rebound begins, it will be an opportunity for investors who have accumulated funds to buy more at lower prices to average down their cost basis. Then, when the market rebounds, both those who bought at higher and lower prices can exit the market to reduce losses or break even. The strategy for today remains to sell on rallies, entering short positions near 4400. Given the current price action, 4000 may not hold. In summary, today's gold trading strategy is to primarily sell on rallies and secondarily buy on dips. The key resistance level to watch in the short term is 4400-4420, while the key support level is 4100-4080. Please follow the recommendations carefully.

xauusdperfect drop last week after 4 days ranging, i had posted gold analysis 2 week before the drop take a look and leave your comment, after 500$ drop last week gold is not easy to predict as we all know.
i made some line take a god look and let me know what are your thought? leave a commnet below, i trade mostly on gold 90% ( jpy 5% ) ( btcusd 5% ) for short i suggest a good pull back, looking for long on great liquidity grab.
btcusd drop as analysis on last week, who took advantage, congrats to them.
happy weekend.
trade for skill not for money.

Gold awaits stabilization; patiently wait for opportunities.From a technical perspective, gold rebounded quickly after testing the lows, forming a certain degree of bottoming signal. The 4-hour indicators are gradually recovering, and the short-term trend has temporarily escaped its previous extreme weakness, entering a recovery phase. The 4645-4625 area is a key support zone, with significant buying support seen on multiple pullbacks, indicating a certain level of support. The trend is gradually showing signs of stabilization and recovery, a pattern of oscillating rebound. Given the current lack of major news catalysts, it is unlikely to establish a one-sided trend in the short term. Therefore, the recommended trading strategy is to primarily buy on dips. If the price pulls back to the 4645-4625 area and stabilizes, a small long position can be considered. It is important to note that gold is still in a technical recovery cycle after the previous sharp decline. Although bottoming signals are gradually emerging, caution is still advised. Avoid chasing highs and lows, and patiently wait for suitable entry points.

It's time to boldly try a move in gold!Gold has recently continued its downward trend, with bears clearly dominating and limited rebounds. The market has exhibited a smooth and rapid decline. Our recent market timing has been relatively accurate in gauging both long and short positions, resulting in satisfactory overall gains. From the current trend structure, gold prices remain in a weak trading channel, and a significant reversal signal is unlikely in the short term. This near-precipitous decline may continue. Key support levels to watch are around 4500. If it falls further, the 4400 area can be considered a significant support level and a potential target range. Our trading strategy is to primarily sell on rallies. In the short term, pay close attention to the resistance levels around 4650-4670 as a reference point for shorting. Until the trend changes significantly, maintaining trend-following trading and controlling position size and pace remain the core strategies in the current market.

What will become of gold?From the current trend structure, gold is showing a clear pattern of slow decline with fluctuations. On the daily chart, the gold price is in a downtrend, with the downtrend momentum being released gradually rather than in a concentrated burst. On the 4-hour chart, the Bollinger Bands are maintaining a narrow range, and the gold price continues to fluctuate around the lower half of the middle band. The RSI indicator is fluctuating between 40 and 50 and has not yet entered the oversold zone, indicating that there is still some room for further decline. Meanwhile, we can see that the overall rebound is weak and lacks sustainability. Resistance is concentrated in the 5030-5050 area, and the trading range is gradually shifting downwards. Overall, the current slow, downward trend is likely to continue. In the short term, although gold prices are still above the 5000 level, the trend has clearly weakened, and prices are trading below major short-term moving averages. Momentum indicators are also declining, further indicating that short sellers still dominate in the short term. Therefore, today's trading strategy should focus on: primarily selling on rallies, with buying on dips as a secondary approach. Key resistance levels to watch are the 5030-5050 area, and key support levels are the 4970-4950 area. The market rhythm is gradually becoming clearer; the key is execution and timing. Please follow along.

Is the decline in gold prices a risk or an opportunity?Gold prices fell to a low of around 4967 today before rebounding significantly. The overall trend remains within a range-bound movement, with bulls and bears vying for dominance. A decisive breakout from this range in the short term will be challenging. Therefore, in this market environment, the key to trading is not frequent trading, but rather precise entry points and timing.
From the current trend structure, the area around 4980-4965 remains a relatively important short-term support zone. Once the gold price retraces to this area and stabilizes, going long remains a relatively reasonable trading strategy in the short term. However, it is important to note that in a volatile market, one should not blindly chase the price higher. A more stable approach is to patiently wait for a pullback confirmation before entering the market. The trading market is never short of opportunities; the key lies in patience and discipline. If you are currently not doing well in your trading or are confused about market rhythm, you are welcome to communicate and exchange ideas. I hope to help everyone avoid some detours on their investment journey.

btcusdi see big fall ahed continue on btcusd,major support is been protecting for a last 4 week can go short soon or to wait for the break out, as lines and wording give you all clean idea. let me know if i miss something.
happy weekend.

GOLDevery week is been amazing experince and new challange as we know gold is sometime easy and some time is complicated, here is my analysis base on daily frame, p-1 and p-2
what you all think let me know in the comment.

(Gold) 1H – Bullish Continuation After Support Rejection
Market Overview
On the 1-hour timeframe, Gold is maintaining a short-term bullish structure following a strong impulsive rally from the 4,990–5,000 region toward the 5,240 highs. The market recently pulled back into a clearly defined support zone (5,080–5,110), where buyers stepped in aggressively.
The rejection from this demand area confirms that the broader bullish momentum remains intact.
Key Technical Structure
1. Impulsive Leg
Strong bullish expansion from ~4,995 to ~5,240.
Momentum-driven breakout, indicating institutional participation.
Higher highs and higher lows established.
2. Pullback into Support
Price retraced into the marked support zone.
Clear V-shaped rejection from support.
Structure remains bullish as long as this zone holds.
3. Resistance Zone
Immediate resistance: 5,220–5,240.
This area previously acted as supply.
A clean breakout above 5,240 would likely trigger continuation buying.
Trade Scenario (Based on Chart Structure)
Entry Zone: After confirmation of bullish reaction above 5,150–5,170
Stop Loss: Below 5,080 (under support zone)
Target 1: 5,220
Target 2: 5,240
Extended Target: 5,260+ if breakout occurs
Risk-to-reward profile remains favorable while price stays above the demand area.
Bullish Confirmation Signals
Higher low formation on lower timeframes
Strong bullish candles near resistance
Break and close above 5,240
Invalidation Scenario
If price breaks and closes below 5,080, the bullish structure weakens and deeper retracement toward 5,030–5,000 becomes likely.
Conclusion
Gold remains structurally bullish on H1. The support zone reaction suggests continuation toward the 5,220–5,240 resistance band. A breakout above this level could open the path for fresh highs.

(XAUUSD) Analysis – Potential Reversal from ResistanceOverview
The chart shows an earlier CHoCH (Change of Character) on the left side, confirming a bearish structural shift.
After the sharp sell-off, price formed a higher low and began a corrective bullish move.
However, the broader structure remains fragile as price recently created equal highs and liquidity sweeps before moving higher.
📍 2. Key Zones Identified
🔵 Resistance Zone: 5,017 Area
Strong supply zone.
Previous reaction point.
Current price has impulsively tapped into this level.
Likely liquidity grab above prior highs.
This is the critical decision point.
🟫 FVG (Fair Value Gap) – Mid Zone
Located below current price.
Acts as imbalance that price may revisit.
Often works as a magnet after impulsive moves.
🔴 Support / Target Zone: 4,911 Area
Marked as strong demand.
Previous reaction base.
Aligns with projected bearish path.
Logical downside target if rejection confirms.
📊 Current Price Behavior
Strong bullish impulse into resistance.
No major pullback yet (overextended move).
Reaction from resistance will determine next direction.
📉 Bearish Scenario (Higher Probability Setup)
If price:
Rejects strongly from 5,017 resistance
Forms bearish structure (lower high on lower timeframe)
Then likely path:
Drop into FVG
Break minor structure
Continue toward 4,911 support (target zone)
This aligns with liquidity sweep + mean reversion logic.
📈 Bullish Invalidation Scenario
If price:
Breaks and closes strongly above 5,017
Holds above resistance as support
Then:
Structure shifts bullish
Next upside expansion likely
🎯 Trade Idea Summary (Conceptual)
Setup Entry Zone Target Invalidation
Short 5,017 resistance rejection 4,911 Strong close above resistance
🧠 Overall Bias
Short-term bias: Bearish from resistance
Confirmation needed: Lower timeframe rejection + structure break
This is a classic liquidity grab into supply → potential distribution move setup.

A volatile week ahead for gold and silver tradersGold and silver have started the week with a clear bullish tone, attempting to re establish upside momentum.
For gold, the focus is $5,092 to $5,100. A sustained move above this zone, which includes the February 4 high, would help confirm a renewed upside phase.
The big event this week is the delayed US Non Farm Payrolls report due on Wednesday. In the lead up, the Fear and Greed Index appears to be drifting away from elevated greed levels, although its perhaps too early to make this call.
Metals are also finding support from concerns about the Federal Reserve’s independence. These concerns have weighed on the US dollar, with the dollar index sliding from near 98 toward the 96 area.

Continue to adjust and identify entry points for long positions.Gold has been fluctuating by $200-300 daily recently, which is no longer unusual. Our focus should be on managing and minimizing risk. We're watching the resistance level around 5000-5020. Gold is likely to continue its consolidation before choosing a direction. On the downside, we're watching the support level around 4820-4800. Technically, we continue to focus on buying on dips that hold. Recent international developments, including the US-Iran negotiations, will be key drivers of gold's price movements. We must be cautious in the face of volatile markets. Overall, gold is expected to trend upwards with some volatility. We should continue to maintain our strategy of buying on dips. If you're interested in gold but don't know where to start or are experiencing difficulties with your trading, feel free to contact me for discussion.

GOLD 15M Chart LONGHi Trader,
Another Rally Started on GOLD 15M Chart.
Same Chart, Same Setup on many confluences.
BOS, OB, FVG, SUPPORT Level, Lower Trendline Rejection
Entry 4975
Take Profit 5150
STOP LOSS: 4875
Its not a trading signal, its purely technial analysis
Trade with cautious
The Quantum Trading Mastery

A gold rebound requires more caution.Since bottoming out around 4400, the current gold rebound has reached nearly $700. From both a technical and market sentiment perspective, significant profit-taking pressure has accumulated. Blindly chasing the rally at this stage carries a relatively high risk. The current 5090-5110 range forms a clear parallel channel resistance zone, with significant technical suppression. Furthermore, with the ADP employment data release approaching, the market tends to be cautious before key data releases, and some long positions may choose to exit early to avoid uncertainty. In terms of trading strategy, it is recommended to try shorting gold with a small position around this resistance zone, paying attention to potential profit-taking pullbacks before and after the data release.

Gold and Silver reacting to NFP blackout The US Bureau of Labor Statistics informed markets that Friday’s scheduled release of the latest Nonfarm Payrolls data will be suspended.
That lack of visibility increases the likelihood of elevated volatility in the weeks ahead. We are already seeing this in precious metals.
Gold prices are on track for their largest daily gain since November 2008. Spot gold jumped more than 5 percent to around $4,913 per ounce.
Silver has also moved aggressively higher, with spot prices rising over 9 percent to about $86.89 per ounce.
From a technical perspective, both gold and silver are reacting cleanly around key Fibonacci retracement levels. Gold’s recovery has now pushed price back toward the 38.2 percent retracement, which is acting as the first meaningful resistance zone. Silver shows a similar structure but with higher volatility. The 23.6 percent level is now acting as near-term support, while the 38.2 percent retracement sits overhead.

Gold, risks are looming!The current gold market is booming, surging forward with overwhelming momentum. After opening with a gap on Monday, it quickly filled the gap, touching a low of around 4989 before resuming its upward trend. Last night, it rapidly broke through the resistance level of 5110 and surpassed the 5200 mark, currently reaching a high of 5247. The price movement in the short term is dazzling. The current rise is mainly due to renewed geopolitical risks, coupled with growing market expectations of a Fed rate cut, leading to a reckless surge by the bulls. From a technical perspective, gold is at a dangerously high level, with major indicators showing signs of severe overbought conditions. There is upward pressure for a pullback, but the ultimate destination remains uncertain. Market movements often end in a frenzy, and yesterday's and the initial surge after the opening may be the last gasp from the bulls. I personally predict that gold may show signs of topping out today. Coupled with the interest rate decision, the current rapid rise may be a premature release of bullish energy. At this point, support and resistance levels are not important; it's more about psychological factors. Given this unclear pattern, we can only try small, high-risk strategies and avoid wishful thinking. Light, tentative trades are the best approach. Intraday, we can consider shorting around 5245-5260, carefully managing our position size.

After gold broke through $5,000, risks and opportunities coexistGold touched a low of around 4990 yesterday, in line with analysis expectations. After the pullback, it successfully stabilized and rebounded, and the overall structure remains in an uptrend. Today's trading strategy continues to focus on buying on pullbacks, avoiding chasing highs and following the crowd. Currently, bullish sentiment in the market is clearly heating up, but it is necessary to be wary that after gold broke through the 5000 mark, its overall performance is somewhat weak, and the high-level market carries hidden risks, significantly increasing the difficulty of trading. The key resistance level to watch is the 5090-5100 range, where a short-term pullback is possible. On the downside, the key support level to watch is the 5010-4990 range. As long as this area is not broken, the overall strategy remains to buy on dips. Yesterday, we clearly advised patiently waiting for a pullback confirmation in the 5010-4990 range. Today's strategy continues this logic. We will continue to focus on the support level of 5010-4990. When the price approaches this level, we can consider placing long orders in batches. It is particularly important to note that if 4990 is broken effectively, we should be wary of gold further testing the cycle trend line near 4900. Once this level is broken, a short-term shift in the bullish/bearish structure may occur, entering a new adjustment cycle. The current market is filled with voices advocating for buying, but in reality, risks and opportunities coexist. When viewing market trends rationally, timing is always more important than direction. If you're interested in gold but don't know where to start, or if your recent trading hasn't been going well, feel free to come and discuss it with us.

How to position for both long and short positions?Gold Price Analysis for Next Monday: Looking ahead, the factors supporting gold's upward trend remain intact. Central banks are still increasing their gold reserves, and safe-haven demand hasn't subsided. However, it's important to note that gold is currently at historically high levels and a short-term pullback is possible. For example, it fell by about $110 on January 22nd. Therefore, avoid chasing the price higher.
Gold Technical Analysis: Gold encountered resistance around 4967 this afternoon, reaching a low of around 4900 during the European session before stabilizing and rebounding. During the US session, gold prices continued their strong upward trend. Looking at the daily chart, gold is showing a series of large bullish candles, with indicators in a bullish alignment and providing support below the price. The outlook remains bullish, but indicators have shown oversold signs, so caution is advised. Gold has rebounded after its recent decline, indicating strong bullish momentum. Technically, the 4-hour MACD shows a golden cross, and the price is trading above the Bollinger Middle Band. A buy-on-dips strategy is recommended for gold. The support level has reached 4888, and the gold price can maintain an upward trend as long as it stays above this level. The hourly support level has also been raised to 4900. In addition, everyone should be wary of the 5000 level, which is a historically significant psychological barrier and may experience a sharp drop. We are not speculating, but just being aware that if a drop occurs, do not go long again and do not be overly bullish! Beware of profit-taking! In summary, the recommended trading strategy for gold is to primarily sell on rallies and secondarily buy on dips. The key resistance level to watch in the short term is around 4900-5000, while the key support level is around 4900-4880. Please keep up with the market's pace.

Gold continues to hit new all-time highswhere is the next targetGold prices rose to around 5111 today before encountering resistance and pulling back. Currently, the overall market is still in a correction and consolidation phase. It's not recommended to blindly chase the price higher at this level. A short-term pullback is a normal adjustment, and the technical indicators still need some room to correct the structure. The key support level to watch in the short term is the 5065-5050 range. The trading strategy remains bullish, focusing on buying on pullbacks and patiently waiting for entry opportunities after the correction. It's important to note that a pullback does not equate to a market reversal; it's more of a change in the pace of the uptrend. Maintain a consistent trading strategy, avoid emotional judgments, and participate cautiously. For those interested in gold but unsure where to start, or whose recent trading has been less than ideal, feel free to contact me. At this stage, adhere to the core strategy of buying on pullbacks and wait for the market to offer more cost-effective opportunities.

Gold is consolidating at high levels; will it go up or down?Gold opened higher yesterday, reaching a high of around 4690. During the European and American sessions, it fluctuated between 4680 and 4660 for an extended period. However, it rallied again at the open today, currently maintaining a strong upward trend, reaching a high of around 4751. The short-term bullish momentum is unstoppable, driven by safe-haven demand, potentially leading to a capital inflow into the market. News is significantly positive for gold, and the current trend is entirely bullish, with all indicators showing a bullish alignment and no signs of pullback. However, reversals often occur when prices are seemingly unassailable. Currently, gold is consolidating near its historical high, which could push it even higher. However, indicators also suggest that the short-term market is overbought. As the market approaches a frenzy, we need to remain calm and maintain a balanced perspective. The current high is around 4751, while the key support below is likely to remain in the 4700-4690 area, which is also likely to form a top-to-bottom reversal. The price broke through this level today and continued to accelerate upwards. Although the upward trend is currently intact, there is a lack of courage to continue chasing the rally. Therefore, conservative traders should choose to observe selectively, while aggressive traders can gradually try shorting with small positions. For gold, we will first try shorting around 4750-4760, with a target of around 4720-4700. If there are signs of stabilization around 4700-4690, we can continue to go long.
