XAUUSD D1 – Rebound Confirmed After 4097 Sweep?Gold is showing a very notable rebound after sweeping the sell-side liquidity below. With Middle East tensions escalating, oil prices rising, and higher inflation expectations returning, gold is once again being supported by its role as a safe-haven asset.
But the more important story is in the structure itself.
On the D1 timeframe, the market printed a strong decline from the previous highs and broke below the old bullish structure, sweeping liquidity down into the 4097 area. However, instead of continuing the breakdown, price quickly attracted dip buyers and bounced sharply. That suggests the deeper discount zone has started to attract meaningful reaction flow.
From the MMFLOW perspective, this is the kind of structure that often appears when the market completes a liquidity sweep and begins transitioning into a recovery from discount.
Macro Narrative
The current backdrop is creating a supportive environment for gold:
rising geopolitical tension is bringing safe-haven demand back
higher oil prices are increasing market sensitivity to inflation risk
firmer inflation expectations are helping gold retain its defensive appeal
That does not mean gold will move up in a straight line.
In this environment, gold can recover well when defensive flows return, but price still needs to clear important technical supply zones to confirm that this move is a recovery continuation, not just a short-term reaction after a washout.
Technical Overview
On the D1 chart, the 4394 area is now the key pivot. This is the zone price has reclaimed after the deeper sweep into 4097. If the market can hold above this level, the recovery structure may continue expanding toward the overhead liquidity clusters.
Key levels to watch:
4394 – short-term recovery pivot / structure-holding zone
4754 – intermediate resistance / buyer strength test
5129 – major upside liquidity zone if the rebound expands further
4097 – sell-side liquidity sweep / recent reaction low
Structurally, the market is currently showing a very clear sequence:
sweep the lows – reclaim the pivot – target higher liquidity
As long as price continues to hold above 4394, buyers still retain the advantage inside the current recovery phase.
IF–THEN Scenarios
📈 Bullish scenario
If gold holds above 4394 and continues attracting follow-through buying after the downside sweep, price may extend higher toward:
4754
then 5129
This scenario fits the current backdrop well:
geopolitical support + safe-haven demand + recovery from deep discount
📉 Bearish scenario
If price fails to hold 4394 and loses the pivot again, the current rebound may begin to weaken. In that case, the market could rotate back into lower liquidity and potentially retest the 4097 area to determine whether the dip-buying response is truly strong enough.
Key Levels
Support / Demand
4394 – main pivot / recovery-holding support
4097 – sell-side liquidity / recent reaction low
Resistance / Liquidity
4754 – intermediate resistance
5129 – major upside liquidity zone
Trading Insight
From the MMFLOW perspective, this is no longer the type of environment where chasing shorts at the low makes sense. What matters most now is whether price can hold the reclaimed 4394 pivot.
A market that genuinely wants to recover usually:
does not lose the pivot it just reclaimed
prints shallow pullbacks
and continues rotating into higher liquidity zones
If that continues to happen, the current rebound may not stop at being a technical bounce. It could develop into a much larger D1 recovery phase.
Do you think gold has completed its downside sweep and is now opening a recovery toward 4754–5129, or does the market still need to retest 4394–4097 before moving higher?
Goldtrading

Gold H2 Triangle Compression —Breakout or Another Liquidity TrapGold is currently compressing inside a symmetrical triangle within a broader downtrend.
Lower highs from the descending trendline continue to cap price, while higher lows suggest accumulation pressure building.
This is a classic volatility contraction phase → expansion is coming.
Middle East tensions are escalating beyond logistics → now impacting real energy supply (oil & LNG)
Long-term risk premium is being priced into energy markets
Fed held rates as expected, but tone is clearly more cautious
Powell highlighted geopolitical uncertainty + higher inflation projections
→ USD remains supported, but gold holds bid due to safe-haven demand
⚠️ This creates a conflicted macro backdrop → perfect for fakeouts.
📌 Key Levels – Clinton Style
💎 Liquidity BUY Zone: 4420 – 4400
🌸 Break Level (Triangle Resistance): 4557
🔥 SELL Zone React: 4550 – 4580
✨ Liquidity Targets: 4739 (upside) / 4420 → 4380 (downside)
🎯 Scenario (If–Then Logic)
Bullish Scenario:
If price holds above 4420 and breaks 4557,
→ Expect expansion toward 4700+ liquidity (4739)
Bearish Scenario:
If price rejects at 4550–4570 and breaks 4420,
→ Downside liquidity could be triggered toward 4380 zone
Neutral / Trap Scenario:
If price sweeps both sides of the triangle,
→ Market is likely building liquidity before a decisive macro-driven move
Do you expect a true breakout above 4557… or a liquidity sweep below 4420 first?

GOLD 1H CHART ROUTE MAP UPDATE & TRADING PLAN FOR THE WEEKHey Everyone,
Please see our 1h chart levels and targets for the coming week.
We are seeing price play between two weighted levels with a gap above at 4529 and a gap below at 4425, as support. We will need to see ema5 cross and lock on either weighted level to determine the next range.
We will see levels tested side by side until one of the weighted levels break and lock to confirm direction for the next range.
We will keep the above in mind when taking buys from dips. Our updated levels and weighted levels will allow us to track the movement down and then catch bounces up.
We will continue to buy dips using our support levels taking 20 to 40 pips. As stated before each of our level structures give 20 to 40 pip bounces, which is enough for a nice entry and exit. If you back test the levels we shared every week for the past 24 months, you can see how effectively they were used to trade with or against short/mid term swings and trends.
The swing range give bigger bounces then our weighted levels that's the difference between weighted levels and swing ranges.
BULLISH TARGET
4529
EMA5 CROSS AND LOCK ABOVE 4529 WILL OPEN THE FOLLOWING BULLISH TARGETS
4608
EMA5 CROSS AND LOCK ABOVE 4608 WILL OPEN THE FOLLOWING BULLISH TARGETS
4699
EMA5 CROSS AND LOCK ABOVE 4699 WILL OPEN THE FOLLOWING BULLISH TARGETS
4805
BEARISH TARGETS
4425
EMA5 CROSS AND LOCK BELOW 4425 WILL OPEN THE SWING RANGE
4351
4263
As always, we will keep you all updated with regular updates throughout the week and how we manage the active ideas and setups. Thank you all for your likes, comments and follows, we really appreciate it!
Mr Gold
GoldViewFX

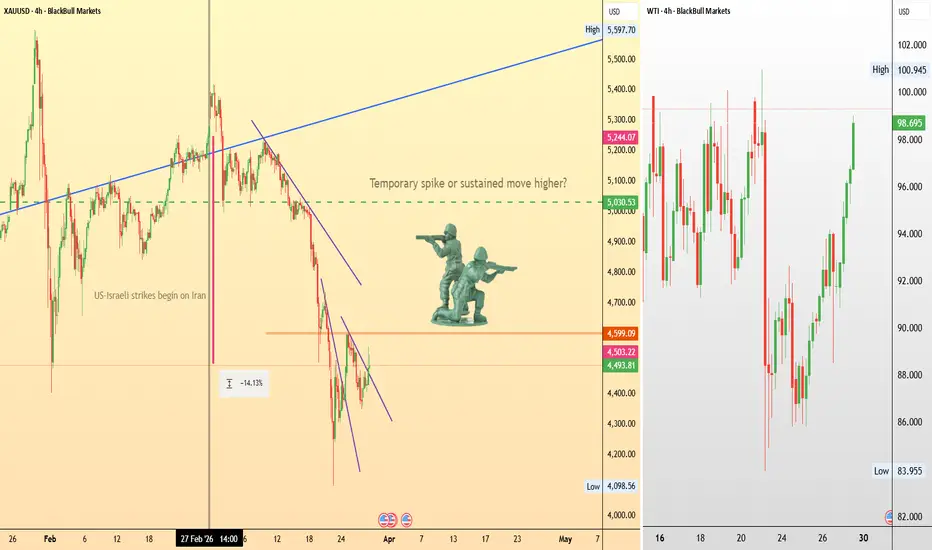
Will a ground invasion finally move gold?From a technical perspective, gold is currently in a clear short-term downtrend following the initial geopolitical spike. Gold appears to be waiting for a stronger catalyst.
Are ground troops what gold needs to start moving upward?
Iran has claimed it could mobilise more than 1 million troops to counter what it describes as a “suicidal” U.S. ground war on Iranian soil.
The United States has deployed approximately 5,000 Marines from bases in Japan and California, alongside 2,000 personnel from the elite 82nd Airborne Division. In addition, the USS Tripoli has just arrived carrying a further 3,500 troops.
Although, diplomatic efforts are apparently still active. Talks between the U.S. and Iran are expected to take place in Pakistan in the coming days.
The key level to watch is around $4,600, which is now acting as a potential resistance.
The key trading question around any ground troop invasion announcement is whether gold would deliver only a brief spike on the news or begin a more sustained move higher.
Gold M45–Market Waiting for News Catalyst: Breakout or Fake MoveGold is currently compressing inside a rising channel on M45 while sitting right ahead of key macro catalysts tonight.
The real question:
• Price is respecting a rising channel structure → short-term bullish bias intact
• Currently holding above support zone 4503 → key demand inside channel
• Market forming higher lows → accumulation behavior
• Price approaching mid-channel equilibrium → decision zone
Key Levels:
🟡 Support: 4503
📊 Intraday Pivot: 4585
🎯 Resistance: 4639
✨ Expansion Target: 4703
🌍 Macro & News Context (Tonight)
Market focus is on USD high-impact data (NFP cycle proximity + labor data signals) and geopolitical backdrop:
• Middle East tensions still elevated → supports gold (safe haven)
• USD remains sensitive to labor market data
• Yields volatile → short-term pressure vs long-term support for gold
→ Environment = volatility + liquidity-driven moves
🎯 Trading Scenarios (If–Then Logic)
🟢 Scenario 1 – Bullish Continuation
If price holds above 4503 and reacts positively after news:
→ Expect continuation inside channel
→ Targets: 4585 → 4639 → 4703
✔️ Confirms: buyers defending structure + continuation phase
🔴 Scenario 2 – Fake Break / Liquidity Trap
If price spikes above 4639 but fails to hold:
→ Possible buy-side liquidity sweep
→ Reversal back to: 4585 → 4503
✔️ Classic news-driven fake breakout
🔻 Scenario 3 – Bearish Breakdown
If price loses 4503 cleanly after news:
→ Structure breakdown
→ Deeper liquidity rotation below channel
⚖️ Market Insight
This is not a clean trend environment.
This is a liquidity environment around news.
👉 The first move after news is often the trap.
👉 The real move comes after liquidity is taken.
Comment your bias 👇

Gold Holds 4510 — Breakout Building or Bull Trap Ahead?Gold is starting to look more constructive today after defending the 4510 support base and pushing back higher inside an ascending intraday structure. The rebound is not random. Price is reacting from a clean confluence zone where trend support, prior structure, and retracement logic all meet — and that is why this area matters.
From a technical point of view, the market is now trying to transition from correction into expansion. Buyers have managed to protect the recent lows, and as long as price remains above 4510, the short-term structure continues to favor recovery rather than immediate weakness. What I find important here is that the market is no longer reacting impulsively from the downside. It is beginning to build higher lows, and that usually tells us momentum is shifting, even if the larger trend still needs confirmation.
The next area to watch is the resistance band above current price, especially around 4620–4650. This is the first zone where upside momentum may slow and where the market will reveal whether this move has enough strength to continue. If buyers can keep control through that area, the next upside path opens toward 4693 and potentially 4796, which are the higher expansion targets shown on the chart.
That said, I would still stay measured here. Gold has improved technically, but it has not completely escaped the risk of a failed recovery. If price loses 4510, the current bullish structure weakens quickly and the move starts to look more like a temporary squeeze than a sustainable leg higher.
So for today, my view is simple:
as long as 4510 holds, I still favor the upside path and a continuation into higher resistance. But the real confirmation comes only if price can keep building above resistance instead of rejecting back into the range.
For now, gold is no longer trading like a market under immediate pressure.
It is trading like a market trying to recover — and today will show whether that recovery has real depth.

Gold Market OverviewGold has had one of the most remarkable runs in recent memory — and 2026 has already proven that the story is far from over. Whether you are a seasoned trader or just beginning to understand precious metals, this overview breaks down what is driving the gold market right now and what it means for your approach.
Where Gold Stands Today
As of March 30, 2026, gold is currently trading around $4,533 per ounce. That figure tells only part of the story. Gold began the year at $4,384 on January 2 and surged to a record high of $5,589 on January 28 — before experiencing significant volatility throughout February and into Q1.
For traders, this kind of range — over $1,400 within a single quarter — is both an opportunity and a warning. It demands respect for risk management above all else.
What Is Actually Driving This Market
Understanding gold requires understanding its demand drivers — and right now there are several working simultaneously.
Central Bank Buying
This is the most structurally significant force in the gold market right now. China's central bank extended its gold purchases for a fifteenth consecutive month in January 2026, with official sector demand remaining a key structural support. This is not speculative activity — it is long-term strategic allocation by sovereign institutions, and it creates a persistent demand floor beneath price.
For the first time since 1996, gold now accounts for a larger share of central bank reserves than US Treasuries — a powerful signal of confidence in the metal's long-term value. When the institutions responsible for managing national wealth shift their allocation this significantly, it is worth paying attention.
The Dollar and Interest Rate Relationship
Gold and the US dollar have a well-established inverse relationship — when the dollar weakens, gold typically strengthens, and vice versa. Interest rates add another layer. Lower yields make it easier for non-yielding assets like gold to compete, and historically gold prices have risen around 6% on average in the 60 days following the start of a Fed rate-cutting cycle.
Markets have priced in a higher probability of three Fed rate cuts in 2026, up from two just a week prior — driven by soft US economic data including retail sales falling short of forecasts. For gold traders, Fed policy expectations are not background noise — they are a primary price driver.
Geopolitical Risk Premium
Geopolitical risks continue to underpin safe-haven demand, with tensions between the US and Iran persisting despite tentative diplomatic progress. Gold has historically absorbed uncertainty — and the current global environment is generating significant uncertainty across multiple fronts simultaneously.
ETF Flows
Institutional and retail investor participation through gold-backed ETFs adds an important layer of demand. In the third quarter of 2025, investor and central bank gold demand totaled around 980 tones — over 50% higher than the average over the previous four quarters. That kind of demand acceleration does not reverse overnight.
The Current Technical Picture
Since mid-March 2026, gold has fallen significantly from its highs. Technical indicators are currently showing bearish signals — a Dark Cloud Cover pattern formed in the $5,597 to $4,954 range, followed by a Bearish Engulfing pattern indicating strengthening downward momentum. The MACD has crossed the zero line from above into negative territory, and the RSI continues to decline with values around 47.
For traders this is important context. The longer-term structural story may remain bullish — but the short-term technical picture is suggesting caution. These two things are not contradictory. Strong fundamental narratives and bearish short-term technicals can coexist, and navigating that tension is precisely the skill that separates disciplined traders from reactive ones.
Key support to watch sits around the $4,300 level, with the $4,492 to $4,456 range currently acting as resistance.
What the Analysts Are Saying
The range of institutional forecasts for gold in 2026 is unusually wide — which itself tells you something about the level of uncertainty in the market.
On the bullish side, Wells Fargo has lifted its year-end 2026 gold target to $6,100 to $6,300 per ounce, while Deutsche Bank reiterated its $6,000 target, and UBS sees potential upside to $7,200 in an extreme scenario.
More conservative voices exist too. Bank of America predicts gold will remain around $5,000, while HSBC and Commerzbank expect gold to average in the mid to high $4,000s.
Ed Yardeni of Yardeni Research has lowered his year-end 2026 forecast from $6,000 to $5,000, while maintaining a longer-term target of $10,000 per ounce by the end of the decade.
The spread between these forecasts — from conservative to extreme bull case — reflects genuine disagreement about how durable the structural drivers are. That disagreement is the market. Your job as a trader is not to pick the right analyst but to manage your position according to what price is actually doing.
Three Things Every Gold Trader Should Understand
Gold is not just an inflation hedge anymore. The drivers have broadened significantly. Central bank de-dollarization strategies, geopolitical risk premiums, and ETF flow dynamics all influence price — sometimes independently of inflation data. Traders who reduce gold to a simple inflation story will miss important signals.
Volatility is structural right now. Gold traded in a range of $4,100 to nearly $5,600 in Q1 2026 alone. That is not a market for oversized positions or weak stop placements. Position sizing and risk management are not optional considerations — they are the difference between surviving the volatility and being eliminated by it.
The longer-term trend and the short-term setup are different conversations. Bullish fundamentals do not prevent sharp corrections. The January 2026 selloff erased significant gains in hours. Traders who conflate the macro story with their entry timing are taking on risk they may not fully appreciate.
Key Levels to Watch
For traders actively monitoring gold right now, these are the levels worth having on your chart:
Current price sits around $4,533. Resistance is concentrated in the $4,456 to $4,492 zone. Support to the downside sits around $4,300 — a level that multiple analysts reference as significant. Above, the $5,000 level remains psychologically important and represents a meaningful recovery target if bullish momentum reasserts itself.
Final Thought
Gold's structural story — central bank buying, dollar weakness expectations, geopolitical uncertainty, and ETF demand — remains largely intact. But the short-term technical picture is showing real bearish momentum following January's extreme highs.
The most useful position for any trader right now is not one of conviction about where gold is going — it is one of clarity about what price is actually doing. Watch the levels. Respect the technicals. Let structure guide your timing rather than the macro narrative.

Gold Reclaims Support, but Supply Still Sits OverheadGold is trying to stabilise after the recent decline, with price now reacting from the lower demand region and pushing back into short-term recovery mode.
The rebound is technically valid for now, but the broader structure still shows overhead pressure, which means buyers need stronger follow-through before this turns into a cleaner reversal.
Trend Pulse
The chart shows that gold has already defended the lower base and is now rotating higher from the 4,388 - 4,444 reaction zone.
This is important because the market is no longer trading in straight-line weakness.
Price is building a recovery leg, but it is still moving under a descending channel, and that keeps the upside in a controlled corrective phase for now.
As long as gold stays above the lower buy zones, the rebound structure remains active.
Key Price Territories
The chart gives a clear roadmap for the coming sessions:
Primary buy zone: 4,388 - 4,384
Secondary buy zone: 4,448 - 4,444
First sell zone: 4,536 - 4,530
Higher sell zone: 4,560 - 4,565
The market is currently pushing into resistance, so the first real decision area sits around 4,530 - 4,565.
If price is rejected there, gold may rotate back into the lower buy zones before attempting another move.
If buyers manage to absorb supply and reclaim that area properly, the recovery can extend further.
Structure Read
This is not yet a fully bullish chart.
The rebound is constructive, but it is still happening beneath a descending structure.
That means the move higher should still be treated as a recovery leg unless price can start closing above the upper supply layers.
In simple terms:
support is reacting well
rebound is building
but resistance still controls the next major decision
That keeps the market in a recovery-versus-rejection phase rather than a confirmed trend reversal.
Fundamental Layer
From a broader perspective, gold remains sensitive to three drivers here:
shifts in dollar strength
bond yield expectations
geopolitical uncertainty
If the market sees softer risk sentiment or renewed macro stress, gold can continue attracting defensive demand and support the rebound from current levels.
But if the dollar firms again or yields stay elevated, upside may struggle and rallies into resistance can still face selling pressure.
That fits the current chart well: the technical rebound is real, but the broader environment still allows for hesitation near supply.
Jasper’s Take
Gold is recovering from a key lower demand zone, and the structure supports more upside while price holds above 4,388 - 4,444.
Still, the market is approaching a layered resistance band, so buyers need to prove they can push through supply before the structure turns stronger.
Buy zone: 4,388 - 4,384
Support retest zone: 4,448 - 4,444
Resistance: 4,536 - 4,530
Higher supply: 4,560 - 4,565
The clean read here is simple:
gold is in recovery mode, but the next move will depend on whether buyers can clear supply or get pulled back into demand for another base-building phase.

GOLD 4H CHART ROUTE MAP UPDATE & TRADING PLAN FOR THE WEEKHey Everyone,
Please see our 4h chart route map and trading plan for the week ahead.
We are now seeing price play between two weighted levels with a gap above at 4592 and a gap below at 4434. We will need to see ema5 cross and lock on either weighted level to determine the next range.
We will see levels tested side by side until one of the weighted levels break and lock to confirm direction for the next range.
We will keep the above in mind when taking buys from dips. Our updated levels and weighted levels will allow us to track the movement down and then catch bounces up.
We will continue to buy dips using our support levels taking 20 to 40 pips. As stated before each of our level structures give 20 to 40 pip bounces, which is enough for a nice entry and exit. If you back test the levels we shared every week for the past 24 months, you can see how effectively they were used to trade with or against short/mid term swings and trends.
The swing range give bigger bounces then our weighted levels that's the difference between weighted levels and swing ranges.
BULLISH TARGET
4592
EMA5 CROSS AND LOCK ABOVE 4592 WILL OPEN THE FOLLOWING BULLISH TARGET
4700
EMA5 CROSS AND LOCK ABOVE 4700 WILL OPEN THE FOLLOWING BULLISH TARGET
4868
EMA5 CROSS AND LOCK ABOVE 4868 WILL OPEN THE FOLLOWING BULLISH TARGET
4973
BEARISH TARGET
4434
EMA5 CROSS AND LOCK BELOW 4434 WILL OPEN THE FOLLOWING BEARISH TARGET
4330
EMA5 CROSS AND LOCK BELOW 4330 WILL OPEN THE SWING RANGE
4212
4082
EMA5 CROSS AND LOCK BELOW 4082 WILL OPEN THE SECONDARY SWING RANGE
3950
3828
As always, we will keep you all updated with regular updates throughout the week and how we manage the active ideas and setups. Thank you all for your likes, comments and follows, we really appreciate it!
Mr Gold
GoldViewFX

XAUUSD Building Momentum for Higher LevelsAfter a strong impulsive move to the upside, gold is now entering a consolidation phase within a key structural zone. Importantly, the broader trend remains intact, and current price action suggests a potential continuation higher as long as support levels hold.
🔍 Market Context
Price has been moving inside a well-defined ascending channel, consistently forming higher highs and higher lows. Following the recent breakout toward the 4,60x area, the market did not continue immediately but instead shifted into sideways consolidation.
This behavior indicates:
Buying pressure is still present but being absorbed by profit-taking
The market is building liquidity before the next directional move
📌 Key Levels to Watch
4,675 – 4,680: Major resistance / expansion target
4,603: Near-term supply zone – recent reaction level
4,514: Mid-range support – short-term structural pivot
4,450: Strong demand zone – key downside support
📊 Price Scenarios
🟢 Bullish Scenario (Preferred)
Price holds above 4,514
A new higher low is formed
→ This opens the path for a move back to 4,603, and if price breaks above:
→ The next target lies at 4,675
👉 This scenario aligns with the prevailing uptrend and remains the higher-probability path.
🔄 Deeper Pullback Scenario
If price loses the 4,514 level, short-term structure weakens
Price may sweep liquidity toward 4,450
👉 However, a strong reaction from this zone could create a higher low and reinforce the broader bullish trend.
⚡ Strategic Outlook
Trend: Bullish
Current phase: Consolidation / accumulation
Bias: Buy on support or confirmed breakout
🧠 Conclusion
The market is currently compressing after a strong rally. As long as price remains above the 4,514 zone, the bullish structure stays valid.
A clean breakout above 4,603 would likely confirm the next expansion phase toward 4,675.

GOLD DAILY CHART MARKET ANALYSISHi everyone,
Please review our latest daily chart idea, featuring our unique Goldturn ascending channel.
We are currently seeing price test the channel floor, with a wick filling the gap down to 4128 before moving back inside the channel. A confirmed structure break to the downside would require either an EMA5 lock or a strong body close outside the channel.
Otherwise, we are expecting a move back up toward 4587. A sustained close above this level would open the path into the upper Goldturn zones.
This is the beauty of our Goldturn channels, which we draw in our unique way, using averages rather than price. This enables us to identify fake-outs and breakouts clearly, as minimal noise in the way our channels are drawn.
We will keep you all updated as the setup develops.
Mr Gold

Gold Retest Fails While Oil Surges —Safe Haven or Liquidity TrapGold is showing a recovery attempt after rejecting the trendline…
but with oil exploding and equities dumping, the real question is:
👉 Is gold lagging… or preparing for a delayed expansion?
Macro Narrative 🌍
This week’s price action is heavily driven by geopolitical escalation:
• Middle East tensions are intensifying as US military presence expands
• Iran-backed Houthi forces are actively involved → risk of prolonged conflict
• Brent oil surged above $116 (+3.4%), signaling inflation pressure
• Asian equities dropped sharply (Japan/Korea -4%+, MSCI Asia -2.4%)
• US futures & EU futures both declining → risk-off sentiment rising
• US Treasuries bid → capital shifting into safety
📊 Interpretation:
This is a classic risk-off environment
→ Normally bullish for gold
⚠️ But gold is not rallying aggressively
→ Suggests liquidity repositioning or delayed reaction
Technical Overview (H1) 📊
• Price is still trading inside a broader range
• Clear descending trendline acting as dynamic resistance
• Recent move = trendline retest + rejection
• No confirmed bullish structure shift yet
📉 Current structure:
→ Lower highs still respected
→ Market remains in corrective / distribution phase
Key Levels 🎯
🟡 Resistance / Trendline: 4418
📊 Current Price Zone: ~4505
🛡️ Liquidity Sweep Low: 4310
✨ Upside Target: 4600
Scenario 1 — Bearish Continuation 🔻
If price fails to reclaim 4418 trendline, then:
→ Expect continuation lower
→ Liquidity target: 4310
📉 Path:
4500 → 4418 rejection → 4310
⚠️ Confirms:
Market still distributing despite macro risk
Scenario 2 — Bullish Reversal 📈
If price breaks and holds above trendline (4418):
→ Market may shift structure
→ Buyers step in aggressively
📈 Path:
4450 → 4500 → 4600
⚠️ Confirms:
Gold finally reacting to geopolitical risk
Market Debate ⚖️
We are in a paradox:
• Oil ↑
• War risk ↑
• Stocks ↓

Gold consolidates around 4580 — correction likely if 4550 breaks📊 Market overview:
• Gold is currently trading around 4,570 USD/ounce, after rebounding and repeatedly testing the 4,600 resistance, but still failing to break it decisively.
• The upward momentum comes from safe-haven demand and expectations that the Federal Reserve may pause rate hikes. However, the strong US dollar is still creating volatility and increases the chance of a short-term correction.
📉 Technical analysis:
Key resistance:
• 4,600 – 4,620
• 4,680 – 4,700
Nearest support:
• 4,550 – 4,540
• 4,500 – 4,480
EMA:
Price remains above EMA 09 on M15–H1, indicating the short-term trend is still bullish but gradually weakening.
Candlestick / Volume / Momentum:
• Multiple upper-wick candles near 4,600 → showing strong selling pressure.
• Volume declining after the rally → sign of sideways consolidation.
• Momentum slowing → the market may experience a technical pullback before choosing the next direction.
📌 Outlook:
Gold could see a short-term correction if price breaks below 4,550, with a high probability of retesting 4,500.
On the other hand, if H1 closes above 4,620, the uptrend may continue toward higher levels.
💡 Suggested trading strategy:
🔻 SELL XAU/USD: 4,617 – 4,620
🎯 TP: 40 / 80 / 200 / 300 / 500 pips
❌ SL: 4,624
🔺 BUY XAU/USD: 4,500 – 4,497
🎯 TP: 40 / 80 / 200 / 300 / 500 pips
❌ SL: 4,493

Gold Retest Fails While Oil Surges —Safe Haven or Liquidity TrapGold is showing a recovery attempt after rejecting the trendline…
but with oil exploding and equities dumping, the real question is:
👉 Is gold lagging… or preparing for a delayed expansion?
Macro Narrative 🌍
This week’s price action is heavily driven by geopolitical escalation:
• Middle East tensions are intensifying as US military presence expands
• Iran-backed Houthi forces are actively involved → risk of prolonged conflict
• Brent oil surged above $116 (+3.4%), signaling inflation pressure
• Asian equities dropped sharply (Japan/Korea -4%+, MSCI Asia -2.4%)
• US futures & EU futures both declining → risk-off sentiment rising
• US Treasuries bid → capital shifting into safety
📊 Interpretation:
This is a classic risk-off environment
→ Normally bullish for gold
⚠️ But gold is not rallying aggressively
→ Suggests liquidity repositioning or delayed reaction
Technical Overview (H1) 📊
• Price is still trading inside a broader range
• Clear descending trendline acting as dynamic resistance
• Recent move = trendline retest + rejection
• No confirmed bullish structure shift yet
📉 Current structure:
→ Lower highs still respected
→ Market remains in corrective / distribution phase
Key Levels 🎯
🟡 Resistance / Trendline: 4418
📊 Current Price Zone: ~4505
🛡️ Liquidity Sweep Low: 4310
✨ Upside Target: 4600
Scenario 1 — Bearish Continuation 🔻
If price fails to reclaim 4418 trendline, then:
→ Expect continuation lower
→ Liquidity target: 4310
📉 Path:
4500 → 4418 rejection → 4310
⚠️ Confirms:
Market still distributing despite macro risk
Scenario 2 — Bullish Reversal 📈
If price breaks and holds above trendline (4418):
→ Market may shift structure
→ Buyers step in aggressively
📈 Path:
4450 → 4500 → 4600
⚠️ Confirms:
Gold finally reacting to geopolitical risk
Market Debate ⚖️
We are in a paradox:
• Oil ↑
• War risk ↑
• Stocks ↓

XAUUSD Analysis todayHello traders, this is a complete multiple timeframe analysis of this pair. We see could find significant trading opportunities as per analysis upon price action confirmation we may take this trade. Smash the like button if you find value in this analysis and drop a comment if you have any questions or let me know which pair to cover in my next analysis.

Gold H2 Range Holds — Breakout Coming or Liquidity Trap?Gold H2 Range Holds — Breakout Coming or Liquidity Trap? ⚠️
Gold is still trapped inside a wide H2 range…
but volatility is building fast.
• Middle East tensions continue escalating → supports safe-haven demand
• Oil prices remain elevated → inflation pressure persists
• USD holding relatively strong → caps gold upside
• Bond yields remain volatile → creating choppy conditions
📊 Interpretation:
We are in a mixed macro environment
→ High volatility + liquidity-driven moves
→ Breakouts more likely to fake before expanding
Technical Overview (H2) 📊
• Price is consolidating inside a clear range
• No confirmed higher high yet → structure still neutral
• Repeated rejections from upper range
• Liquidity building on both sides
📉 Current state:
→ Range-bound accumulation / distribution phase
Key Levels 🎯
🟡 Range High / Liquidity: 4619
📊 Current Price: ~4560
🛡 Mid Support: 4416
🔻 Range Low / Liquidity: 4354
✨ Expansion Target: 4733
Scenario 1 — Bullish Expansion 📈
If price holds above 4416 and breaks 4619:
→ Liquidity sweep → breakout continuation
📈 Path:
4560 → 4619 → 4733
⚠️ Confirms:
Accumulation → expansion phase
Scenario 2 — Bearish Rotation 📉
If price fails to hold 4416:
→ Range breakdown → deeper liquidity grab
📉 Path:
4560 → 4416 → 4354
⚠️ Confirms:
Distribution → downside continuation
Market Debate ⚖️
Gold is not trending — it’s compressing.
That’s where most traders get trapped.
So the real question:
Is smart money accumulating for a breakout…
or distributing before another leg down?

XAUUSD Analysis todayHello traders, this is a complete multiple timeframe analysis of this pair. We see could find significant trading opportunities as per analysis upon price action confirmation we may take this trade. Smash the like button if you find value in this analysis and drop a comment if you have any questions or let me know which pair to cover in my next analysis.

XAUUSD Range Breakout with Bearish Target SetupGold is showing a clear structural shift after multiple Break of Structure (BOS) confirmations, indicating a transition from consolidation into a trending phase.
After forming a descending channel, price broke out aggressively and created a tight range accumulation zone, signaling indecision before expansion. This range was eventually broken to the upside, leading into a key resistance area.
Currently, price is reacting from this resistance zone, suggesting a potential rejection. If sellers step in, we can expect a move toward the marked target zone around 4422, which aligns with previous structure and liquidity.
Key Confluences:
Multiple BOS confirming market structure shifts
Range formation → breakout continuation pattern
Strong resistance zone rejection
Clean downside target aligned with structure
Trade Idea:
Look for bearish confirmation near resistance
Target: 4422 zone
Invalidation: Sustained break above resistance
⚠️ Wait for confirmation before entering. Manage risk properly.

Weekly Plan Rebound Building, But the Bigger Trend Still DecidesGold is entering the new week with a stronger rebound after the recent heavy selloff, but the broader structure is still not fully repaired.
The market has reacted well from the lower support zone, yet price is still trading under a clear resistance ladder that could easily slow the recovery.
From a technical perspective, the short-term bounce is becoming more visible, but the larger flow still looks like a corrective rebound inside a broader bearish trend. The first key support sits around 4430, while the lower demand zone remains around 4338–4245. As long as these areas hold, buyers still have room to push higher.
On the upside, the next major resistance levels are 4714, 4837, 4999, and 5110. These are the zones that matter most next week. If gold continues to recover, price may climb into these areas step by step. However, unless buyers can break and hold above them, the rebound may still be treated as a temporary recovery rather than a confirmed reversal.
So the structure for the week ahead is quite clear.
If gold holds above 4430, the rebound can continue toward 4714 first, with 4837 as the next important upside reaction zone. A stronger extension could even expose 4999 and higher. But if price starts rejecting from those upper levels, sellers may return and push the market back into the broader downtrend.
On the other hand, if gold fails to hold current support and loses 4430, the focus shifts back to 4338 and 4245. A breakdown there would weaken the recovery structure and suggest the recent bounce was only a pause before another bearish leg.
For now, gold is showing a better short-term tone, but next week is likely to be all about how price reacts at resistance.
The key question is simple:
Is gold building a real recovery for the new week — or just bouncing into the next sell zone?

Gold: Spotting Higher Lows Before the Move UpToday’s price action on gold gave us a clean example of something many traders overlook: higher lows forming inside a bearish trend, often an early clue that momentum is shifting.
At first glance, the market looked weak and continuation down seemed likely. But if you zoom in and read price structure carefully, you’ll sometimes notice a subtle change:
Sellers are still pushing price down…But each pullback fails to make a lower low and instead, price starts forming higher lows
This is important because it tells us:
Sellers are losing strength
Buyers are quietly stepping in earlier each time
The market is preparing for a potential shift in direction
What to look for:
A clear bearish trend (lower highs & lower lows)
A break in that structure and price fails to make a new low
Consecutive higher lows forming
Compression or tightening price action
A breakout or strong bullish push following this buildup
This doesn’t mean you blindly buy but it alerts you to a change in order flow.
In today’s case, while many expected continuation down, the formation of higher lows gave us the edge. We anticipated the shift and the move up played out exactly as the structure suggested.
Key takeaway: Trends don’t reverse randomly, they transition. Higher lows in a bearish trend are often the first sign.
Stay patient, trust structure, and let price tell the story.
Mr Gold

GOLD DAILY CHART MARKET ANALYSISHey everyone,
Here’s our updated daily chart outlook for Gold.
After breaking the channel half line, we saw price move into the lower Goldturns, with key levels being tested and confirmed by strong body closes. We’ve now closed below 4586, leaving a gap down toward 4425.
At this stage, we expect a reaction around this area, potentially leading to a bounce back toward 4586. If price closes above 4586, we’ll likely see a retest of the channel bottom acting as resistance. A confirmed break above that level would reopen the higher channel targets.
On the downside, a close below current levels would open the path toward 4260. An EMA 5 cross and lock would provide stronger confirmation of continued bearish momentum.
This is the beauty of our Goldturn channels, which we draw in our unique way, using averages rather than price. This enables us to identify fake-outs and breakouts clearly, as minimal noise in the way our channels are drawn.
We will keep you all updated.
Mr Gold

XAU/USD | Gold Reacts From Demand, Can Bulls Take Control Again?By analyzing the #Gold chart on the 4H timeframe , we can see that price continued to follow the expected scenario and moved lower, successfully reaching the $4410 level. From this key demand zone, strong buying pressure stepped in once again.
Following this reaction, Gold quickly filled the previously marked FVG, confirming that the market is efficiently rebalancing after the aggressive move. Currently, Gold is trading around the $4444 region, showing early signs of stabilization after the demand reaction.
At this stage, the $4350 – $4440 demand zone becomes the key structural support. As long as price manages to hold and stabilize above this area, the probability of further upside recovery increases.
Supply Zones to watch:
$4500 – $4550
$4640 – $4740
Demand Zones:
$4350 – $4440
$4200 – $4280
If buyers maintain control, the next short-term upside targets are $4475, followed by $4500, then $4530, and potentially $4580 in case of continued bullish momentum.
Please support me with your likes and comments to motivate me to share more analysis with you and share your opinion about the possible trend of this chart with me !
Best Regards , Arman Shaban

Gold Rebounds, But Sell-on-Rally Still Dominates Gold Rebounds, But Sell-on-Rally Still Dominates
Gold is holding above the 4,400 zone after taking support near 4,350, but the overall structure is still not looking convincingly bullish.
The recent bounce shows that buyers are trying to defend the lower area. Even so, price is still moving within a weak broader setup. Unless gold manages to move above the next resistance band with strength, this rebound may continue to behave like a corrective rise rather than a proper trend reversal.
Levels to watch:
Support: 4,340 - 4,400
Current reaction zone: 4,440 - 4,460
Retest resistance: 4,540 - 4,580
Higher supply zone: 5,150 - 5,200
From the broader side, geopolitical tension is still giving some support to safe-haven demand, which is helping gold stay firm after the recent drop. At the same time, risk-off sentiment is also keeping the dollar supported, and that is limiting the upside follow-through in gold.
For now, the market looks to be in a recovery phase, not a confirmed reversal phase. If price starts facing rejection again near 4,540 - 4,580, the sell-on-rally view remains intact. A stronger shift in structure will only come if buyers reclaim resistance with clear acceptance.
Jasper’s view: gold can continue its short-term recovery, but unless the market clears resistance properly, rallies may still attract fresh selling pressure.
