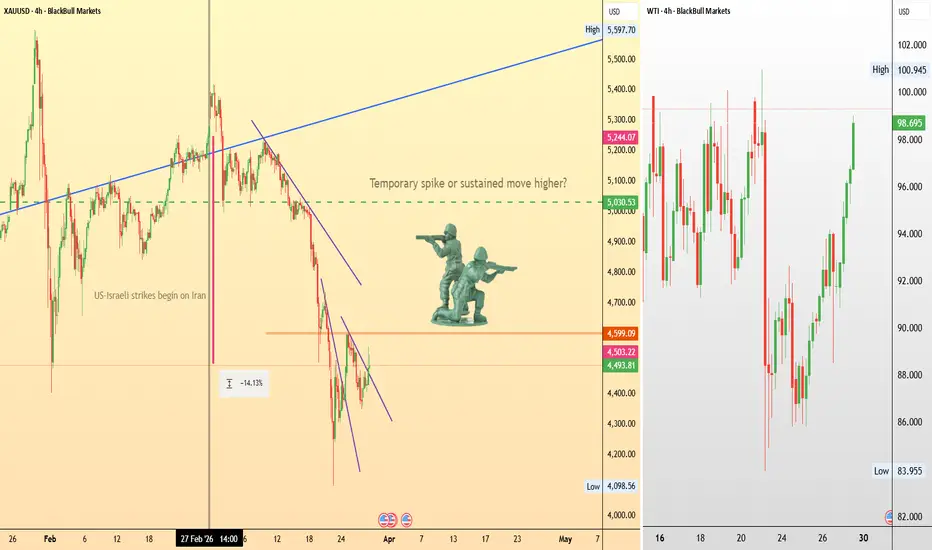
Will a ground invasion finally move gold?From a technical perspective, gold is currently in a clear short-term downtrend following the initial geopolitical spike. Gold appears to be waiting for a stronger catalyst.
Are ground troops what gold needs to start moving upward?
Iran has claimed it could mobilise more than 1 million troops to counter what it describes as a “suicidal” U.S. ground war on Iranian soil.
The United States has deployed approximately 5,000 Marines from bases in Japan and California, alongside 2,000 personnel from the elite 82nd Airborne Division. In addition, the USS Tripoli has just arrived carrying a further 3,500 troops.
Although, diplomatic efforts are apparently still active. Talks between the U.S. and Iran are expected to take place in Pakistan in the coming days.
The key level to watch is around $4,600, which is now acting as a potential resistance.
The key trading question around any ground troop invasion announcement is whether gold would deliver only a brief spike on the news or begin a more sustained move higher.
Iran
100K oil barrels vanishing every 10 minutes Nearly all market moves are being driven by the war with Iran at this point.
Aluminium moved close to price levels not seen since 2022 after Iranian attacks on two Middle Eastern producers.
Brent is on pace for its biggest monthly surge on record, while our spreads remain stable.
U.S. President Donald Trump said on Monday that the U.S. will “completely” obliterate Iran’s Kharg Island if the Strait of Hormuz is not “immediately” reopened.
The amount of oil supply being lost every 10 minutes is 100,000 barrels due to the closure of the strait.
Countries around the world are now starting to implement emergency measures, which means oil is becoming even more acutely central to both inflation expectations and growth. FX pairs and gold should also be watched closely as key reflections of this shift.

Volatility Remains Low Against the Backdrop of Falling MarketsIn spite of the recent loss of support in the QQQ and SPY the rise in the VIX remains underwhelming as M1 and M2 Money supply continue to rise. On the surface it seems like the money in the market is fearing the war and selling off as a result but if that were the case you'd think Commercial Banks would stop contributing to the rise in M1/M2 money supply and that downside volatility would be bid up much higher than it currently is but it simply has not done so yet. Additionally assets such as Gold and Silver which would normally rise on Geopolitical tensions such as the War and Supply Shutdowns such as what we are currently experiencing, have actually gone down significantly instead which signals to me that the money isn't behind this decline and isn't willing to bet that the Iranian conflict will have a big longer-term sustained impact on the economy.
Given that the drop we've seen in indexes do not align with the activity we've seen in the VIX nor Precious metals, it is likely that the drop in the markets was simply a liquidity event , an event in which the Commercial banks are willing to step up and provide the needed liquidity as made evident by the recent all time highs made in the M2 and acceleration in the lesser talked about M1 Money Supply.
The main difference between M1 and M2 money supply is that while both track the supply of money issued by central and commercial banks, the M1 excludes the supply held up in less liquid vehicles such as CDs or Savings Account while the M2 is a broader index that tracks everything. This essentially means M1 is a filter to track the supply of the most liquid money while M2 is an overall view.
Given that the big money does not seem to be betting on long term implications of this war as a whole I would suspect Oil to eventually come back down to the $60s to fill it's gap as well as for the VIX to come back down below $20 to fill it's gap and for markets to rise again as the newly issued liquidity makes its way through the system. With that being said BTC probably stands to rise more than the SPX once this happens and is actually holding up far better than the SPX during this time.
Easiest thing for me to do here would be to sell slightly OTM weekly Bear Call Spreads against the VIX or even better the 3x VIX ETF UVXY. Using the liquidity potentially gained from being profitable on those, one could then add more calls to BTC or SPX or just use it as a cash cushion.

OPPORTUNITYPresent markets are dynamic and volatile mainly due to consistent wars and situations created because of such war, but these geopolitical tensions and energy crisis has opened gates for new opportunities. Many stocks are now available at much lower prices. The stocks are Bajaj Finserv, Bajaj Holdings, HUL, Pidilite industries, Adani Enterprises, HDFC Bank, Procter & Gamble, Dabur, Asian Paints, Berger Paints and Page Industries. They are trading at much lower values than the all-time high values. Such stocks will give good run when situations are improved.
Please do your own analysis before investing.
Happy investing and successful trading!

USD/CAD nears ceiling as CAD fails to rally | Sell the rally?There is an anomaly playing out in the currency markets right now. With Brent oil pushing past $100 a barrel amid the geopolitical crisis in the Middle East, the oil-correlated Canadian dollar should be surging, but instead, USD/CAD is trading higher, bouncing from recent lows and approaching the 1.4000 handle.
Why is the Loonie failing to catch a bid? It comes down to interest rate differentials and safe-haven flows into the US dollar. We break down the macro divergence driving this pair and the critical technical levels capping the current rally.
Key topics covered
- Oil correlation breakdown: The Canadian dollar is failing to benefit from the massive spike in oil prices as the safe-haven dominance of the US dollar is overriding Canada's traditional tailwinds.
- Interest rate premium: This is the core driver behind the USD/CAD rally. With the Fed sitting at 3.75% and the BOC holding at 2.25%, the premium makes the US dollar more attractive to carry traders. Furthermore, Canada's soft 1.8% inflation print lowers the odds of a BOC rate hike.
- Elliott Wave structure : Following the flag breakout, the pair completed a 5-wave impulsive leg down to the 1.3485 low. We discuss whether the current bounce is just a short-term correction or the start of a broader macro reversal.
- Overbought RSI resistance : The daily RSI is near the 70 overbought level, a territory it rarely holds without a fundamental disturbance. We identify the key resistance clusters where this rally is likely to exhaust.
USD/CAD scenarios & trade plan:
- Bearish (Sell the rally) : Because momentum is stretched, the current bounce offers a prime short-term selling opportunity. The immediate resistance cluster sits at 1.3886 (the October swing low), with the line in the sand at the 1.3930 double top. A rejection here opens a downside target of 1.3750, offering a favourable risk-to-reward ratio for shorts with tight stops above the highs. If Middle East tensions de-escalate, a deeper flush could retest the 1.3485 lows.
- Bullish (Macro breakout) : For the trend to officially reverse to the upside, buyers must secure a few daily closes above the 1.3930 resistance. Breaking this level invalidates the bearish structure and opens the door for a macro run toward the 50% Fibonacci level near 1.4150.
Are you selling the USD/CAD rally or focusing on a breakout above 1.3930? Share your thoughts in the comments.
This content is not directed to residents of the EU or UK. Any opinions, news, research, analyses, prices or other information contained on this website is provided as general market commentary and does not constitute investment advice.
ThinkMarkets will not accept liability for any loss or damage including, without limitation, to any loss of profit which may arise directly or indirectly from use of or reliance on such information.

$VOO America's Index. War Discount. Two Weekly Buy Zones Plotted📊 The S&P 500 is down approximately 5% year-to-date. The Iran war drove Brent crude past $120 per barrel, spooked the Fed into holding rates, pushed the Dow to fresh 2026 lows, and triggered a rotation out of growth stocks and into defensives.
VOO, which tracks every single one of those 500 companies, is sitting at a weekly demand zone with two clean entries mapped.
History is unambiguous on this. The S&P 500 has delivered a compound annual return of 10.6% since its inception in 1957. Every major geopolitical shock in that period, wars, oil embargoes, financial crises, pandemics, produced a buying opportunity for patient investors.
The Iran war is not different. It is creating the discount.
The fundamental case for owning America's index does not change because of a conflict in the Middle East.
VOO holds 500 of the most profitable, well-capitalised companies on earth. AUM stands at $830.39 billion. Dividend yield is approximately 1.17%. Expense ratio is 0.03%. The TipRanks analyst consensus across all holdings is Moderate Buy with an implied average price target upside of approximately 27%.
The S&P 500 closed its worst week of 2026 at 6,506. Peace talks between the US and Iran are now reportedly underway with Trump ordering a five-day pause on strikes. If diplomatic momentum holds, the oil price relief will flow directly back into the growth stocks that drive VOO's performance.
The weekly chart shows price has pulled back cleanly from the $698.24 highs into two Fibonacci demand zones. The long-term uptrend channel from 2023 remains firmly intact. The red SMA 200 is curling upward as structural support beneath both buy zones.
🟢 Buy Zone 1 ($577.35 area)
First weekly demand zone and the 0.382 Fibonacci retracement of the 2024 to 2026 bull run.
Stop: $569.76 (1.318% below entry) / $980 position
Qty: 2
Risk/Reward Ratio: 15.68
Target: $698.24 (+20.935% / $1,342.71)
🟢 Buy Zone 2 ($565.94 area)
Deeper weekly demand zone at the 0.5 Fibonacci level and prior breakout shelf.
Stop: $558.33 (1.345% below entry) / $980 position
Qty: 2
Risk/Reward Ratio: 17.14
Target: $696.34 (+23.041% / $1,342.71)
Key Levels:
🔑 Current Price: $596.00
🔑 Buy Zone 1: $577.35
🔑 Stop Zone 1: $569.76
🔑 Buy Zone 2: $565.94
🔑 Stop Zone 2: $558.33
🔑 52-Week High: $698.24
🔑 AUM: $830.39B
🔑 Dividend Yield: ~1.17%
🔑 Expense Ratio: 0.03%
🔑 S&P 500 YTD: approximately -5%
🔑 S&P 500 Annual Average Since 1957: 10.6%
🎯 Target 1: $698.24 (+20.935% / $1,342.71)
🎯 Target 2: $696.34 (+23.041% / $1,342.71)
⚠️ Hard Stop Zone 1: $569.76
⚠️ Hard Stop Zone 2: $558.33
The war created the discount. History says buy it. Two weekly buy zones mapped.

Gold Pullback – Sell the Rally🧠 Context & Price Action
After breaking above 4440 yesterday, gold pushed up and retested 4600, then quickly reversed under selling pressure.
Currently, price is testing the 4400 – 4377 support zone, a key short-term decision area.
📉 Scenarios
If 4400 – 4377 breaks
→ Downside targets:
4320 → 4220 → 4100 → 4000
Extended move: 3950 – 3900 – 3800 if geopolitical tensions escalate.
🎯 Bias
Sell the rallies
Resistance zones:
4465 – 4495 | 4550 | 4600 | 4700 – 4730
👉 Break above 4730 → invalidate sell setup.
⚠️ Conclusion
Wide range market → high risk of traps.
Focus on selling at resistance, avoid mid-range trades.
🚀 If you find this useful, drop a rocket and follow me to hunt profits together!

“Peace Plan” Trading Opportunities According to a Times of Israel report, the 'gift' Iran gave the US recently was allowing an uncertain number of fuel tankers safe passage through the Strait of Hormuz.
What this might signal is Iran’s willingness to engage with the peace plan reportedly proposed by the US. This is potentially overshadowing reports that the US has deployed additional troops to the region.
Thus, oil prices are under mild pressure while stocks are responding positively.
We are still waiting for Iran to properly respond or comment on the progress of the talks. Once the situation becomes clearer, volatility in these assets might pick up and strengthen the current market momentum.

Gold Bottom or Just a Pullback?After a strong decline, gold suddenly bounced from the 4100 zone.
Not because of economic data, and not due to a confirmed shift in trend… but largely driven by market sentiment reacting to tweets and statements from Trump.
In a short time, emotions shifted.
Doubt slowly turned into expectation.
And one question started to appear more frequently:
“Has the bottom already formed?”
But the market doesn’t move based on emotions.
It moves based on structure.
🌍 Macro Context
Geopolitical tensions are showing signs of temporary easing (negotiations, calls for a ceasefire).
However, key risks — especially around the Hormuz region — still remain.
At the same time, there is no major economic data today.
Which means:
👉 Price action is currently driven mostly by technicals and market sentiment.
📉 Market Structure
If we zoom out and ignore short-term noise:
The primary trend remains: Bearish
The current move: A recovery within a short-term ascending trendline channel
A strong bounce can easily make it look like a reversal.
But until structure is broken… it’s still just a pullback.
📊 Where Are We Now?
Gold is currently trading within a very wide range:
Upper boundary: 4740
Lower boundary: 4220
Within this range, price action is mostly consolidation.
On a smaller timeframe (intraday), price is reacting between:
4350–4370 ↔ 4640
This is the key zone to watch for short-term decisions.
🧩 Key Levels to Watch
Support:
4380, 4400, 4300, 4320, 4220, 4250
Resistance:
4600, 4615, 4640, 4660, 4693, 4730
These are not just levels — they represent shifts in market psychology.
⚠️ When Does the Scenario Change?
A close above 4740 → structure shifts → SELL scenario invalidated
A close below 4220 → confirms continuation of the downtrend → targets: 4000 – 3950 – 3900
🎯 Trading Plan
In the current context, the goal is not to predict the bottom.
It’s to understand where you are within the trend.
Primary trend: bearish
Current move: pullback
➡️ Therefore:
Look for selling opportunities on rallies, not chasing buys.
🧠 Final Thought
The market often creates rallies that are strong enough to convince you a bottom is in.
But most of the time… it’s just the way it continues the existing trend.
A bottom is not confirmed by feeling.
It is confirmed by structure.
🚀 If you find this perspective useful
Drop a 🚀 and follow for more high-quality trading ideas every day.

Positioning for Trump to pull out of Iran Speaking moments ago, US President Donald Trump recently stated that Iran’s military capability is basically NIL and that the US controls Tehran's airspace. He confidently remarked, "I don’t like to say this, but we’ve won this war."
Trump also hinted at a goodwill gesture from Iran, describing it as a "present" related to oil and gas.
An Iranian source confirmed that the US initiated outreach to end the war. Trump mentioned that Vice President JD Vance and Secretary of State Marco Rubio are leading negotiations.
The announcement of a 5-day ceasefire on Monday led to a 10% fall in the price of crude. Now, imagine what a “Mission Accomplished” moment for this war could produce in crude.
WTI crude oil futures are up almost 4% on the day to around $91.5 per barrel. It has pulled back from a 5% gain that was being registered before Trumps new messages, but the market doesn't appear to be taking the bait of the war-coming-to-an-end messaging yet.

Gold looks amazing ahead of TACO (Trump always chickens out)!In a nutshell: there are three scenarios on how gold may move in the next three months. In the end of the article you'll find the final prediction, so if you are here for a "everything on one chart", scroll to the end.
The current March 2026 streak (9–10 sessions) is only the third time OANDA:XAUUSD has fallen 10+ days in a row since free trading began:
September 1996 — the earliest recorded 10+ day streak. Gold was trading around $380–390 in a long-term bear market (strong dollar, booming equities, low inflation).
November 2015 — 9 consecutive down days, from ~$1,183 to ~$1,085. Roughly a 7% decline (~$80–90). Driven by dollar strength, anticipated Fed rate hikes, and disappointing Chinese gold reserve data.
March 2026 (current) — 9–10 consecutive sessions down, from ~$5,220 to $4,100. Over 20% decline, far exceeding previous streaks in both absolute and percentage terms. Driven by the Iran war pushing oil above $110, hawkish Fed hold, surging Treasury yields, and a stronger dollar.
The 2026 streak is historically unprecedented in magnitude — previous 10-day streaks produced single-digit percentage losses, while this one has already erased over 20% from the January ATH of $5,594.
There are, of course, many ways in which everything may go wrong. The status-quo (if the current dynamics may be called like that) is Trump trying to push everyone into believing he has the situation under control. Yet, his "Art of the Deal" techniques proved to be completely useless in resolving the Hormuz crisis.
Here are several scenarios of how the gold may act in the next 3 months.
Scenario A: Quick deal — ceasefire by mid-April
Probability: ~30% · End-June range: $4,800–5,200
Trump's 5-day strike pause extends into a framework deal via Oman/Turkey mediation. Key terms: Iran agrees to verifiable nuclear downgrade, Hormuz reopens, hostilities wind down — resembling the Twelve-Day War ceasefire from June 2025. The probability is capped at 20% because Iran categorically denies negotiations, Hormuz is physically mined (demining takes weeks even after a deal), and Netanyahu continues strikes in parallel with any talks.
A deal announcement triggers an immediate short-covering rally ($200–300 in 48 hours) and sends oil toward $80–85. The Fed holds on April 29 with a softer tone. Through May, Hormuz partially reopens, inflation expectations ease, the market prices 1–2 Fed cuts for H2, and gold grinds to $4,900–5,050 as ETF outflows reverse. By June, structural drivers (central bank demand, fiscal deficits, de-dollarization) keep gold at $4,800–5,200, with the June 18 dot plot as the final catalyst.
Scenario B: Prolonged standoff — no resolution, no escalation
Probability: ~50% (base case) · End-June gold range: $4,400–4,800
The 5-day pause produces nothing. Strikes resume at reduced intensity as Iran's arsenal depletes (500+ ballistic missiles and ~2,000 drones already fired by early March). Combat winds down through attrition, not diplomacy. Hormuz partially reopens via escorted convoys by May. Oil drifts from $100+ to $85–95. This is the base case because it requires the least from either side — no breakthroughs, no dramatic escalation. Trump claims military victory, Iran claims survival, neither makes costly concessions.
April is the roughest month — hot CPI (~3.3–3.5%) revives hike fears, gold tests its 200-day EMA around $4,200 with a possible false breakdown below $4,000 before the April 29 FOMC (which holds, but hawkishly). From May, the naval escort coalition brings oil to $88–93, Asian physical demand re-emerges at lower prices, and the hike scare fades as economic data softens. By June, weak Q1 GDP forces the June 18 FOMC to add growth-risk language — markets read it as a soft pivot, gold finishes at $4,500–4,800.
Scenario C: Escalation — Gulf infrastructure targeted, oil above $130
Probability: ~20% · End-June gold range: $4,500–5,500 (with interim low ~$3,800)
The March 28 deadline passes without progress. The US strikes Iranian power plants; Iran retaliates by fully closing Hormuz and hitting Saudi/UAE/Kuwait oil facilities. Oil spikes to $130–150, the IEA's record 400-million-barrel reserve release proves insufficient, global recession becomes consensus. Only 15% because it requires both sides to choose the most extreme option simultaneously — Trump has shown willingness to de-escalate, Iran's arsenal is depleting, and Gulf states are actively mediating to protect their own infrastructure.
In this case, gold paradoxically crashes to $3,550–3,800 in April as institutions liquidate everything to cover margin calls (the March 2020 playbook). Then the reversal — through May, central banks and sovereign wealth funds step in as physical buyers, leveraged longs are flushed, and the Fed signals emergency cuts as stagflation takes hold; gold recovers to $4,300–4,700. By June it pushes through $5,000 as the only credible hedge against simultaneous inflation, geopolitical risk, and currency debasement, finishing at $5,200–5,500.
Gold's 10-session streak is only the third since 1971 — but unlike 1996 or 2015, this one erased 20%+ in under two weeks. The magnitude is unprecedented, and so is the backdrop: an active Gulf war, a mined Hormuz, oil above $100, and a Fed caught between surging inflation and a stalling economy.
The scenarios above cover a wide range — from $3,800 to $5,500 by end of June — but they all share a common floor: current levels sit near or below every major bank's year-end target, and the structural bull case (central bank buying, fiscal deficits, de-dollarization) hasn't cracked. What has cracked is positioning and sentiment. The question is whether the market is repricing gold for a new reality or just puking out a crowded trade. The answer starts on March 28, when Trump's strike pause expires.
Below are my final projection for Gold. Share your thoughts on that, I'd like to discuss.

If 4100 Is Not the Bottom, Where Is Gold Headed Next?Trump reversed course, gold rebounded sharply — but in my view, this is still not a sign that the market has bottomed.
The market has just gone through a strong wave of panic following the 48-hour ultimatum related to the Strait of Hormuz. But less than 48 hours later, Trump’s decision to delay the planned strike on Iran eased market fears and triggered a notable rebound in gold.
From my personal perspective, this temporary de-escalation seems more like an attempt to calm the pressure from rising oil prices and inflation, rather than a real sign that the underlying risk has passed. In other words, the market is reacting to the rhetoric, but that does not necessarily mean the core story has changed.
That is why I still believe gold has not formed a bottom yet. At this stage, every rebound still looks like an opportunity to sell in line with the broader trend.
For now, price should be monitored within the H4 range, with the lower boundary at 4235 - 4240 and the upper boundary at 4496 - 4500. As long as price remains within this range, the market is still in a state of hesitation and has not yet confirmed a clear direction.
Resistance to watch: 4496 - 4500 - 4515 - 4697 - 4700 - 4735 - 4740
Support to watch: 4200 - 4235 - 4100 - 4000 - 3950
If price breaks strongly above 4740, then the sell bias should be abandoned. But for now, I still lean toward the scenario in which gold may continue correcting toward the 4000 - 3950 area, as there is still no clear sign of a confirmed bottom.
If you find this perspective useful, drop a rocket, leave your view in the comments, and follow the channel. I’ll keep updating the key levels and latest scenarios so you do not get caught off guard in this market.

Brent Oil Dropped Fast| Is the Top Already In?Over the past two to three weeks, the price of Brent Crude OIL( FX_IDC:USDBRO ) has risen due to the military conflict in the Middle East, surpassing $100 per barrel. Given the importance of the region for global oil supply, this price increase is understandable.
Now, the question is whether Brent Crude OIL can reach new all-time highs, or if it will correct again, dropping below $100—and even $80.
To begin with, any news about tensions in the Middle East or political statements can quickly affect oil prices. Thus, in the coming days, it’s crucial to manage your capital carefully, as the only tool we have for analysis right now, besides following the news, is technical analysis, which I will now try to help you deepen your understanding of.
In the one-hour timeframe, Brent Crude OIL successfully broke its support line and attempted to retest the resistance zone($147-$117) for a second time, but it failed to break through. Then, with the tweet from Trump a few minutes ago about negotiations with Iran, Brent Crude OIL fell by over -15%.
From an Elliott Wave theory perspective, it seems that oil has completed main wave 5, and we can expect downward corrective waves in the coming hours.
I expect that in the next few hours, Brent Crude OIL will begin to drop and at least fill the initial Gap($95.96-$92.88) downward, and if the decline continues, with more positive news on a ceasefire or further negotiations between Iran, the U.S., and Israel, we could see a classic Double Top Pattern form for Brent Crude OIL, which could lead to further declines in oil in the coming days.
First Target: Gap($95.96-$92.88)
Second Target: $88.00
Third Target: $82.00
Stop Loss(SL): $120.01(Worst)
Gap: $75.72-$73.08
Points may shift as the market evolves
What is your opinion on the Brent Crude OIL price trend this week?
💡 Please respect each other's opinions and express agreement or disagreement politely.
📌U.S. Dollar/Brent Crude OIL Analysis (USDBRO), 1-hour time frame.
🛑 Always set a Stop Loss(SL) for every position you open.
✅ This is just my idea; I’d love to see your thoughts too!
🔥 If you find it helpful, please BOOST this post and share it with your friends.

OIL WEAK Hi, i see setup for oil to go down.
We can see consolidation formation, and brake on downside.
At this moment we are retesting brake out.
Pay attention for short setups.
And enter according to your strategy.
IRAN - USA positive negotiations gives this idea more probability
Be safe!

USDJPY M15 Bearish Retracement from Supply Imbalance📝 Description
FX:USDJPY has experienced a sharp bearish displacement after failing to hold above the previous range highs. The market swept internal liquidity and is now retracing into a lower-timeframe Fair Value Gap, which may act as a supply zone before continuation to the downside.
________________________________________
📉 Signal / Analysis
Primary Bias: Bearish below 158.76
Preferred Setup:
• Entry: 158.56
• Stop Loss: Above 158.76
• TP1: 158.333
• TP2: 158.163
• TP3: 157.945
________________________________________
🧠 ICT & SMC Notes
• Strong bearish displacement breaking intraday structure
• Price retracing into 15M Fair Value Gap supply zone
• Liquidity resting below the recent sell-side liquidity level (SSL)
________________________________________
📌 Summary
If USDJPY remains below the 158.76 resistance area, the retracement into the FVG may provide a selling opportunity, with downside targets around 158.33–157.94.
________________________________________
🌍 Fundamental Notes / Sentiment
The decision by Donald Trump to postpone military strikes against Iranian energy infrastructure for five days temporarily reduces immediate geopolitical risk. This de-escalation may ease safe-haven demand for the dollar, allowing USDJPY to face short-term downside pressure as risk sentiment stabilizes.
________________________________________
⚠️ Risk Disclosure
Trading involves substantial risk and may result in capital loss. This analysis is for educational purposes only and does not constitute financial advice. Always apply proper risk management, predefined stop-loss levels, and disciplined position sizing aligned with your trading plan.

Gold Bullish Reversal | Targeting Buy-Side LiquidityGold has delivered a complete sell-side liquidity sweep, tapping into a key weekly SSL zone aligned with the 50% of the previous year’s range. The strong reaction from this area suggests absorption of selling pressure and a potential shift in delivery.
The prior move lower was aggressive, but it occurred through low-resistance liquidity (LRL), meaning the move lacked strong structural support. Now that price has reached higher timeframe liquidity, the market is likely to rebalance higher.
Early signs of bullish intent are visible as price rejects the lows and begins to stabilize, indicating a possible transition from bearish expansion to bullish accumulation.
Multi-Timeframe Context:
- Weekly: Price reacting from major sell-side liquidity
- Daily: Exhaustion of bearish momentum after displacement
- HTF Narrative: Liquidity objective below has been met
Current Read:
- Sell-side liquidity has been swept
- Rejection from HTF zone confirmed
- Potential shift toward bullish delivery
Trade Plan:
- Look for bullish displacement from current levels
- Enter on retracement into discount (after confirmation)
- Target buy-side liquidity / previous highs
Targets:
- Internal liquidity (mid-range inefficiencies)
- External buy-side liquidity above highs

XAUUSD BUYXAUUSD is now transitioning from a clear bearish structure into a fundamentally driven bullish move, as geopolitical tension from Trump’s announcement fuels strong safe-haven demand. Technically, price has reacted sharply from a key demand zone after an extended selloff, breaking short-term structure and reclaiming liquidity below, which suggests this is more than just a minor retracement. The impulsive bullish move indicates momentum shifting, and if price sustains above this zone and pushes into the nearby supply, we could see a deeper expansion to the upside.

SELL XAUUSDGold (XAUUSD) is clearly in a strong bearish trend, confirmed by consistent lower highs/lows and price staying below both EMAs. The recent sharp sell-off created momentum, and what you're seeing now is a corrective pullback into a potential supply zone (that grey box). The small bullish structure with the trendline is just a short-term retracement, not a trend reversal. If price reacts here with rejection (wicks, bearish engulfing, etc.), it aligns with continuation to the downside. However, if it breaks and holds above that zone, then you may be looking at a deeper retracement toward higher liquidity. Overall bias remains bearish unless structure shifts.

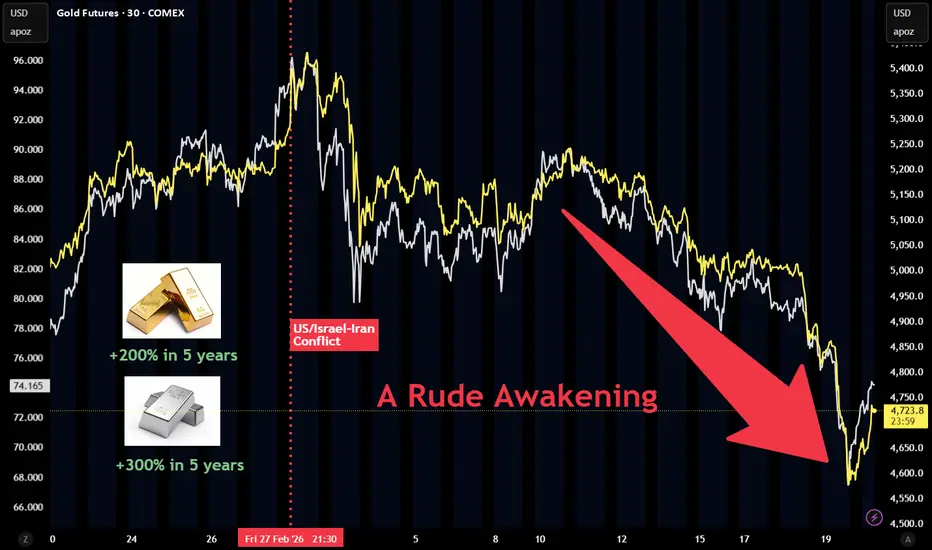
Gold (GC): a Rude AwakeningCOMEX: Options on Gold Futures ( CSE:GC )
On Thursday, March 19th, spot gold fell 6% to the $4,500 mark, a six-week low. Gold ended the day down 3.5%. Similarly, spot silver plummeted 12% intraday and closed down 3.3% in late New York trading session.
Since the conflict between the United States, Israel and Iran started on February 28th, gold has retreated over 15% from its all-time-high of $5,589. This week will likely mark the biggest weekly decline in gold prices since March 2020.
Investors looking for the $10K gold prices just got a rude awakening.
Throughout history, gold is the preferred safe haven asset. In times of geopolitical conflicts and economic distress, investors move their assets from stocks to gold, a phenomenon called the flight to safety. During hype-inflation environment, gold value usually gets preserved while assets priced in fiat currency depreciate. More demand for physical gold and financial instruments based on gold will push gold prices higher.
Why doesn’t the old script book work this time? The underlying logic of this round of gold decline lies in the repricing of the interest rate environment.
US and European central banks have released signals this week, suggesting that the pace of interest rate decline may be slower than previously expected. At the same time, professional and retail investors are simultaneously cutting their exposure to precious metals. Under the dual pressure of failed hopes of interest rate cuts and liquidity shocks, gold and silver's previously established long positions are rapidly collapsing.
The Middle East conflict has triggered a sharp rise in crude oil, natural gas and fuel prices, raising concerns about global inflation outlook. Since gold does not generate interest income, the contraction in rate cut expectations directly weakens its attractiveness.
Gold tends to perform better during periods of low interest rates because the opportunity cost of holding gold is lower. When interest rates are high, interest-yielding assets such as bonds are significantly more attractive to gold.
The energy shock caused by the Middle East conflict has put central banks around the world in a dilemma on inflation and economic growth prospects, and they have issued hawkish statements this week:
The Fed kept interest rates unchanged, with hawkish wording
The Bank of Japan also stood still and said that the situation in the Middle East has further complicated the monetary policy outlook
The central banks of Switzerland and Riks both announced that interest rates would remain unchanged while warning of uncertainty about the economic outlook
The European Central Bank lowered its growth forecast and raised its inflation forecast while keeping interest rates unchanged, suggesting that the risk of stagflation has risen
The Bank of England's statement is particularly noteworthy. It has made it clear that it is ready to "take action" to combat inflation, which surprised the market
Before the war, money markets expected the Fed to cut interest rates twice this year, and current market pricing has priced in no easing this year.
According to CME Group FedWatch Tool, the probability that the Fed Funds rate stays at the current level (3.50-3.75%) by the end of 2026 is 48.9%. From now till December, the odds of cutting a sum of 25 basis points in the remaining six FOMC meetings in 2026 is only 26%, while the probability of raising rates is over 20%.
A similar logic was staged in 2022. After the Russia-Ukraine conflict, soaring energy prices pushed up inflation, and gold fell for seven consecutive months from April to October of that year.
The enthusiasm of retail investors cooled down, and the net outflow of funds from ETFs was carried out. According to VandaTrack data, SPDR Gold Shares, the world's largest gold ETF, has been net sold by retail investors for six consecutive trading days, with a net sale of about $10.5 million in that period as of Thursday's intraday session.
Trading with COMEX Gold Options
Gold prices could go either way depending on how the Middle East conflict plays out.
If the conflict ends quickly, we could see the reversal of recent market trends: oil and gas prices decline, inflation tamed, and gold and silver rebound.
If the conflict prolongs and the global energy supply disruption ensures, oil and gas could hit higher records, inflation resurfaced, and gold and silver declined further.
Given the high uncertainty, we could explore the gold options strategy.
Since gold prices declined in recent weeks, premium for call options became cheaper. In my opinion, this is good opportunity to purchase out-of-the-money (OTM) call options.
In overnight trading, COMEX June 2026 gold futures (GCM6) contract is quoted at 4,770.7. Premium for the 5225-strike call options is quoted at $72. Each options contract has a notional value of 100 troy ounces.
Hypothetically, if gold futures rebounded to January record high of 5,589.38 within the next three months, our call options will be $364.38 in-the-money.
For illustration purposes, we could calculate the theoretical return of the above strategy:
The cost of upfront premium is $7,200 (=72 x 100).
The gain for holding 1 call options is $36,438 ( = (5589.38-5225) x 100).
Using call premium as a cost base, the return is +406% (= (36438/7200) – 1).
The risk of buying call options is that the underlying futures prices did not move above the option strike price before contract expiration.
Happy Trading.
Disclaimers
*Trade ideas cited above are for illustration only, as an integral part of a case study to demonstrate the fundamental concepts in risk management under the market scenarios being discussed. They shall not be construed as investment recommendations or advice. Nor are they used to promote any specific products, or services.
CME Real-time Market Data help identify trading set-ups and express my market views. If you have futures in your trading portfolio, you can check out on CME Group data plans available that suit your trading needs www.tradingview.com
$UBER The Amazon of Transportation. Two Monthly Buy Zones MappedUber CEO Dara Khosrowshahi said it himself on the Q4 2025 earnings call: "We enter 2026 with a rapidly growing topline, significant cash flow, and a clear path to becoming the largest facilitator of AV trips in the world."
The market has spent the last three months pricing in doubt. The last three days have been a reminder of what Uber actually is.Here is what just happened this week alone.On March 17, 2026, Uber jumped 5.6% to $78.83 following a landmark announcement at Nvidia's GTC conference.
The two companies unveiled a plan to deploy 100,000 Level 4 robotaxis across 28 cities by 2028 using Nvidia's DRIVE Hyperion platform and the Alpamayo AI model.
On March 13, Uber and Motional officially launched a commercial robotaxi service in Las Vegas, with a fully driverless service expected by end of 2026.
Uber also announced a partnership with Zoox, Amazon's autonomous vehicle division, targeting Las Vegas by summer 2026 and Los Angeles by mid-2027, with Zoox covering all insurance and fleet costs.
A collaboration with Nissan and British startup Wayve targets a pilot robotaxi launch in Tokyo by late 2026, Uber's first AV partnership in Japan. Uber committed over $100 million to build autonomous vehicle charging infrastructure. And Uber launched Uber Autonomous Solutions, a full turnkey backend for AV developers covering routing, cleaning, charging, and maintenance, effectively making Uber the operating system for the entire robotaxi industry.
This is the asset-light model at its most powerful. Uber does not build the cars. It does not own the fleet. It does not pay for insurance. It collects a fee on every trip across a network of 202 million monthly active platform consumers who already have the app on their phone.
Think of it as a toll road operator for the autonomous vehicle era.The fundamental picture is confirmed. Uber completed 3.8 billion trips in Q4 2025 alone. Annual revenue exceeds $52 billion.
The analyst consensus price target sits at $103.81 across 55 analysts, with 47 Buy ratings, 8 Hold ratings, and just 1 Sell. Deutsche Bank reiterated Buy following the Nvidia announcement.
BofA maintains Buy with a $103 price target. Goldman Sachs holds a Buy rating. The highest target on the Street is $150. The 52-week high was $101.99 reached in October 2025. The stock is currently trading at $76.66, down approximately 25% from that high.The Iran war context matters here in a specific way.
Every conflict that disrupts oil supply accelerates the timeline for energy-efficient autonomous transportation. When fuel costs spike, the economic case for electric robotaxis at $0.20 to $0.30 per mile against $2.00 per mile ride-sharing strengthens dramatically.
Uber's robotaxi network runs on electricity. Its cost structure benefits from exactly the kind of oil price shock the Iran conflict has created. The war is not a headwind for Uber's autonomous transition. It is a tailwind.
The monthly chart shows a controlled multi-year base building phase. After peaking at $101.99, price retraced into two clean Fibonacci demand zones that align with the 0.618 and 0.382 levels of the entire 2023 to 2025 bull run.
The blue SMA 20 on the monthly is curling upward as long-term trend support. The broader channel from the 2022 lows remains firmly intact.
🟢 Buy Zone 1 ($62.27 area)
The 0.618 Fibonacci retracement and a major horizontal support shelf going back to early 2024.
Stop: $3.48 below entry (5.589%) / $980 position
Qty: 5
Risk/Reward Ratio: 17.59
Target 1: +70.508% ($85.22 area / $1,202.53)
Target 2: +98.282% ($121.65 area / $1,351.72)
🟢 Buy Zone 2 ($49.98 area)
The 0.382 Fibonacci retracement and the prior breakout base from late 2023.
Stop: $3.48 below entry (6.963%) / $980 position
Qty: 5
Risk/Reward Ratio: 10.13
Target 1: +70.508% ($85.22 area / $1,202.53)
Target 2: +98.282% ($121.65 area / $1,351.72)
Key Levels:
🔑 Current Price: $76.66
🔑 Buy Zone 1: ~$62.27
🔑 Buy Zone 2: ~$49.98
🔑 52-Week Low: $60.63
🔑 52-Week High: $101.99
🔑 Monthly Active Users: 202 million
🔑 Q4 2025 Trips: 3.8 billion
🔑 Annual Revenue: $52B+
🔑 Analyst Consensus Target: $103.81
🔑 Highest Analyst Target: $150
🔑 Next Earnings: May 6, 2026
🎯 Target 1: $85.22 (+70% from Zone 1 / $1,202.53)
🎯 Target 2: $121.65 (+98% from Zone 2 / $1,351.72)
⚠️ Hard Stop Both Zones: $3.48 below entry
The bears will point to lower take rates on autonomous rides compared to standard UberX fares, the long timeline to 28 cities, and the regulatory patchwork that still exists across US states.
Those are real considerations. But a company with 202 million monthly users, $52 billion in annual revenue, 47 analyst Buy ratings, and a robotaxi strategy that requires it to own zero vehicles is not a company that stays 25% below its 52-week high for long.
Uber is not building the cars. It is building the network every car has to use. That is the Amazon of transportation. Two monthly buy zones are mapped.

Powell’s term extended? What this means for markets The Federal Reserve has left its interest rate unchanged but acknowledged growing uncertainty about the ongoing Iran conflict.
Despite this, the Fed continues to project one rate cut in 2026 and another in 2027.
The U.S. dollar index moved back above the 100 level, while U.S. equities extended their decline. At the same time, WTI crude oil futures rebounded toward $98
Long live the King!
A federal judge recently blocked the obvious politized subpoena issued to Fed Chair Jerome Powell by the Department of Justice. Fox news host turned U.S. Attorney Jeanine Pirro confirmed the Department of Justice will appeal this ruling.
Powell has just now indicated he will remain in his role beyond the end of his term in May if Kevin Warsh, his nominated replacement, faces a delayed confirmation. Republican Senator Thom Tillis stated he will not confirm Warsh as the new Fed Chair until the investigation into Powell is resolved. Warsh is widely seen as more open to rate cuts than Powel.

Dubai Real Estate Index Ignores the Risk of a Sunken Oil Tanker!The Dubai real estate market has just experienced a sharp correction, dropping roughly -34% from its recent highs. This kind of move quickly wipes out bullish sentiment and raises a critical question: is this just a correction… or the beginning of something deeper?
From a technical perspective, the December 2024 level remains a key reference point — and, for now, it still looks like a potentially reasonable support zone.
What the chart is telling us:
This level previously acted as a base before a major breakout, which gives it technical significance.
Right now:
Price is testing this level for the first time after the breakout
The long-term trend (supported by the major moving average) has been violently broken
Momentum is clearly bearish, with no strong signs of a final capitulation yet
In typical market behavior, this kind of zone can lead to:
a short-term bounce (dead cat bounce), or
a continuation lower, if the support fails decisively
The bigger issue: external risk
The real concern here isn’t just technical — it’s exogenous risk.
An extreme, but plausible scenario in the current geopolitical environment would be:
a major incident in the Gulf (for example, a sunken oil tanker),
leading to water contamination and a large-scale ecological disaster near Dubai.
Such an event would have an outsized impact:
Dubai heavily relies on its image of luxury, safety, and lifestyle
environmental damage would directly hit tourism and real estate demand
international investors could pull back for an extended period
Structural vulnerability of the market
It’s important to understand that Dubai is not a “natural” real estate market in the traditional sense.
The climate is extremely harsh for a large part of the year
Demand is highly dependent on:
foreign capital
geopolitical stability
global perception
That means:
any external shock can trigger disproportionately large downside moves
Conclusion:
Technically, the December 2024 level still holds—for now. After a -34% drop, it’s reasonable to expect some form of reaction or temporary stabilization here.
However, this support is fragile!
If additional risks materialize — especially geopolitical or environmental — the market could:
break below this level
and enter a much deeper correction, potentially well beyond current expectations
My Price target is 8000.

USOIL (1W): excellent bullish scenarioUSOIL: excellent bullish scenario. Price has just confirmed a bullish move in weekly timeframe. In my opinion this is the beginning of a huge bullish move. This initiation needs a news to fuel the buyers. The best news feed is US-IR situation, and do not forget that both are involved in oil. Instead of crypto, invest on these real things, in a proper time.
Cheers
