Bitcoin’s recent price action has been quietly at odds with its macro environment.
By mid-March 2026, it found itself in an unusual position: the macro backdrop had turned decisively hostile. Oil prices were surging, U.S. rate-cut expectations had largely evaporated (with rates unchanged eventually), and geopolitical tensions were spilling into broader risk markets.

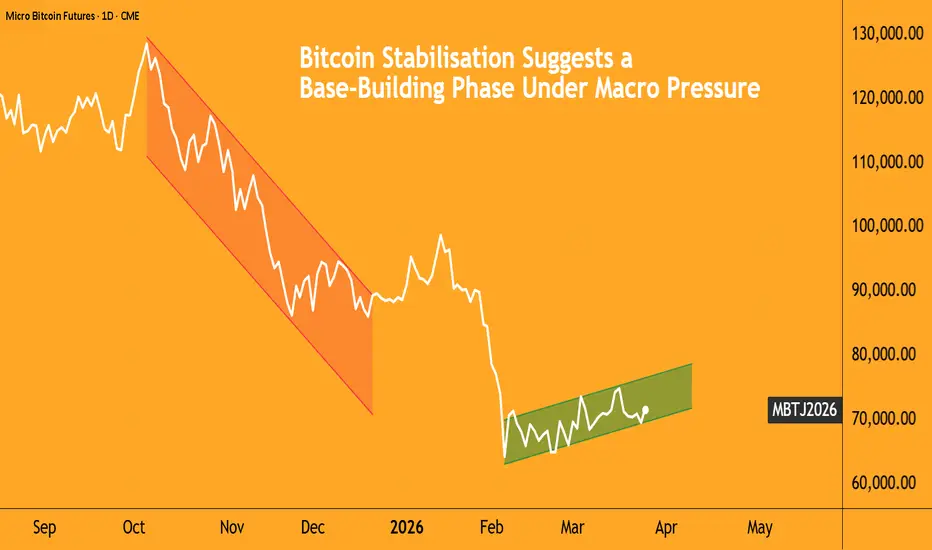
Still, under normal conditions, this combination would weigh heavily on speculative assets. Yet Bitcoin held close to $70,000, recovering from a sharp February drawdown and, for a time, outperforming both equities and traditional hedges.
This divergence is where we begin, to get to the more important analysis of its significance.
After several weeks of sustained outflows, digital asset investment products saw a decisive reversal in early March. Flows in U.S. Spot Bitcoin ETFs have absorbed billions in overflows, with the BlackRock IBIT ETF accumulating over $2 billion of inflows this month.

The market structure improved following the February drawdown, with the earlier selloff having flushed out leverage, reduced forced selling pressure, and reset positioning.
Together, these factors: renewed inflows, spot demand, and cleaner positioning, have created the conditions for resilience.
Supply Compression Holds Even as Flow Sensitivity Rises
Fewer bitcoins are being moved to exchanges, which essentially means less intent to sell and lower immediate selling pressure.
On-chain data, which tracks how bitcoins move across wallets and exchanges, shows a sharp contraction in exchange inflows, falling from over 53,000 BTC in late February to under 3,000 BTC by March.

Behaviour across wallets, essentially the digital addresses where Bitcoin is stored, has also diverged this month, particularly among large holders. More recently, the largest holders of BTC have stepped up and held balances steady, while mid-sized and smaller wallets have gradually increased positions, suggesting internal redistribution rather than a clear directional flow.
Two dominant sources of potential selling pressure, retail distribution and whale unloading, have both remained muted.

This is the first pillar of Bitcoin’s resilience: there is simply less supply coming to market.
But that resilience notwithstanding, Bitcoin has not stopped behaving like a risk asset.
Following the latest FOMC meeting, and after three consecutive days of over $150 million in inflows, the following sessions saw a sequence of net outflows.
While not invalidating the prior inflows, it does suggest that flows are becoming more sensitive to macro conditions, rather than acting as a one-directional support.
Institutional ETF Flows Act as the Market’s Primary Stabiliser
We mentioned the cumulative inflows exceeding $2 billion this month. On certain days, flows were highly concentrated, with BlackRock’s IBIT alone contributing over $300 million in a single session.
These flows matter not just in magnitude, but are absorbing supply from miners, early investors, and macro-driven sellers, and doing so through a regulated, institutional channel. ETFs have introduced a more stable, allocation-driven bid, reducing reliance on leverage-heavy demand while reinforcing the role of futures as a hedging and positioning layer.
At the same time, the derivatives market tells a more cautious story.
The put-to-call open interest ratio in Bitcoin options rose to 0.76, among the highest levels in almost 5 years, though it has come down from the previously reported yearly high of 0.84.

Source: CME QuikStrike
Clearly, institutional participants are actively hedging against downside risk, as reflected in the CoT report below. Over the past nine months, asset managers have more than doubled their short positions, while the net positions have decreased by 30% in the same period:

Source: CME CoT
Futures markets reinforce the same point. CME Bitcoin futures maintained steady liquidity, with open interest hovering around 22,000 contracts, equivalent to roughly $7.8 billion in notional exposure.

Source: CME QuikStrike
More telling is what has happened to leverage. Total crypto derivatives open interest fell sharply, from $38 billion in early January to around $22 billion at present, a decline of over 42%.
With less leverage in the system, the risk of liquidations is significantly reduced. Price moves, when they occur, are more likely to be gradual than disorderly.
Yet, this could also limit upside; a market driven by steady inflows, low leverage, and cautious positioning could move slowly. Bitcoin’s March price action betrays the building of a base, rather than accelerating into a breakout.
Macro Correlation and a Historical Trade Set-Up
Despite its relative resilience, Bitcoin has not detached from broader risk dynamics. The 30-day correlation with the Nasdaq reached 0.81 on 10/Mar, the highest level since July 2025.

Presently, though, the coefficient of -0.41 is also the lowest in about 4 months, though these periods of divergence have not yet translated into a sustained decoupling.
Bitcoin’s current setup shares similarities with prior post-deleveraging phases, where price stabilises following a sharp correction before attempting a more sustained move.
A comparable period can be observed in mid–late 2023, when Bitcoin traded within a relatively tight range after a reset in positioning. Despite the absence of a clear bullish catalyst and a still-restrictive macro backdrop, the asset gradually absorbed selling pressure and moved higher over time.
The current environment shows similar features. Leverage has declined, on-chain data points to limited distribution, and institutional flows have provided a degree of underlying support. At the same time, macro conditions remain uncertain, suggesting that any recovery is likely to be gradual rather than impulsive.
In this context, a tactically long position in Micro Bitcoin futures (MBT) offers a way to participate in potential stabilisation without relying on an immediate breakout.

Entry Price: $27,330
Exit Price: $42,679
Price Move: $15,349
With the MBT’s contract size equalling 0.1 BTC, the PnL per Contract would be:
= 0.1 × $15,349
= $1,535 per contract.
At the same time, given the continued sensitivity to macro conditions, participants may consider incorporating downside protection, as the 65,000 put for the April expiry has significant open interest, and the overall put-call ratio for this expiry is 1.10.

Source: CME QuikStrike
This content is sponsored.
MARKET DATA
CME Real-time Market Data helps identify trading setups and more effectively express market views. If you have futures in your trading portfolio, you can check out on CME Group data plans available that suit your trading needs at tradingview.com/cme.
DISCLAIMER
This case study is for educational purposes only and does not constitute investment recommendations or advice. Nor are they used to promote any specific products, or services.
Trading or investment ideas cited here are for illustration only, as an integral part of a case study to demonstrate the fundamental concepts in risk management or trading under the market scenarios being discussed.
By mid-March 2026, it found itself in an unusual position: the macro backdrop had turned decisively hostile. Oil prices were surging, U.S. rate-cut expectations had largely evaporated (with rates unchanged eventually), and geopolitical tensions were spilling into broader risk markets.
Still, under normal conditions, this combination would weigh heavily on speculative assets. Yet Bitcoin held close to $70,000, recovering from a sharp February drawdown and, for a time, outperforming both equities and traditional hedges.
This divergence is where we begin, to get to the more important analysis of its significance.
After several weeks of sustained outflows, digital asset investment products saw a decisive reversal in early March. Flows in U.S. Spot Bitcoin ETFs have absorbed billions in overflows, with the BlackRock IBIT ETF accumulating over $2 billion of inflows this month.
The market structure improved following the February drawdown, with the earlier selloff having flushed out leverage, reduced forced selling pressure, and reset positioning.
Together, these factors: renewed inflows, spot demand, and cleaner positioning, have created the conditions for resilience.
Supply Compression Holds Even as Flow Sensitivity Rises
Fewer bitcoins are being moved to exchanges, which essentially means less intent to sell and lower immediate selling pressure.
On-chain data, which tracks how bitcoins move across wallets and exchanges, shows a sharp contraction in exchange inflows, falling from over 53,000 BTC in late February to under 3,000 BTC by March.
Behaviour across wallets, essentially the digital addresses where Bitcoin is stored, has also diverged this month, particularly among large holders. More recently, the largest holders of BTC have stepped up and held balances steady, while mid-sized and smaller wallets have gradually increased positions, suggesting internal redistribution rather than a clear directional flow.
Two dominant sources of potential selling pressure, retail distribution and whale unloading, have both remained muted.
This is the first pillar of Bitcoin’s resilience: there is simply less supply coming to market.
But that resilience notwithstanding, Bitcoin has not stopped behaving like a risk asset.
Following the latest FOMC meeting, and after three consecutive days of over $150 million in inflows, the following sessions saw a sequence of net outflows.
While not invalidating the prior inflows, it does suggest that flows are becoming more sensitive to macro conditions, rather than acting as a one-directional support.
Institutional ETF Flows Act as the Market’s Primary Stabiliser
We mentioned the cumulative inflows exceeding $2 billion this month. On certain days, flows were highly concentrated, with BlackRock’s IBIT alone contributing over $300 million in a single session.
These flows matter not just in magnitude, but are absorbing supply from miners, early investors, and macro-driven sellers, and doing so through a regulated, institutional channel. ETFs have introduced a more stable, allocation-driven bid, reducing reliance on leverage-heavy demand while reinforcing the role of futures as a hedging and positioning layer.
At the same time, the derivatives market tells a more cautious story.
The put-to-call open interest ratio in Bitcoin options rose to 0.76, among the highest levels in almost 5 years, though it has come down from the previously reported yearly high of 0.84.
Source: CME QuikStrike
Clearly, institutional participants are actively hedging against downside risk, as reflected in the CoT report below. Over the past nine months, asset managers have more than doubled their short positions, while the net positions have decreased by 30% in the same period:
Source: CME CoT
Futures markets reinforce the same point. CME Bitcoin futures maintained steady liquidity, with open interest hovering around 22,000 contracts, equivalent to roughly $7.8 billion in notional exposure.
Source: CME QuikStrike
More telling is what has happened to leverage. Total crypto derivatives open interest fell sharply, from $38 billion in early January to around $22 billion at present, a decline of over 42%.
With less leverage in the system, the risk of liquidations is significantly reduced. Price moves, when they occur, are more likely to be gradual than disorderly.
Yet, this could also limit upside; a market driven by steady inflows, low leverage, and cautious positioning could move slowly. Bitcoin’s March price action betrays the building of a base, rather than accelerating into a breakout.
Macro Correlation and a Historical Trade Set-Up
Despite its relative resilience, Bitcoin has not detached from broader risk dynamics. The 30-day correlation with the Nasdaq reached 0.81 on 10/Mar, the highest level since July 2025.
Presently, though, the coefficient of -0.41 is also the lowest in about 4 months, though these periods of divergence have not yet translated into a sustained decoupling.
Bitcoin’s current setup shares similarities with prior post-deleveraging phases, where price stabilises following a sharp correction before attempting a more sustained move.
A comparable period can be observed in mid–late 2023, when Bitcoin traded within a relatively tight range after a reset in positioning. Despite the absence of a clear bullish catalyst and a still-restrictive macro backdrop, the asset gradually absorbed selling pressure and moved higher over time.
The current environment shows similar features. Leverage has declined, on-chain data points to limited distribution, and institutional flows have provided a degree of underlying support. At the same time, macro conditions remain uncertain, suggesting that any recovery is likely to be gradual rather than impulsive.
In this context, a tactically long position in Micro Bitcoin futures (MBT) offers a way to participate in potential stabilisation without relying on an immediate breakout.
Entry Price: $27,330
Exit Price: $42,679
Price Move: $15,349
With the MBT’s contract size equalling 0.1 BTC, the PnL per Contract would be:
= 0.1 × $15,349
= $1,535 per contract.
At the same time, given the continued sensitivity to macro conditions, participants may consider incorporating downside protection, as the 65,000 put for the April expiry has significant open interest, and the overall put-call ratio for this expiry is 1.10.
Source: CME QuikStrike
This content is sponsored.
MARKET DATA
CME Real-time Market Data helps identify trading setups and more effectively express market views. If you have futures in your trading portfolio, you can check out on CME Group data plans available that suit your trading needs at tradingview.com/cme.
DISCLAIMER
This case study is for educational purposes only and does not constitute investment recommendations or advice. Nor are they used to promote any specific products, or services.
Trading or investment ideas cited here are for illustration only, as an integral part of a case study to demonstrate the fundamental concepts in risk management or trading under the market scenarios being discussed.
Full Disclaimer - linktr.ee/mintfinance
Disclaimer
The information and publications are not meant to be, and do not constitute, financial, investment, trading, or other types of advice or recommendations supplied or endorsed by TradingView. Read more in the Terms of Use.
Full Disclaimer - linktr.ee/mintfinance
Disclaimer
The information and publications are not meant to be, and do not constitute, financial, investment, trading, or other types of advice or recommendations supplied or endorsed by TradingView. Read more in the Terms of Use.