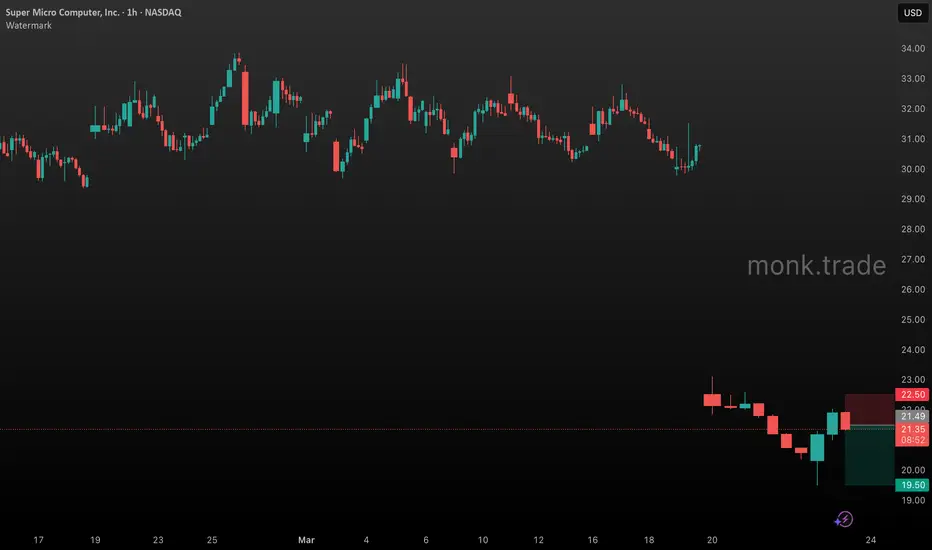
📉 SHORT SMCI @ $21.49 🎯 Target $19.50 🛑 Stop $22.50
⚖️ R:R 1.97:1 | 🧠 Confidence 72% | ⏱️ Swing (1-2 weeks)
---
🔑 The Setup
SMCI gapped down -30% on March 20 — from $30.80 to $22 — on 55 million shares 🤯 (vs 3M avg). That's not retail panic, that's institutional distribution 🏦💨
The bounce from $19.48 to $21.50 is a textbook dead-cat rally 🐱 back into the gap supply zone. Every dollar of this recovery is lower-volume, lower-conviction selling opportunity.
📊 Why Short Here
🏗️ Structure:
- 📉 Multi-month downtrend from $50+ (Oct) to $20s — no sustained base anywhere
- 💥 Gap-down on 15x average volume confirms structural breakdown
- 🧱 $22-23 = prior breakdown candle body, now overhead resistance
- 😴 Bounce stalling with fading volume — sellers reloading at the level
🔮 Options Flow:
- 🐻 Net bearish sentiment: -$470K
- 📌 Heavy put buying at $20 and $21 strikes across near-term expiries
- 💰 Bearish premium $1.19M vs bullish $724K
- 🌡️ IV at 90%+ — market pricing continued downside
🗺️ Key Levels
🧱 Resistance: $22.00-22.50 (gap supply zone, breakdown candle body)
👉 Entry: $21.49 (dead-cat bounce into resistance)
🛑 Stop: $22.50 (above gap supply — thesis invalidated)
🎯 Target: $19.50 (prior intraday low, room to extend)
🛟 Support: $19.48 (Mar 23 flush low)
💡 The Trade
Fading the bounce at resistance in a confirmed downtrend ⬇️ The massive gap-down volume created a wall of overhead supply 🧱 that should cap any recovery attempts. If $22.50 holds as
resistance, gravity takes over 🪂
🛑 Invalidation: Close above $22.50 — that would mean the gap is being reclaimed and the breakdown thesis is wrong ❌
🎯 Target logic: $19.50 is the prior intraday low. If momentum continues, $18 and $16 are the next structural supports from the longer-term chart 📏
Disclaimer
The information and publications are not meant to be, and do not constitute, financial, investment, trading, or other types of advice or recommendations supplied or endorsed by TradingView. Read more in the Terms of Use.
Disclaimer
The information and publications are not meant to be, and do not constitute, financial, investment, trading, or other types of advice or recommendations supplied or endorsed by TradingView. Read more in the Terms of Use.