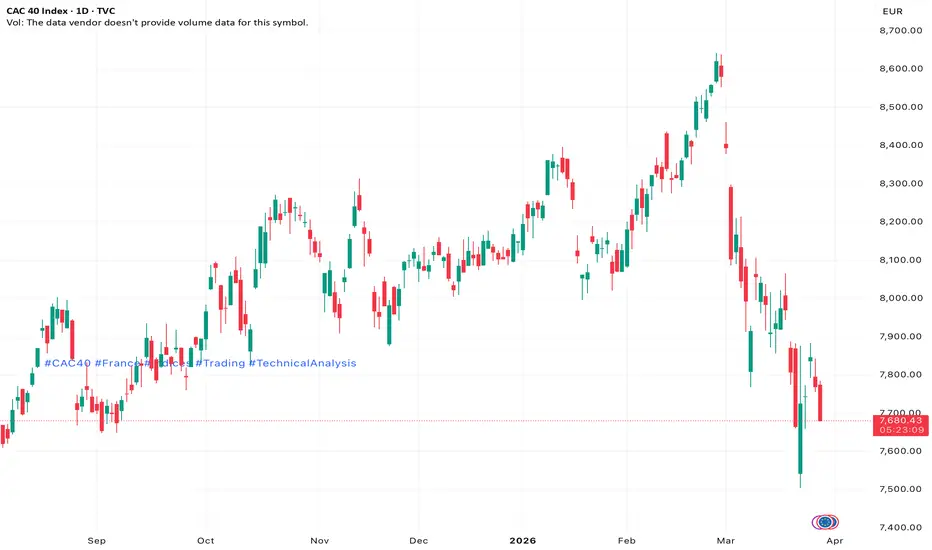
CAC 40 Extends Correction Amid Energy Crisis and Bond Market ShiThe CAC 40 index continues its corrective movement, trading near 7799.0, as investors rotate capital from risk assets into bonds amid rising inflation concerns and escalating geopolitical tensions.
The ongoing US–Iran conflict and growing risks to global energy supply chains remain the key drivers of market sentiment.
⸻
Energy Risks Pressure European Markets
France is taking preventive measures to stabilize its energy market amid supply risks:
• Focus on Gravenchon refinery
• ~20% of national refining capacity
• Up to 12 million tons annually
This move aims to:
• Offset supply disruptions
• Stabilize domestic fuel markets
• Protect employment
Rising freight and insurance costs due to extended logistics routes further increase risks.
⸻
Weak Macro Data Signals Economic Slowdown
Recent French economic data points to growing risks:
• Manufacturing PMI: 50.2 (slight improvement)
• Services PMI: 48.3 (decline)
• Composite PMI: 48.3 (down from 49.9)
Additional data:
• Business climate index: 99.0 (down from 102.0)
• Consumer confidence: 89.0 (down from 91.0)
New orders fell at the fastest pace since July 2025, while export demand weakened significantly.
⸻
Rising Bond Yields Weigh on Equities
Bond yields continue rising:
Short-term bonds:
• 3-month: 2.226%
• 6-month: 2.412%
• 12-month: 2.585%
Long-term bonds:
• 10-year: 3.796%
• 20-year: 4.293%
• 30-year: 4.550%
Higher yields reduce demand for equities and pressure stock indices.
⸻
Top Movers in CAC 40
Gainers
• TotalEnergies (+2.89%)
• STMicroelectronics (+1.91%)
• Sanofi (+1.36%)
• Dassault Systèmes (+0.95%)
• Carrefour (+0.91%)
Decliners
• Pernod Ricard (−5.73%)
• Legrand (−4.50%)
• Schneider Electric (−3.93%)
• ArcelorMittal (−3.47%)
• Airbus (−3.00%)
⸻
Technical Analysis
The index remains below the ascending channel support:
• Channel range: 8700–8050
• Correction remains intact
Indicators:
• Alligator: sell signal
• AO: negative bars
➡️ Bearish momentum remains dominant
⸻
Key Levels
Resistance
• 7940.0
• 8240.0
Support
• 7640.0
• 7350.0
⸻
Trading Scenarios
Bearish Scenario
Sell below 7640.0
• Entry: 7639.5
• Target: 7350.0
• Stop-loss: 7800.0
• Timeframe: 7 days or more
⸻
Bullish Scenario
Buy above 7940.0
• Entry: 7940.5
• Target: 8240.0
• Stop-loss: 7850.0
⸻
Outlook
CAC 40 remains under pressure from:
• Energy crisis
• Rising bond yields
• Weak macroeconomic data
• Break below 7640 → bearish continuation
• Break above 7940 → corrective rebound
Short-term bias remains bearish.
CAC 40 Index
No trades
In-depth trading ideas
FR40 Bullish Structure | Smart Pullbacks in Control🔷 FR40 / CAC40 — FRANCE 40
📊 Index Market Capital Flow Blueprint (Swing Trade)
🧭 Market Bias
🟢 Bullish Structure Confirmed
Price continues to respect the Triangular Moving Average (TMA) with multiple clean pullbacks, signaling sustained institutional accumulation and healthy trend continuation.
🧠 Trade Plan Logic
📐 Triangular Moving Average = Dynamic Support
Multiple pullback reactions 🧲
Higher-timeframe trend intact 📈
Momentum maintained above structure 🏗️
This behavior typically reflects smart-money re-entries, not retail chasing.
🎯 Entry Strategy (Layered Execution)
🔹 Entry Style: Any price level (Layered accumulation approach)
🧱 Buy Limit Layers (Example):
8070
8100
8125
8150
📌 You may increase or adjust layers based on your own execution model.
🛑 Risk Management
🔻 Stop Loss: 8000
⚠️ This is a reference level, not a mandate.
Always align risk with your capital, timeframe, and psychology.
🎯 Target Zone
🚨 8300 Area
Strong resistance cluster 🧱
Overbought conditions ⚠️
Trap & correction probability increases 📉
💡 Recommendation: Scale out profits — do not overstay.
📝 Important Note
🔔 This plan is not financial advice.
Every trader must manage entries, SL, and TP independently based on their own risk framework.
🔍 Related Markets to Watch (Correlation Guide)
🇺🇸 US30 ( TVC:DJI )
Strong positive correlation with FR40
Risk-on flows into US equities often spill into European indices
🇩🇪 GER40 ( XETR:DAX )
Closest structural correlation
German industrial strength frequently leads CAC40 direction
🇺🇸 SPX500 ( SP:SPX )
Global risk sentiment benchmark
Sustained SPX strength supports European index continuation
🇺🇸 EUR/USD ( FX:EURUSD )
Rising EUR can cap upside in FR40 due to exporter pressure
Weak EUR often supports French equities
🧠 Key Takeaway
📌 Trend is bullish until structure breaks.
Respect the moving average, manage risk, and let the market pay you — not emotions.
👍 If this analysis adds value, LIKE • COMMENT • FOLLOW for more institutional-style setups.

CAC 40The CAC 40 continues to hold steady despite minor volatility, showing resilience in the current macro environment. We still have roughly 30 days until the next Federal Reserve meeting, and markets will likely begin positioning ahead of that decision.
I do expect a meaningful rate cut, which could provide support to the broader economy. Lower rates typically ease borrowing conditions, improve liquidity, and can act as a tailwind for equities particularly major indices like the CAC 40.
For now, the key is maintaining this steady flow. Small pullbacks are natural and healthy within an uptrend. As long as the index absorbs these minor bumps and holds structure, the broader outlook remains constructive.
If monetary policy shifts as expected, we could see renewed momentum pushing prices higher.
Patience and discipline remain essential in this phase.
CAC 40 at Major ResistanceThe CAC 40 index is currently testing a major supply / resistance zone around 8,300–8,400, a level that has previously acted as a strong rejection area.
Price is trading above the moving average, indicating that the overall structure remains bullish, but momentum is slowing as sellers step in near resistance.
This area is technically a decision zone.
🟢 Bullish Scenario
• Strong daily close above 8,400
• Successful breakout and acceptance above resistance
• Upside targets:
• 8,550
• 8,700
• Continuation of the broader uptrend
🔴 Bearish Scenario
• Failure to hold above 8,250
• Bearish rejection from the resistance zone
• Pullback targets:
• 8,000
• 7,800
🛑 Stop Loss (English)
• Long positions: below 8,200
• Short positions: above 8,420 after rejection confirmation

France 40 simple buy set upIf this support level is hold, expect price to match our forecast this is a simple trade

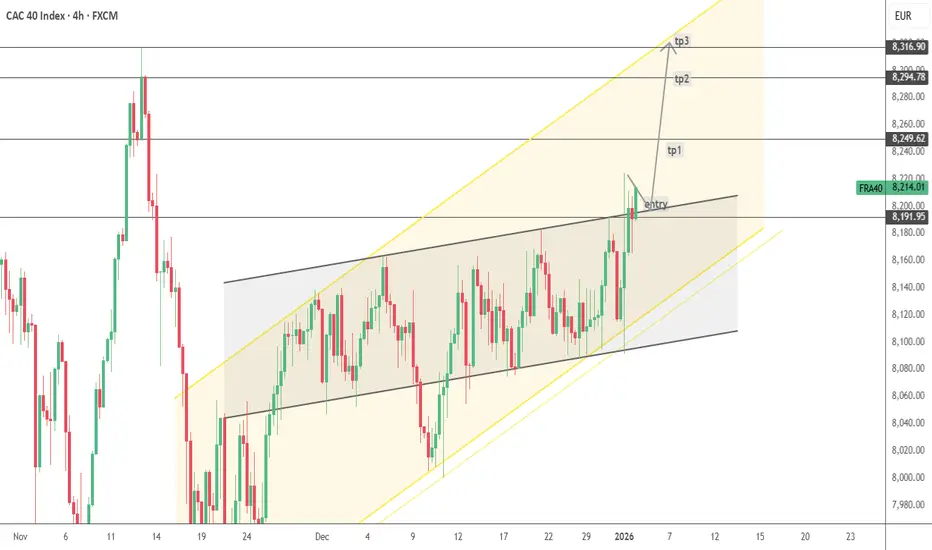
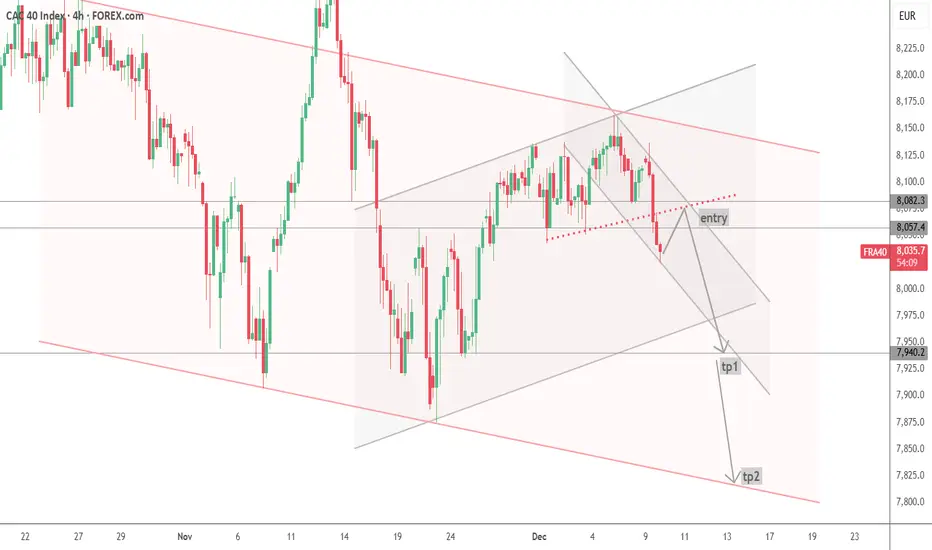
FRA40--Ascending channel--Long bias in ascending channel
--entry and tp levels are as shown on the chart
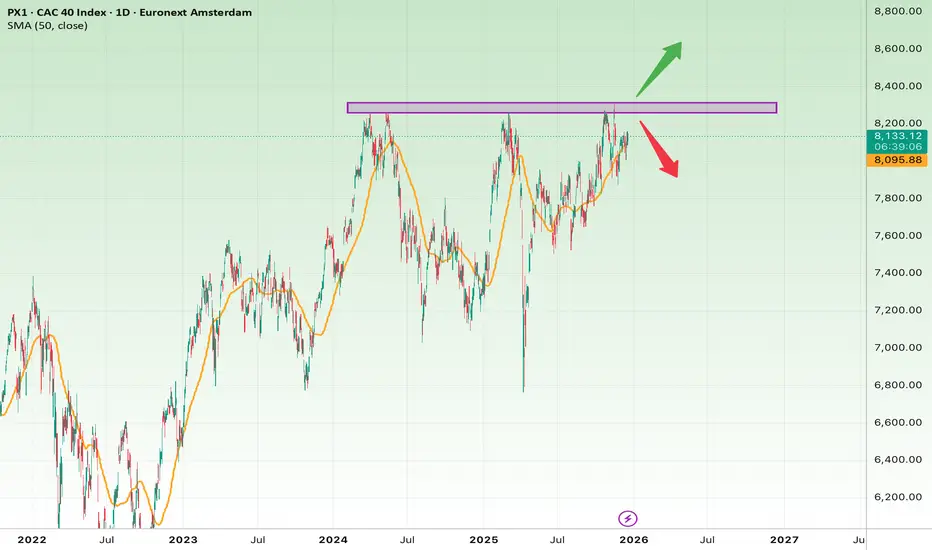
CAC 40 Technical AnalysisThe CAC 40 index is in a medium-term uptrend and is currently testing a major historical resistance zone around 8200–8300.
This zone has triggered multiple strong rejections in the past and now represents a key decision area.
Price remains above the 50-day SMA, confirming bullish structure, but volatility is expected near resistance.
Bullish Scenario (Breakout)
If price breaks and closes above 8300:
Targets
• Target 1: 8500
• Target 2: 8700
• Target 3: 9000
Stop Loss
• Daily close below 8100
Rationale:
A confirmed breakout above historical highs may trigger a new impulse leg driven by institutional inflows.
Bearish Scenario (Rejection)
If price rejects the 8200–8300 resistance:
Targets
• Target 1: 7900
• Target 2: 7600
• Target 3: 7300
Stop Loss
• Daily close above 8350
Rationale:
Failure to break resistance could lead to a healthy corrective pullback within the broader uptrend.
Technical Summary
• Above 8300 → Strong bullish continuation
• Below 8100 → Deeper correction, long-term trend still intact
Brief Fundamental Analysis – CAC 40
• Composed of major European export-driven blue-chip companies.
• Benefits from:
• Relatively weak euro
• Global demand recovery
• Risks:
• ECB tightening policies
• Slower European economic growth
Fundamental Takeaway:
CAC 40 is considered a stable, lower-volatility index compared to U.S. growth indices, suitable for medium-term conservative exposure.
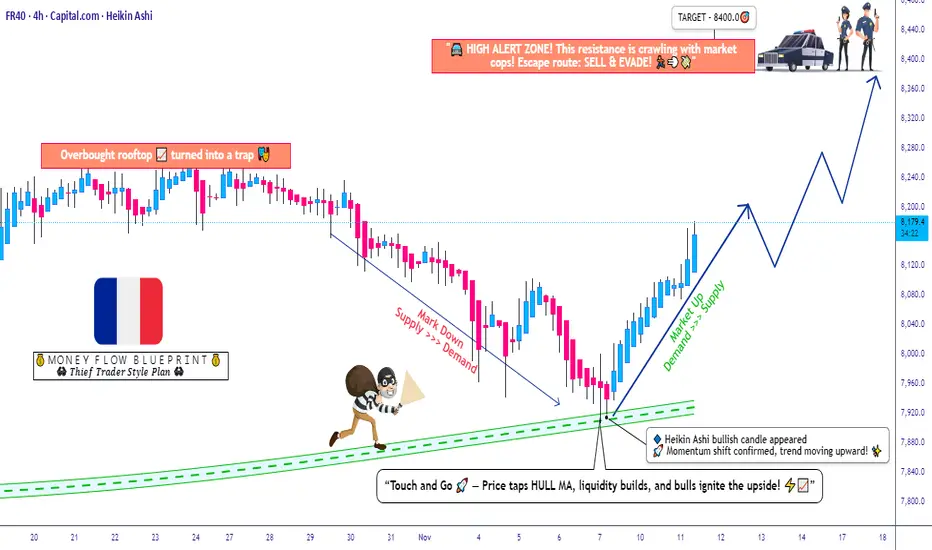
FR40 Swing Opportunity – Reversal Pattern Meets Strong Support🔥 FR40 / CAC40 (France 40) – Bullish Swing Setup | Dynamic Support Reversal Plan
💼 Asset: FR40 / CAC40 (France 40 Index)
📊 Type: Swing Trade Opportunity (Technical + Dynamic Layered Entry Strategy)
🎯 Trade Plan Overview
A strong bullish plan has been confirmed on the France 40 index 🇫🇷, backed by triangular moving average dynamic support and a Heikin Ashi bullish reversal candle formation — signaling potential upward pressure building in the French market.
💥 Thief Layered Entry Plan
🧠 Thief Strategy = “Layered Limit Entry System” (Stacking multiple buy orders to catch ideal pullbacks with precision).
Buy Limit Layers:
🔹 8000
🔹 8040
🔹 8080
🔹 8120
(You can increase limit layers based on your own conviction & margin plan.)
📍 Entry Zone: Any of the above layers (or your custom level aligned with your own setup).
🧨 Stop-Loss (Thief Protective Layer)
📉 This is Thief SL ➤ @7960
Dear Ladies & Gentlemen (Thief OG’s), adjust SL based on your own plan & risk tolerance — I’m not recommending you to lock into only this SL.
💡 Manage your risk — trade smart, trade free.
💰 Target Zone (Profit Exit Plan)
🚨 “Police Barricade” (Resistance Zone) spotted around @8400 — market overbought conditions may trigger traps or reversals, so escape with profits wisely.
🎯 TP: 8400 (Flexible exit — manage dynamically if momentum extends)
Note: Dear Ladies & Gentlemen (Thief OG’s), always adapt — take profit at your own choice & risk comfort.
🔗 Correlation Watchlist (for Confirmation & Sentiment Clues)
Keep eyes on these correlated assets for macro sentiment confirmation 👇
💶 GER40 (DAX) – Often mirrors CAC40’s trend structure.
💷 UK100 (FTSE) – Correlates during European session sentiment shifts.
💵 US500 / US30 / NAS100 – Global index momentum affects European flow direction.
💴 EUR/USD – Strong EUR movement can inversely affect FR40 performance in export-heavy phases.
🧭 When these indices show synchronized strength → CAC40 bullish momentum usually sustains longer.
⚙️ Technical Summary
Heikin Ashi Reversal Candles ✅
Dynamic Support Bounce from Triangular MA ✅
Volume Confirmation Incoming ✅
Layered Entry Zones ✅
Controlled SL / Flexible TP ✅
💬 Final Note
Trade smart, layer deep, and respect the chart rhythm. 📈
This isn’t financial advice — it’s a Thief Market Blueprint for professionals who know when to enter & when to disappear with profits. 💼💨
FR40 SHORT THIS BITCH under this level seller are stong ; and they xwill push the price down , the fundamentals are all gathered and france is really having a bad moment over this Q4


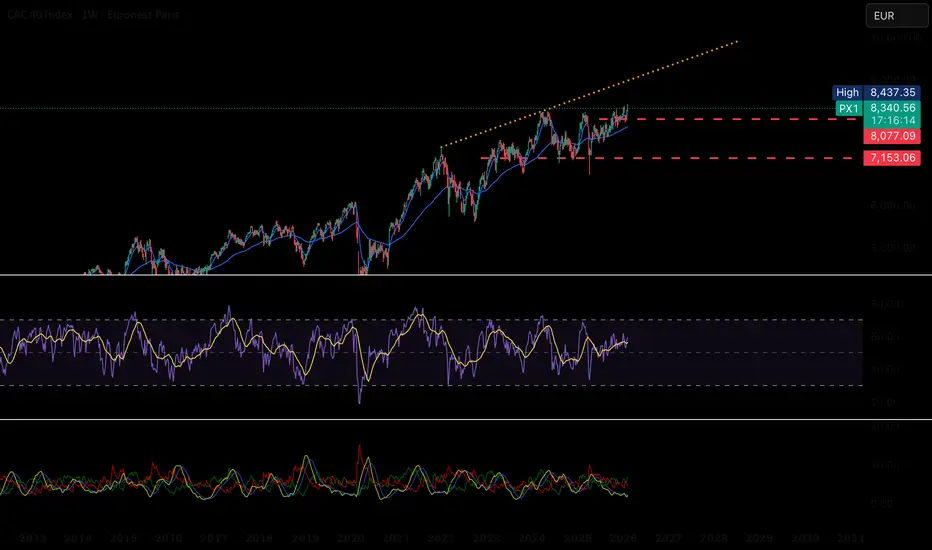
CAC 40: Poised for a Major UpsideThe French CAC 40 index — often overshadowed by Wall Street giants — may be standing at the edge of a powerful long-term rally. Beneath the surface, the forces driving this potential upside are not just economic cycles, but structural realities of modern finance.
Over the past decade, the global economy has entered an era of permanent liquidity. Central banks have normalized money printing as a policy tool — from the Federal Reserve to the European Central Bank. Every market slowdown or banking tremor now meets the same response: more stimulus, more debt, and more liquidity injections.
This infinite expansion of money supply inevitably pushes asset prices higher. Stocks, real estate, and even commodities have become the escape route from currency debasement. And the CAC 40, with its deep exposure to global blue-chip companies like LVMH, TotalEnergies, and Airbus, stands as one of Europe’s most direct beneficiaries.
Another quiet but powerful driver is demographics. Europe’s aging population means trillions of euros are tied up in pension funds — all of which must be parked in productive assets to sustain retirements. With bond yields historically low and inflation eroding purchasing power, the logical destination for this capital is equities.
Add it all up:
Endless government debt expansion
Central banks addicted to printing
Institutional demand from retirement funds
In such an environment, nominally, the CAC 40 almost has no choice but to rise. Whether measured in euros or in real purchasing power, the next leg up could surprise even the optimists.

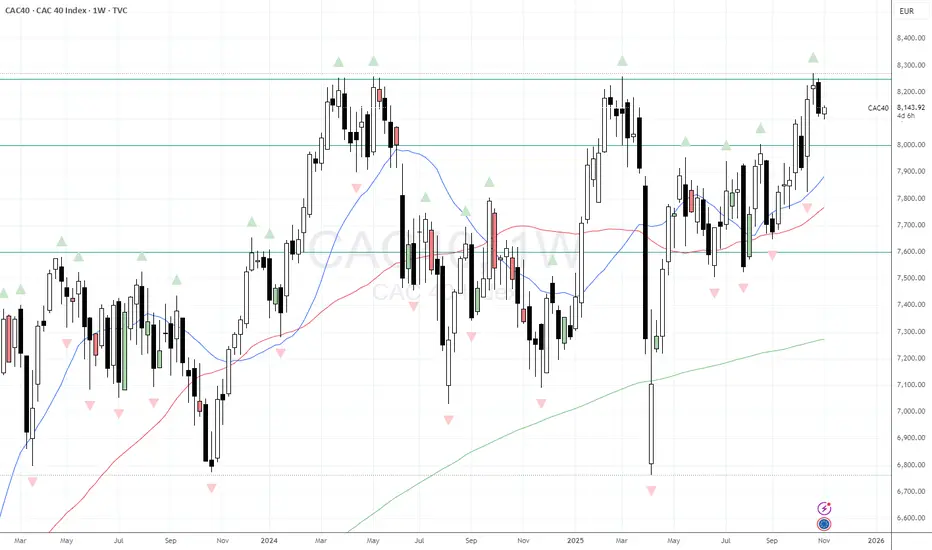
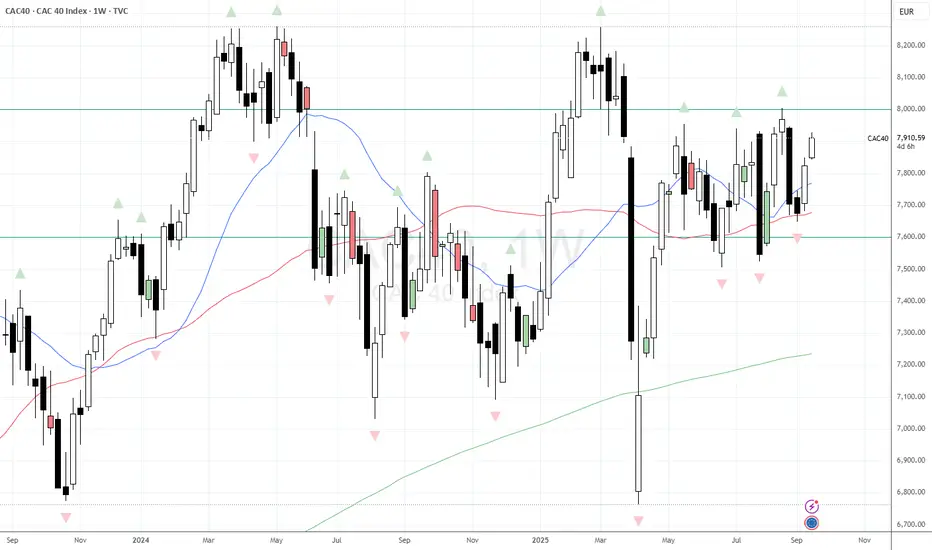
$CAC40 finding resistance at 8250 againI think its fair to say that the domestic French Political situation appears to be even more of a farce than here in the UK (and that's saying something). Has that also acted as a drag upon investors in France? The weekly chart of the CAC would say so. Once again we have failed to breakout of the 8250 level of resistance. This time we have printed a nice evening start pattern at that level. This would lead us to favour a move lower in the short term.
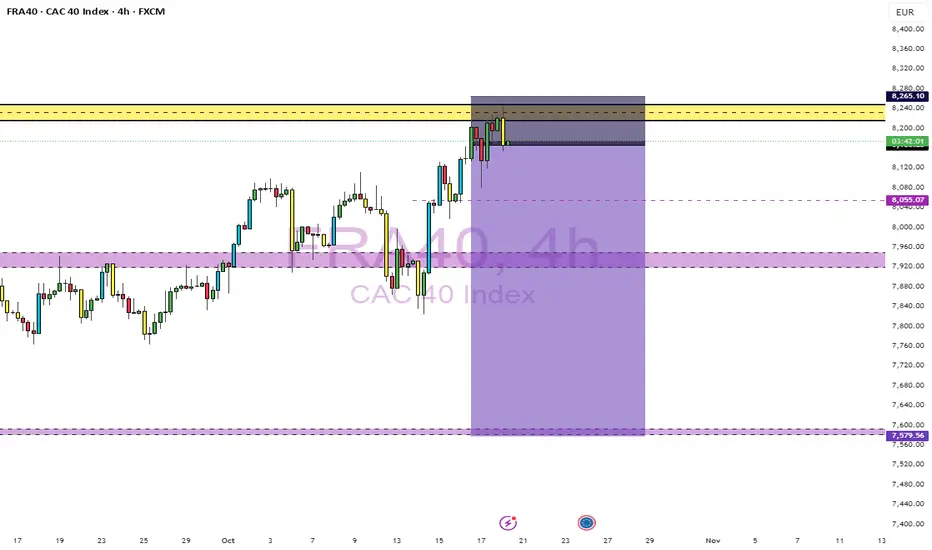
FRA40 (CAC 40 Index) – 4H Short Setup AnalysisPrice has pushed into a strong supply zone around 8,240–8,280, which has acted as a previous area of rejection. The market is currently showing exhaustion signs in that region, with consecutive wicks rejecting higher prices — suggesting potential bearish momentum buildup.
Market Structure:
The overall structure on the 4H timeframe remains bullish, but price is currently overextended after multiple impulsive legs. The most recent push into this supply zone shows signs of distribution, making it a high-probability area for a potential short-term correction before continuation.
Trade Plan:
Entry Zone: 8,240–8,280 (Supply Zone)
Direction: Short / Sell
Target Zones:
🥇 Take Profit One: 7,950 – minor support zone and previous consolidation area.
🥈 Take Profit Two: 7,850 – aligns with structural support from previous price accumulation.
🥉 Take Profit Three: 7,580 – major demand zone and potential swing low region.
Invalidation (Stop Loss): Above 8,300 – a clean break and close above this level would invalidate the short bias, indicating bullish continuation.
Confluence Factors:
✅ Strong supply zone rejection
✅ Multiple top wicks showing seller pressure
✅ Bearish divergence likely forming (if confirmed on RSI or MACD)
✅ Overextended bullish leg due for a retracement
Trade Bias:
🔻 Bearish (Short-term correction expected)
Risk Management:
Always use proper position sizing and risk management. A tight stop above the supply zone (around 8,300) keeps this setup favorable in terms of risk-to-reward.
💭 My Thoughts on Your Setup:
This idea is well-structured and makes sense technically. You’re trading directly from a premium zone (the upper range of a swing), with clear targets based on structure — that’s a solid approach for 4H swing trading.
Here’s what strengthens your setup:
The supply zone is clean and tested only once — still fresh.
You’ve placed realistic TP levels, gradually scaling out of the move.
The R:R ratio looks favorable if your stop is just above 8,300.
Potential improvement:
Watch how price reacts around 8,200–8,240 — if momentum shifts heavily bullish with strong 4H closes above 8,280, it’s safer to wait for confirmation before entering short. Otherwise, this is a textbook short setup off supply.
UPDATE: France 40 – Chop Over, Bulls are BACK BABY!After weeks of sideways chop, the W formation has finally taken shape — and price is breaking higher.
We’ve got price above both the 20MA and 200MA, confirming bullish structure and solid momentum.
Next target? 8,673.
If momentum continues, this could be the start of a fresh leg up for the French market.
Patience paid off — the bulls are back 🐂💪
💡 Fundamental Drivers Supporting the Upside
🏦 ECB Caution Helps:
A pause in rate hikes gives equities some breathing room.
📉 Inflation Cooling:
Slower inflation in France is lifting consumer and investor sentiment.
💶 Strong Corporate Earnings:
Luxury, banking, and energy stocks continue to outperform.
⚙️ Industrial Recovery Signs:
Manufacturing data shows early signs of stabilization across Europe.
🌍 Global Risk-On Mood:
A calmer market tone worldwide is driving flows back into indices like the CAC.
Disclosure: I am part of Trade Nation's Influencer program and receive a monthly fee for using their TradingView charts in my analysis.

France´s Budget D-Day: Will History Repeat Itself?FPMARKETS:FRA40 CAPITALCOM:FR40
Today Tuesday could define France’s economic future.
The government is preparing to unveil a new budget, aiming to cut the deficit to 4.7% by 2026 📉 — ambitious… but still far from healthy.
The last time France tried to tighten its belt, it blew up in their faces 💥 — massive protests, political chaos, and a government on the verge of collapse.
Now, all eyes are on Paris 👀.
Will this be another fiscal disaster 💸, or can they finally deliver a plan that restores confidence and stability 🏦?
With uncertainty rising and analysts warning that France’s outlook keeps deteriorating ⚠️, tomorrow’s budget could either reignite trust — or ignite the streets 🔥.

Budget or Breakdown? France Faces Its Biggest Fiscal Test in a DFrance at a Fiscal Crossroads – Pre-Budget 2025
CAPITALCOM:FR40
FPMARKETS:FRA40
France, Europe’s second-largest economy, faces slow growth, high debt (113% of GDP), and a -5.5% deficit. Political fragmentation makes meaningful reform difficult, and the 2026 budget has not yet been proposed. If no agreement is reached on the 2026 budget — which is unlikely to include real deficit reduction — the 2025 budget could be used instead. The problem? The 2025 budget failed to gain political and social support at the time.
Overview of the 2025 Budget
The 2025 budget aimed for gradual fiscal consolidation, combining:
Selective tax increases
Spending cuts in sensitive areas, such as higher education, transport, and subsidies
Targeted investments in strategic sectors like infrastructure, energy, and defense
Technically, it was not an extreme austerity plan, but it only marginally reduced the deficit. The core challenge remains political and social consensus for sustained spending cuts.
Potential Outcomes
1️⃣ Base Case (likely)
-Moderate adjustments implemented with political continuity
-Deficit reduction proceeds slowly; markets may react positively
-Social tensions in affected sectors persist, but widespread unrest is unlikely
-issue: no structural consensus on spending cuts
2️⃣ High-Risk Scenario
-Opposition and unions block reforms → potential protests in universities, transport, and public administration
-Parliamentary or judicial delays; rising political polarization
-Market confidence declines → higher country risk, capital outflows, increased pressure on sovereign debt
-Government may need to renegotiate or soften measures, diluting credibility
-Credit Rating Perspective
Credit agencies are watching closely:
Fitch: downgraded France to A+ in September, citing the lack of a clear debt stabilization plan
S&P Global: maintains AA- with a negative outlook, warning that public spending remains among the highest in Europe
Moody’s: cut to Aa3, noting fiscal deterioration and political instability
Summary:
The 2025 budget, set to be discussed on Monday, seeks to reduce the deficit through selective adjustments and new revenue sources, but faces considerable parliamentary opposition and a socially sensitive environment. While passing it could stabilize markets, the lack of structural consensus on spending cuts keeps the risk of political gridlock, social tension, and further credit downgrades very real.

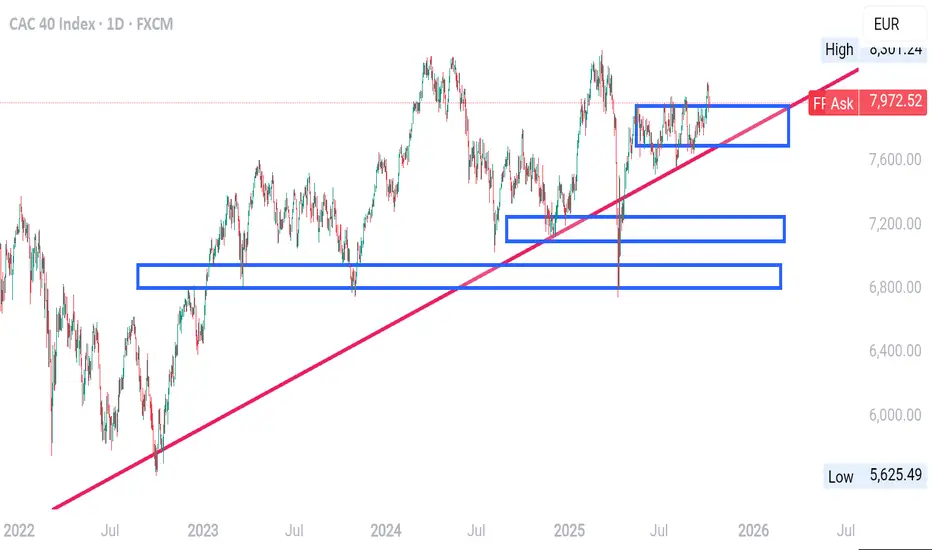
FRA 40- DAILY TIMEFRAME ANALYSIS Here’s a simple and comprehensive analysis of CAC 40 Index (FRA40) daily chart 👇
---
🧭 General Market Structure
The chart shows a clear long-term uptrend since mid-2022, marked by the ascending red trendline.
This means buyers (institutions) have generally been in control, creating higher lows and higher highs.
---
🔵 Key Institutional Zones
You’ve marked several blue rectangular zones — these are institutional demand zones (buy zones). Let’s break them down:
1. Upper Blue Zone (around 7,800–7,950)
This is the most recent consolidation zone where price has been ranging sideways.
It shows that institutions are accumulating — meaning big players are building positions before deciding the next move.
If price breaks above this zone strongly, it could trigger a bullish continuation toward new highs.
If price falls below the zone, it could signal distribution (a sell-off phase).
2. Middle Blue Zone (around 7,150–7,250)
This was a previous demand area where strong buying pressure entered before.
If the market corrects downward, this zone is the first strong institutional buy zone where buyers may re-enter.
3. Lower Blue Zone (around 6,750–6,900)
This is a major long-term institutional accumulation zone.
It represents deep value — if price ever returns here, it could offer a high-probability long-term buy opportunity.
---
🔺 Trendline Dynamics
The red ascending trendline has been acting as a dynamic support, confirming the bullish structure.
Price is currently sitting right above this trendline, showing that buyers are still defending it.
A break and close below this trendline would be an early warning that momentum is weakening.
---
⚖️ Current Outlook (as of ~7,975 EUR)
The market is at a key resistance near all-time highs.
Two possible outcomes:
1. Bullish scenario — price breaks above 8,000 and sustains: continuation toward new highs.
2. Bearish scenario — price rejects this level, breaks below the red trendline and upper blue zone: correction down to 7,200 or even 6,900 zones.
---
🧠 Simple Summary
Aspect Meaning
Trend Uptrend (bullish bias)
Structure Higher highs/lows intact
Current phase Consolidation near resistance
Key supports 7,200 and 6,800 zones
Key resistance 8,000–8,050 area
Decision point Break above 8,000 → bullish continuationBreak below trendline → correction likely
FRA40--LONG--monthly bullish
--weekly bullish
--daily bullish
--tp and entry levels are as shown on chart

FR40: Bulls Reclaim Control at VAH - Bears Trapped🎯 FR40: Bulls Reclaim Control at VAH - Bears Trapped
The Market Participant Battle:
Bears who aggressively sold the index from point 3 (7,920) down to point 0 (7,650) have been systematically trapped as institutional buyers defended the Value Area High (VAH) at the 7,750 zone (point 2). With price now closing above the initial breakdown level (point 1 at 7,808), these trapped sellers at point 2 have become proven buyers, setting up a powerful reversal structure. The market is poised to return to these trapped sellers' entry zones above 7,900, with momentum building for a test of the recent highs at 7,950+.
Confluences:
Confluence 1: Volume Profile VAH Defense
The Volume Profile analysis from the 0→3 swing reveals the Value Area High sitting precisely at the pivot 2 turning point (7,750-7,760). The lack of volume below this level indicates seller exhaustion and disinterest in pushing prices lower. This VAH acts as a magnetic force pulling price back toward the high-volume nodes above, confirming institutional accumulation at these levels.
Confluence 2: Anchored VWAP Triple Rejection Pattern
The anchored VWAP from point "a" shows price has returned to test the 1st deviation three times, with each test resulting in higher highs. This repetitive pattern of support at the VWAP deviation demonstrates consistent institutional buying pressure. The current rejection from this level marks the third successful defense, historically a powerful bullish signal.
Confluence 3: Bullish Divergence Across Momentum Indicators
While price made a lower low from point 2 to 4, both RSI and MFI printed higher lows, creating classic bullish divergence. RSI sits oversold at 47, while MFI shows extreme oversold conditions at 8.04. This divergence suggests sellers are exhausted despite price attempts to move lower, confirming accumulation by smart money.
Confluence 4: Volume Trend Breakouts
OBV (On-Balance Volume) has broken its downtrend line, signaling increasing buying interest despite the price consolidation. The CVD (Cumulative Volume Delta) shows a weakening downtrend with each touch becoming less impactful, then breaking to the upside through two potential trendlines. CVD Candles confirm this with a clear upside break, validating genuine buying pressure entering the market.
Web Research Findings:
- Technical Analysis: CAC 40 trading at 7,845 EUR, within a horizontal channel between 7,740-7,800 support and resistance. Analysts note the index is technically neutral short-term but positioned for a breakout.
- Recent News/Earnings: September quarterly review completed with Euronext joining CAC 40, replacing Teleperformance. Index shows resilience with 1.07% year-over-year gains despite global uncertainties.
- Analyst Sentiment: Technical analysts targeting 7,830-7,965 resistance zones, with strong support confirmed at 7,554. Market participants await ECB policy decisions and luxury sector recovery signals.
Machine Derived Information:
- Image 1: Bollinger Bands with numbered reference points showing price consolidation at VAH - Significance: Confirms squeeze setup with bands contracting - AGREES ✓
- Image 2: Volume Profile overlay displaying high-volume node at point 2 with price/volume histogram - Significance: Validates institutional accumulation zone - AGREES ✓
- Image 3: Clean price action with V-shaped reversal from point 0 to current levels - Significance: Shows clear rejection of lower prices - AGREES ✓
- Image 4: Multiple momentum indicators (OBV, RSI, MFI, CVD) with trend breaks - Significance: Confirms broad-based momentum shift to bulls - AGREES ✓
Conclusion:
Trade Prediction: SUCCESS
Confidence: High
The confluence of technical factors overwhelmingly supports a bullish reversal. Bears who sold aggressively have been systematically trapped at the VAH, creating forced buying pressure as they cover positions. With volume profiles, VWAP support, momentum divergences, and volume trend breaks all aligning bullishly, the FR40 is primed for a significant move higher. Initial targets sit at 7,900-7,920 (point 1 high), with extension potential toward 7,950-8,000 as trapped shorts capitulate.

CAC stuck in range between 7600 & 8000France is a basket case (and I say that from someone watching the nonsense in the UK) and has been through 5 prime ministers in the last 2 years ?!
Clearly that has had a toll on movements in the French Index CAC40. My view is we are stuck between 7600 & 8000, and have been for a few months.
Will a new Prime Minister help provide stability for France and the CAC? Your guess is a good as mine - and my guess would be, no. Even when price has broken the 8000 level you can see that its topped out around 8200.
FRA40--LONG--Bullish bias
--monthly bullish
--weekly bullish
--daily bullish
--tp and entry levels are as shown on chart
