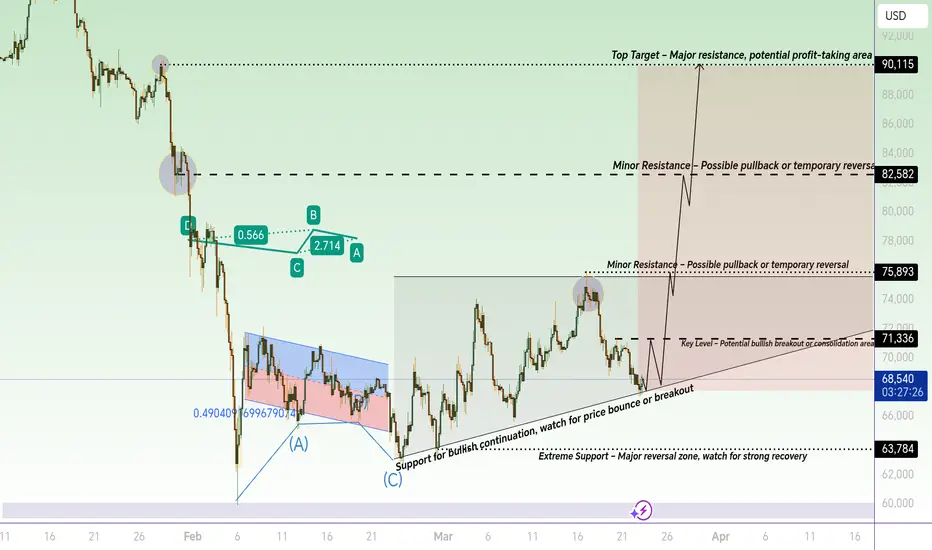
BTC / USD – Key Levels & Potential Bullish SetupBTC is forming strong support around 68,461 with an ascending trend line indicating potential bullish continuation. Watch for key breakout above 71,336 for upside momentum targeting 75,893, 82,582, and the top target at 90,115. Minor resistance zones may cause temporary pullbacks; monitor price action for confirmation and profit-taking opportunities. Extreme support at 63,784 could offer strong reversal potential if tested.
In-depth trading ideas
You're Not Reading the Chart. You're Defending It.
Technical Analysis Doesn't Work. And Here's Why That's Your Mistake
The chart told you everything. You just didn't want to hear it.
That's not a market problem. That's a you problem - and it has a name.
Confirmation bias. Most people reading this are committing it right now. The ones who just thought "not me" - those are exactly the ones I mean.
You open the chart already knowing you want to buy. From that moment, your brain operates as a lawyer, not a judge. Bullish divergence on RSI? Noticed. Potential double bottom? Noticed. Bearish engulfing on the daily? Missed. Volume declining into the rally? Didn't see it.
This is the architecture of the mind. It is not a flaw you can fix with discipline alone. You cannot fix it until you start your analysis from the opposite end of the chart entirely.
━━━━━━━━━━━━━━━━━━━━━━━━━━━━━
Three moments in Bitcoin's history where the crowd saw one thing and the market did another
November 2021. BTC breaks $69,000. Everyone sees a flag on the weekly, targets $100,000. I was looking at the same chart and seeing Wyckoff distribution - the same signals, interpreted through a different lens. The majority didn't want to see it. Bitcoin spent the next 12 months collapsing to $15,500.
January 2023. BTC recovers to $23,000. "Bear market is over." "New bull cycle." I wrote at the time: this is a bear market rally, not a reversal. Those who saw what they wanted to see bought at $23,000 and sold at a loss a month later.
September 13, 2025. BTC at $95,000–$100,000. I closed all positions and published a post: the bull market is over. (The post is on my TradingView profile - the date is there, the words are there.) Three months later, those who saw only upside had lost 30–40%. This is not a claim. It is a record.
━━━━━━━━━━━━━━━━━━━━━━━━━━━━━
One shift that changes everything
Stop building analysis from a thesis. Build it from falsification.
Before entering any trade, ask yourself one question: what would have to happen on this chart for me to admit I was wrong?
Most traders cannot answer this. They enter without knowing when they're wrong. That's not analysis - it's gambling with a professional aesthetic.
Real analysis starts with locating liquidity. Where are the stops? Where does the market need to go to collect liquidity before the real move begins? When you look at a chart through this lens, you stop seeing patterns and start seeing mechanics.
━━━━━━━━━━━━━━━━━━━━━━━━━━━━━
What this looks like on the current chart
Right now, BTC is trading around $67,000. The majority sees a correction. A temporary pullback - before the continuation. That's the consensus. And the consensus is almost always where the liquidity sits.
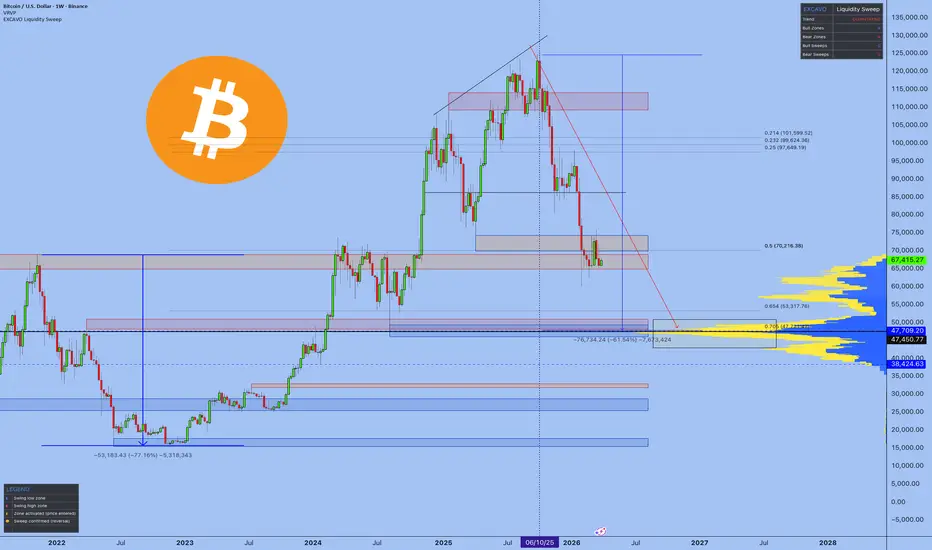
On the weekly chart, the picture is different. My Liquidity Sweep indicator (available on my TradingView profile) shows activated bearish zones. Price has left the distribution range ($95,000–$120,000) and is moving structurally lower. The red arrow on the chart is not a scare tactic. It is mechanics.
Where are the stops of everyone "buying the dip"? Clustered directly below current support. The key liquidity zone: $47,000–$50,000. That is where the market needs to go before any credible case for reversal can be made.
Where BTC goes from here - the market will answer. What I'm telling you is this: traders buying the "correction" have already decided. They're not reading the chart anymore. They're reading permission slips.
━━━━━━━━━━━━━━━━━━━━━━━━━━━━━
Anti-bias checklist before entry
Write these down. On paper. Not in your head.
1. What do I see on this chart that argues against my idea? If you can't find one thing - you're not analyzing. You're praying.
2. Where are the stops of traders who think exactly like me - and is there a scenario where the market sweeps those stops before going where I expect?
3. If I were already positioned against this trade, what would I see?
4. What is the specific level - not a range, a level - at which I will say: I was wrong?
If you cannot answer question four, do not open the position. The market does not care about your thesis.
━━━━━━━━━━━━━━━━━━━━━━━━━━━━━
Here is a paradox worth writing down and taping above your monitor:
The most dangerous trader is not the one who ignores technical analysis. The most dangerous trader is the one who has mastered it — and uses that mastery to justify what he already wanted to do.
Knowledge gives you more tools to build a case. It gives you no immunity from building the wrong one. The more you know - the more convincing your mistake sounds.
Technical analysis works. It works very well. Just not in the hands of a trader who uses it to confirm a decision made before the chart was even opened.
Best Regards, EXCAVO
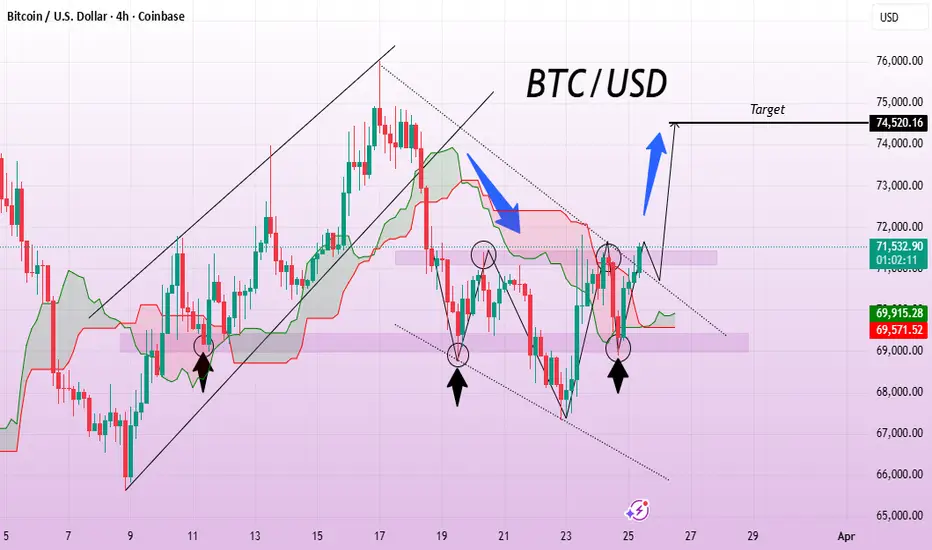
Bitcoin Preparing for Possible Upside SurgeThe chart shows Bitcoin trading within a descending channel after a strong bullish rally 📊. Price has respected the highlighted support zone multiple times, forming higher lows and signaling growing buyer strength. Currently, price is consolidating near mid-range resistance with small rejection wicks visible 👀. The bearish momentum appears to be weakening as price pushes toward the descending trendline. A confirmed breakout above this resistance could trigger a bullish continuation. If buyers sustain momentum and volume increases, the upside move may accelerate 🚀. The next key level to watch is 74,520, which acts as a major resistance target in this setup.
If you found this XAUUSD analysis helpful, don’t forget to LIKE 👍 and COMMENT 💬!
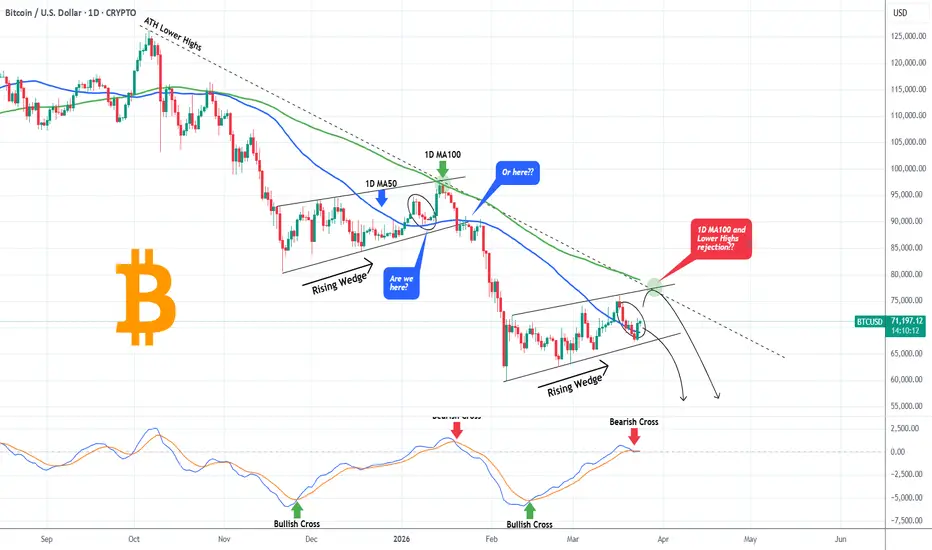
BITCOIN Last rally or straight lower?Bitcoin (BTCUSD) is currently around its 1D MA50 (blue trend-line), trading within a Rising Wedge pattern since the February 06 Low. This resembles the pattern of December - January that eventually broke downwards after a test-rejection on its 1D MA100 (green trend-line) and the Lower Highs trend-line from the All Time High (ATH).
The 1D MACD though has made a Bearish Cross already, which is however close to be negated following yesterday's Trump announcement on the 5-day ceasefire. Last time that happened was on January 19, after the 1D MA100/ Lower Highs rejection.
So are we within an early January consolidation or after a new Top? Whatever the situation may be, BTC seems to be constrained to a max cap around $77000 and as April begins should technically start the new Bearish Leg as per this dominant Bear Cycle pattern.
So what do you think? Are we going to see a final rally before rejection or straight break to lower prices? Feel free to let us know in the comments section below!
---
** Please LIKE 👍, FOLLOW ✅, SHARE 🙌 and COMMENT ✍ if you enjoy this idea! Also share your ideas and charts in the comments section below! This is best way to keep it relevant, support us, keep the content here free and allow the idea to reach as many people as possible. **
---
💸💸💸💸💸💸
👇 👇 👇 👇 👇 👇
Bitcoin Denial Coming(Not financial advice)
Leave a comment please.
Once this bear flag breaks, the 1:1 target is ~41,000.
The price structure has turned bearish, Finally.
I'm highly confident in this one.
I'm not sure that Bitcoin believers have entered into the "Denial" phase, but I think that is next. See here if you don't know what I am referring to.
priceactionninja.com
Expect a large rally from 41k or somewhere around there.
That said, I don't expect 41k to be the bottom, UNLESS the Federal Reserve 180's and starts emergency QE programs. THAT is when Bitcoin bottoms.

The 90 Day Mission That Will Change Your Trading ForeverI know people will attack me for this. But, it's possible if you really want something and you isolate yourself and put all the focus and energy in to it. You can make it. Today I will give you exact plan how I would do it, if I have to start from scratch.
1️⃣ First of all stop believing someone has a magic secret formula to be 100% right on the markets. Strategy that makes you rich in a week and solve all your financial problems? No one has it. It doesn't exist.
You want Lambo? Ok, materialistic goals can be also driver of your inner motivation, but it's not gonna happen in 90 days. Im talking about learning to trade in 90 days. Not getting rich. 2️⃣ Trading Random Patterns – Price Action Overfitting
If you’re trading random patterns and every trade has different logic, then you don’t have an edge. Random trading logic = random results.
‼️ Knowing all these 👇 and fitting them to the chart is not trading edge. Im not saying, these patterns cant work, but you must focus to the one and become a master. Not randomly choosing what fits to the chart today and taking trade on different logic tomorrow.
‼️ If your strategy is trading random patterns you know,
You can’t measure strategy performance. ⏩ What you can’t measure — you can’t improve or backtest. ⏩ And that means you’re don't have statistical data - its core of all problems.
💊 Solution:
Whatever pattern you like - Head and Shoulders, Triangle, Wedge, Channels, Cup and handle. Whatever but pic one, defined step by step process how you will be trading it. And always use mechanical aprocah how you will be trading it. Narrow criteria for every element of a trade to eliminate subjective decisions.
🛡️ You should have :
• Defined your pattern
• Method to define key levels
• Fixed method how to define a trend
• Fixed method how to trade continuation with your pattern
• Fixed method how to trade reversal by using your pattern
Define one trading pattern ( 1 kick ) Practice it 10 000 times become master 👇 For your inspiration, you can check this strategy, its eliminating subjective decisions.
🔗 Click the picture below to learn more. 👇 Approach information I gave above as Bruce Lee : Adapt useful, Reject useless and something specifically your own.
-----------------------------------------------------------------
If you are really committed and not here just for trying but you want it from your heart here it the Plan for the next 90 days for those who has 9 - 5.
1️⃣ Lets Cut Distraction's
❌ 1 . Adjust your phone - Social media and set Do not disturb permanently
Delete the apps or block them during your work window. I know it can feel hard, but harder it feels more you need it. Social media and short term content is distraction loop. During the mission Im cutting it completely and I go to this device. In normal life ( I have 30 minutes planned window) Social media are not bad if you visit them with intention. Just for curiosity put phone usage timer on your main desktop you will see how much time you waste daily if its more then 90 minutes, you got it. Thats whats holding you back.
❌ 2. Reduce Social Activity
When I am in Monk mode, I say no to most social stuff for a short period of time. No parties, Bar meetings and Alcohol. Not even meeting for coffee. As Im father then family duties must stay. That is non negotiable. But outside of that, I shrink my interactions down to almost zero unless the meeting clearly helps my Monk mode goal. Example
❌If I am focused on passing a prop challenge or backtesting some element I want to add to my strategy and someone invites me to a weekend full of drinking and late nights, it is a hard no.
✅If a trader that also trades same strategy invites me to a serious work session to review data or refine something, I will go. That supports the mission.
❌ 3. Cut porn and junk dopamine completely.
This is the uncomfortable part almost nobody wants to talk about, but it matters.If you are constantly stimulating yourself with porn and random adult content, your brain is fried with dopamine. Your focus span goes to zero. Your discipline collapses.
• No porn
• No “thirst trap” scrolling
• No mindless sexual content
• No dating apps
This should not be only for a monk mode. Porn is cancer for your focus cut it out from your life completely. After a few days without this junk, your energy levels change. You wake up more driven. You sit at the charts and you actually want to work. You start feeling like a hunter again, not a zombie.
❌ 4) Cancel Netflix and stop Watching news
Netflix is waste of time. Same is for the news. It doesn't matter knowing what orange mans says or how some sport results ended. You need to focus on your project
2️⃣ Once you ready to cut all above - Lets make a plan now
📅 Plan for people those who has 9 - 5 job
First start with your calendar and plan everything 90 days in advance when and where you will be doing your activities that will take you further in the trading. Now lets go here is activities
✅ 1. One Project — Your Core Mission 🎯
This is your main quest, for next 90 days it is powerful, because it removes decision fatigue it could be:
• Watching the educational Videos and making notes
• Backtesting 300+ trades of one model
• Building your strategy framework properly
• Creating your full trading plan
• Fixing your routine and sticking to it
Rules:
• Defined Activities - Mission
• Work on it daily
• Don’t switch
• Clear finish line ✅ 2. One book 📖
School didn’t prepare you for trading. You have to learn the parts nobody teaches:
• Mindset
• Psychology
• Discipline
• Focus
• Execution
• Stoicism
• Peak performance
30 minutes a day is enough.
Books give you depth. Unlike social media gives you shallow noise of social feeds. I suggest you Atomic Habits - from James clear if never read it. Also FLOW from Mihaly Csikszentmihalyi
✅ 3.One meditation - to reset your mind 🧘♂️
Meditation is like a gym without weights. I keep it simple. Twenty minutes every day, but you can start with 10 minutes if you didn't meditate ever. You can find some guided meditations on YouTube. But, dont let yourself catch in to a trap by scrolling and finding meditation. Prepare one in advance and put It to the playlist or just:
• Sit down
• Close your eyes
• Focus on your breath
• Let thoughts pass without judging or chasing them
Meditation help you regain control over your attention
✅ 4..One workout 💪
You can do either gym or calisthenic training. But not hard cardio, rather resistance training that builds strength. Instead of cardio you got walks. When Im in the monk mode I do Powerlifters training. Its simple, it increases your strength and I do not have to think about training complexity to much. I just come to the gym and finish my session in 45 minutes.
Measure you max weights and add 10%. Then start with 60% of the weight and add 5% every week. You can do more complex weight progression after 4 weeks but that would be for whole article. Search for Stefan Corte Powerlifting training. But dont overthink it. In Monk mode you want stupid repetitive routine.
Squats 6 x 6 - 60% - 65% - 70% - 75%
Bench 6 x 6 - 60% - 65% - 70% - 75%
Deadlift 6 x 6 - 60% - 65% - 70% - 75%
👉 Train hard 3 times a week - Mo / We / FR .. take a break on the weekends.
👉 Other 3 days focus on mobility training and stretching
👉 Take a break one day
Don't forget for 10 minutes warm
Do proper stretching after the training session.
✅ 5. Long walks (No phone , No music) 🚶♂️🌲
Long walks for clarity and aha moments. I go out for around 60 minutes, ideally in nature, with no phone and no music. Just walking, being present and thinking on my project
TIP - if you go for walk on the mornings and fasted, you body will take energy from fats.
As you are in the mode when focusing on project. Ideas begin to connect. You ll start seeing patterns, solutions, better rules. Many parts of my strategies, my routines, even my lifestyle changes were born on these walks.
✅ 6. Eat like an athlete, not a garbage bin 🥦
Food is another big lever. On your mission work in a light, fasted state during the main focus hours. I have my first real meal after I finish my most important work for the day. Before that I of course drink water, but nothing that spikes blood sugar. Because when you are full, heavy and bloated, your brain slows down. That is the last thing you want when you need to do deep work.
Keep it simple
1. Protein
2. Good carbs
3. Healthy fats
4. Minimal junk
Obviously in normal life I sometimes eat in Mc Donald or have Popcorn when taking daughter to the cinema. But No pizza and chips, No such a things in Monk mode. You are trying to become sharp, not sleepy.
🎯 Thats all easy said but how to do it.
You will most likely fail in the discipline, but it doesnt mean you cant start again over and over. Adjust your schedule, when you remove Netflix, Social media and contacts you gain new time, but you will have to put it somewhere in a day. I highly suggest to make it on the morning because after work you will be tired and your focus will not be so sharp.
You can do it , I believe in you. It's not possible to be on a Mission for whole year but you can disappear for some time and level up few times in a year. Im still doing it time to time when Im working on myself in trading, fitness or something in personal development.
David Perk
🟣 I promised myself I’d become the person I once needed the most as a beginner. Below are links to a lessons I shared on Tradingview. Hope it can help you avoid years of mistakes, trial and errors I went thru.
📊 Sharpen your trading Strategy
⚙️ 100% Mechanical System - Complete Strategy
🔁 Daily Bias – Continuation
🔄 Daily Bias – Reversal
🧱 Key Level – Order Block
📉 How to Buy Lows and Sell Highs
1️⃣ CLS Model 1 Explanation
2️⃣ CLS Model 2 Explanation
⚡ Order Block Master
🔮 FVG Mastery
💯 Institutional Levels
⏰ 9:30 Strategy
🎯 Dealing Range – Enter on pullbacks
💧 Liquidity – Basics to understand
🕒 Timeframe Alignments
🚫 Market Narratives – Avoid traps
🐢 Turtle Soup Master – High reward method
🧘 How to stop overcomplicating trading
🕰️ Day Trading Cheat Code – Sessions
🇬🇧 London Session Trading
🔍 SMT Divergence – Secret Smart Money signal
📐 Standard Deviations – Predict future targets
🎣 Stop Hunt Trading
💧 Liquidity Sweep Mastery
🔪 Asia Session Setups
📀 Gold Strategy
🧠 Level Up & Mindset
🛕 Monk Mode – Transition from 9–5 to full-time trading
⚠️ Trading Enemies – Habits that destroy success
🔄 Trader’s Routine – Build discipline daily
💪 Get Funded - $20 000 Monthly Plan
🧪 Winning Trading Plan
⭕ Backtesting vs Reality
❌ Don't Fear Being Wrong
✅ Advice For Beginners
🛡️ Risk Management
🏦 Risk Management for Prop Trading
📏 Risk in % or Fixed Position Size
🔐 Risk Per Trade – Keep consistency
🧪 Risk Reward vs Win Ratio
💎 Catch High Risk Reward Setups
☯️ Smart Money - Who control Markets
🔱 Risk Reward vs Win rate
⚠️ CLS Risk Management
💊 Survive Loosing Streak

BITCOIN This secret sequence of Channels unlocks the Cycle codeBitcoin (BTCUSD) is technically half-way through its Bear Cycle by all known metrics, both in terms of price and time. What we haven't shown you yet (actually we have published this thesis 6-7 years ago and it's since been forgotten) is the underlying Channel Up approach on a Cycle horizon that has gone unnoticed to most.
As you can see, ever since its first complete Bear Cycle in 2011, BTC has been forming Channel Up patterns ending at the bottom of the next Bear Cycle.
- Channel Up 1: 2011 - 2014
- Channel Up 2: 2014 - 2018
- Channel Up 3: 2018 - 2022
- Channel Up 4: 2022 - now
Right now we (obviously) are on the Bear Cycle that will complete Channel 4. It's bottom, based on this model, is projected to be within the 0.5 Fibonacci retracement level from the previous Cycle bottom and a potential -70% decline. Which translates to a Bottom range within $45000 - $37500.
That's because Channel Up 1 bottomed above the 0.382 Fib, while the next one (Channel Up 2) bottomed exactly on it. Channel Up 3 broke below the 0.383 Fib and bottomed just above the 0.5 Fib, so similarly the next one (Channel Up 4) should bottom on the 0.5 Fib (at least). The -70% estimate is derived by the -7.00% decreasing rate that each Bear Cycle had compared to the previous one (exception the 2018 Bear Cycle).
Additionally, the $45k Target would be within BTC's 1W MA350 (red trend-line) and 1W MA500 (black trend-line), as since 2018 every Bear Cycle bottom is -150MA lower.
So what do you think? Is this Channel sequence Bitcoin's code breaker?? Feel free to let us know in the comments section below!
---
** Please LIKE 👍, FOLLOW ✅, SHARE 🙌 and COMMENT ✍ if you enjoy this idea! Also share your ideas and charts in the comments section below! This is best way to keep it relevant, support us, keep the content here free and allow the idea to reach as many people as possible. **
---
💸💸💸💸💸💸
👇 👇 👇 👇 👇 👇

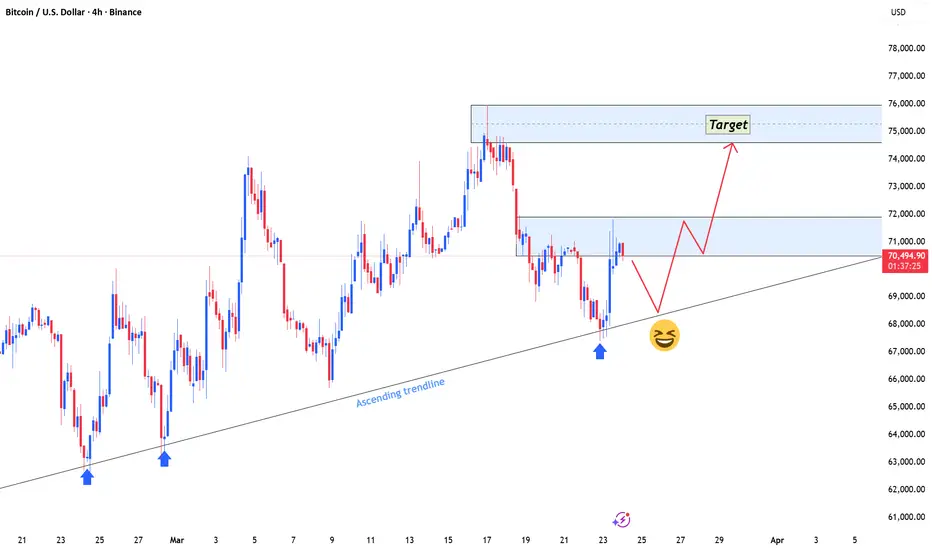
Bitcoin’s Uptrend Remains Intact – Sellers Are Being AbsorbedFrom my perspective, Bitcoin is clearly leaning toward a short-term bullish trend, as both recent news and the current technical structure reinforce the case for further upside.
On the fundamental side, the recent easing of geopolitical tensions has acted as a subtle yet decisive catalyst, shifting market sentiment back into a risk-on environment. This transition is particularly favorable for Bitcoin, which typically performs well when uncertainty fades and capital rotates into higher-risk assets. More importantly, the market’s reaction confirms this narrative: price moved higher and, crucially, held those gains without any meaningful pullback — a strong signal that demand is not only present but also resilient.
From a technical standpoint, the chart reflects similar strength. Price continues to respect the ascending trendline and is now stabilizing above it, while the $70,000 region is gradually transitioning from a former resistance into a developing support zone. Instead of rejecting price, this area is beginning to attract buyers, suggesting that selling pressure is being absorbed rather than expanding.
In this context, any short-term retracement toward the trendline or the 69K region would be viewed as a structural retest rather than a shift in direction. As long as the market holds above this support zone, the broader bullish framework remains intact, opening the path toward higher levels around 72K, with potential extension toward the 75K region.
As long as the trendline remains intact and the 69K–70K zone continues to act as support, the short-term outlook stays constructive. At this stage, pullbacks are not signs of weakness — they are simply part of a broader process in which the market builds the foundation for its next upward expansion.
Bitcoin - Retesting the ultimate support area!🚀Bitcoin ( CRYPTO:BTCUSD ) has to reject the final support:
🔎Analysis summary:
Bitcoin clearly remains in an underlying strong bullrun. And looking at the higher timeframe, Bitcoin is just creating another bullish all time high break and retest. We just have to see bullish confirmation very very soon in order for Bitcoin to start the next rally.
📝Levels to watch:
$60,000
SwingTraderPhil
SwingTrading.Simplified. | Investing.Simplified. | #LONGTERMVISION

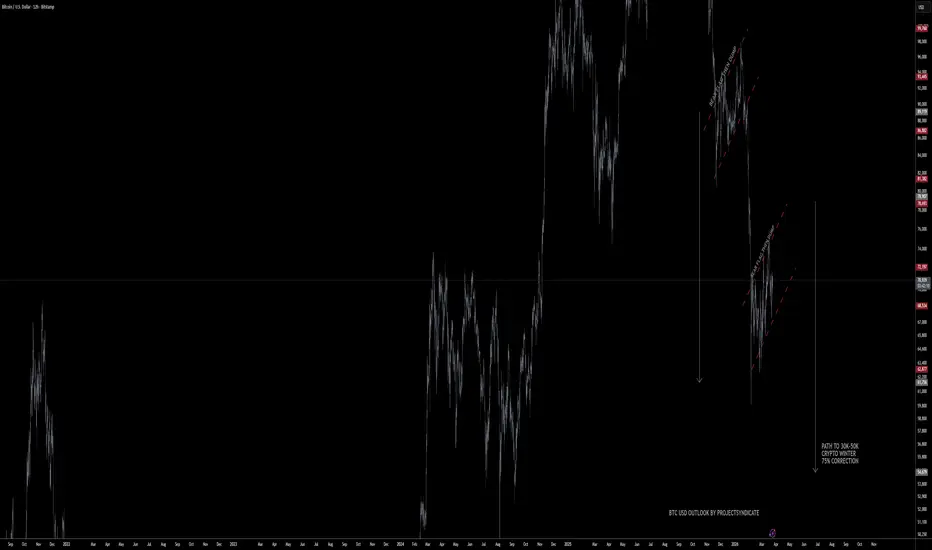
BTCUSD Update: Bear Flag in Progress / Expect more weaknessOutlook remains unchanged, bear flag on bear flag setup, expecting more range
locked price action but then correction resumes. target is unchanged overall.
❄️ 2026 Crypto Winter Forecast: Bitcoin is expected to experience a sharp correction (~75% drawdown) following the 2024 halving. The cycle peak could reach ~$123k, with a low near $30k, consistent with past Bitcoin bear markets.
⏳ Market Dynamics: Post-2024 halving, Bitcoin’s supply reduction likely fuels a major price spike into 2025, driven by retail, leverage, and institutional FOMO. By mid-2025, Bitcoin reached new highs (~$120-126k), marking the late-stage, euphoria-driven market.
🚨 Contrarian Signals: Excessive leverage (e.g., 1001x on Aster DEX) and speculative meme-coin mania (BNB Chain) signal a market top, aligning with prior cycles where such behaviors marked the end of bullish phases.
🧊 Drawdown Explanation: A 75-80% correction, bringing Bitcoin down to ~$30k, is a historical norm, driven by factors like ETF inflows slowing, leverage unwinding, and macro risks. While Bitcoin matures as an asset, liquidity cycles will still result in substantial drawdowns.
🛡️ Support at $30k: Key institutional holders (ETFs, treasuries) may defend Bitcoin positions around $30k, setting a floor above previous lows. Bitcoin’s realized price (long-term average) also rises, which further supports the floor.
🧭 Timing: Following the 2024 halving, major peaks and a 2026 winter align with Bitcoin’s typical cycle pattern: a 2025 distribution phase followed by a 2026 price correction.
🧱 Winter Market Stress: High leverage (e.g., Aster DEX) could cause cascading liquidations, and smaller altcoins/meme assets are expected to crash significantly, with many never recovering. Marginal miners will also exit, deepening short-term pain but setting the stage for the next cycle.
In summary, the Bitcoin market is set for a dramatic bear phase around 2026, with a major correction following a typical halving-driven peak. This cycle’s "crypto winter" is expected to be painful but not catastrophic, with the $30k mark serving as a potential support level. ❄️
Expanding Megaphone Structure Hinting at Explosive BTC MoveBTC is forming a Bullish Megaphone Pattern, signaling expanding volatility with higher highs and higher lows, a classic setup before a major impulsive move.
After sweeping the lower boundary, price is now reclaiming strength and pushing back into the structure. This shift hints at buyers stepping in aggressively from discount zones.
If price continues respecting the pattern and breaks above the upper resistance, it opens the door for a strong expansion toward the 140K region and potentially higher.
As long as the lower boundary holds, this structure favors continuation to the upside. The wider the swings, the stronger the breakout tends to be.

Bitcoin Price Analysis – Key Support and Resistance LevelsThis chart provides a comprehensive technical analysis of Bitcoin (BTC/USD), highlighting critical support and resistance zones. The Key Resistance at 83,724 USD is a major level where price may face strong rejection. Intermediate Resistance at 76,127 USD is another potential barrier to watch for possible reversal or continuation. The Current Market Price at 71,295 USD is a key area to monitor for breakout or price action.
On the downside, Critical Support at 63,071 USD and Strong Support at 59,955 USD are vital levels where price could reverse. If the market breaks below these levels, Lower Support at 55,907 USD represents the final strong support zone.
The Downward Trend Channel indicates the overall bearish market momentum, suggesting that further downward movement may be possible unless the price breaks key resistance levels. Traders should keep an eye on these levels for potential breakouts, reversals, or continued bearish trends.

Channel Trading SetupThe H4 TF on BTC has been creating a perfect bullish channel and right now we're at the base of the channel which signal a huge buy opportunity. I will be looking for a nice bullish candle formation pattern on either H1 or M30 to take the trade anytime soon.

BITCOIN The bad part hasn't even started based on the USD??This is no secret. We all know it. Bitcoin (BTCUSD) tends to rise when the U.S. Dollar Index (DXY, black trend-line) is cheap and drops when it rises. No rocket science here, their negative (inverse) correlation is natural as BTC is valued in USD.
Based on this, what this chart shows though that the Dollar is about to start a new multi-year rally while Bitcoin has already been within its new Bear Cycle since October 2025.
Technically the USD bottomed in June 2025 and started forming a prolonged Support base so the lag it technically natural. This has happened during almost every Cycle, BTC didn't start its Bear Cycle exactly when DXY bottomed and started rising as it's not 'ceteris paribus', other market dynamics play their role too. But the value of the USD has indeed the most important effect macro-wise.
So now that we've determined that this can happen, what's next? Panic? Not exactly. First, the 2011 Bear Cycle has shown that BTC can bottom even though the DXY keeps rising. 2014 has shown that DXY can accelerate rallying aggressively but BTC can continue to a 'normal' Bear Cycle bottom without collapse. 2018/19 has shown quite similar results, when DXY kept rising but much less aggressively even though BTC had already started a new Bull Cycle.
The real problem is the 2022 period. BTC bottomed almost exactly when DXY peaked and started correcting violently. But of course this was a very special situation as the Inflation Crisis of that period drove global markets down violently as the aggressive money supply increase (printing) to recover from the COVID lockdowns inflated prices. Coupled with the Ukraine - Russia war that dealt a hit to the economies through historic energy price spikes, we got that situation: The Dollar has to peak and correct aggressively in order for BTC to bottom.
So is this time similar to 2022 (Iran war = projected inflation but of course no massive money printing before as during COVID) or to the three Bear Cycles before? Statistically the latter. And that implies that the most probable outcome is for the DXY to continue rising, while Bitcoin extends its Bear Cycle but on a slower pace until the eventual bottom in Q4 2026.
But what's your opinion about it? Is the USD new rally very bad news for BTC or not? Feel free to let us know in the comments section below!
---
** Please LIKE 👍, FOLLOW ✅, SHARE 🙌 and COMMENT ✍ if you enjoy this idea! Also share your ideas and charts in the comments section below! This is best way to keep it relevant, support us, keep the content here free and allow the idea to reach as many people as possible. **
---
💸💸💸💸💸💸
👇 👇 👇 👇 👇 👇

BTCUSD Bullish Setup (4H)Bitcoin is showing signs of downtrend exhaustion after an extended sell-off, with price reacting strongly from support and attempting to build a base.
🔺 Bullish Confluences
Higher low forming after a sharp impulsive move down.
Strong reaction from the lower band / key support zone.
Price attempting to reclaim the 38.2% Fibonacci level (~66.6K).
Trendline support (yellow) being respected with multiple touches.
Bearish momentum fading with smaller downside candles.
🎯 Fibonacci Upside Targets
1️⃣ 38.2% – 66,688
2️⃣ 61.8% – 67,906
3️⃣ 100% – 69,878 ✅
As long as price holds above the 65.5K–66K support zone, a bullish continuation toward 69.8K becomes the favored scenario, especially on a confirmed reclaim of resistance.

BTC/USD | BTC Hits $76K Then Pulls Back,Is $66K the Key Support?By analyzing the #Bitcoin chart on the weekly timeframe, we can see that after the previous update, buying pressure continued to build and BTC managed to rally strongly toward the $76,000 level, confirming the bullish momentum we discussed earlier. However, following this move, the market experienced a broader correction in line with other assets, largely driven by the global energy crisis, which added pressure across risk markets.
As a result, Bitcoin entered a corrective phase and is now trading around the $68,000 region, showing signs of consolidation after the recent volatility. At this stage, the $66,000 level becomes the key structural support for maintaining the bullish scenario. If price manages to hold and stabilize above the $66,000 level, we may expect the start of another bullish wave from this region.
In that case, the next upside targets to monitor are $72,800 , followed by $76,000 , then $79,500 , and potentially $85,000 if bullish momentum continues to build.
Please support me with your likes and comments to motivate me to share more analysis with you and share your opinion about the possible trend of this chart with me !
Best Regards , Arman Shaban

BTCUSD Approaching Key Resistance After Trendline BounceBitcoin is consolidating after a strong bearish move and currently reacting near an ascending trendline support. Price is attempting a short-term recovery but remains below the 75,000–76,000 resistance zone, keeping the broader structure cautious.
Bullish pullback: if the trendline holds, price may push higher toward the 75,000–76,000 resistance zone, where selling pressure could appear.
Bearish continuation: rejection from the resistance zone could lead to renewed downside toward the 54,700 demand zone, which is marked as a major reversal area.
Resistance: 75,000–76,000
Current support: ascending trendline area (~67,000–68,000)
Major demand / reversal zone: 54,700
Higher resistance zone: 83,000–85,000 (order block area)
Neutral to bearish while below 75,000–76,000, with downside risk if resistance holds.
This is a technical analysis idea for educational purposes, not financial advice.

After-Effect Leads Supply to Sharp Breakdown in BTCUSD 4H TFPrice initially formed a controlled recovery after a strong bearish move, entering into a higher structure zone marked as the “After Effects” area. This region represents the residual impact of prior supply, where selling pressure was previously active. As price revisited this zone, it failed to sustain bullish momentum, indicating that the recovery lacked strength and was likely corrective in nature.
The market then showed clear rejection from this supply-influenced area, followed by a sharp impulsive move to the downside. This confirms that sellers remained in control, using the retracement as an opportunity to re-enter. The breakdown also suggests that the prior structure acted as a distribution phase rather than accumulation, leading to continuation of the bearish trend.
Speculative Outlook
With price now reacting strongly to the downside, the focus shifts toward the lower marked demand/reaction zone. If price stabilizes and shows buying interest here, a short-term relief bounce or consolidation may occur. However, if selling pressure continues and the zone fails to hold, it could open the path for further downside expansion and new lows.
On the other hand, any meaningful bullish reversal would require price to reclaim the broken structure and sustain above it — otherwise, the overall bias remains bearish with continuation potential.


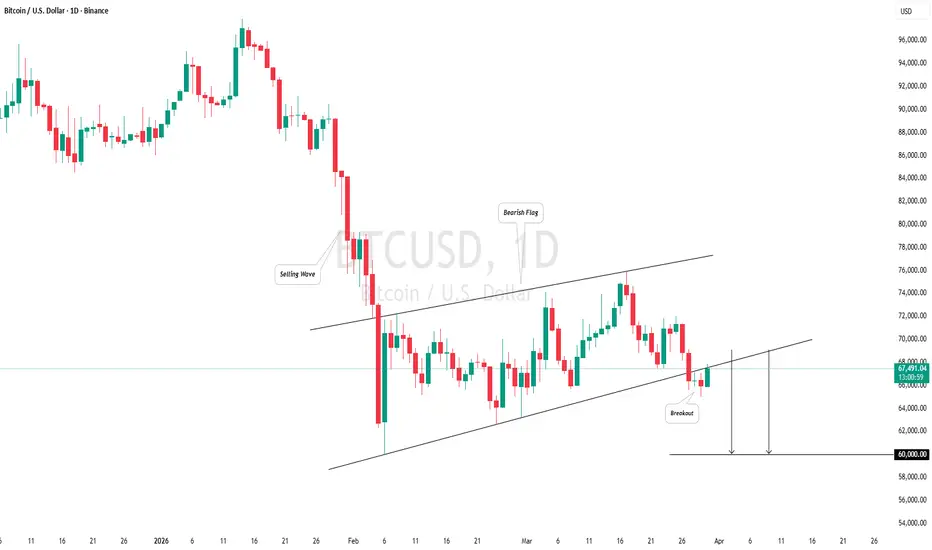
BITCOIN (BTC/USD): Classic Trend-Following PatternI see a significant bearish pattern on 📉BITCOIN a daily timeframe.
The price formed a bearish flag.
Trading in a bearish trend, the violation of a support of the flag is a strong
trend-following signal.
Consequently, we might anticipate a downward movement towards the 60,000 level.
Bitcoin Rally Stalls At Critical Resistance, Downside Risk BuildBitcoin has recently staged a recovery that, at first glance, appears to fit an ABC corrective pattern. The rally pushed toward a key resistance zone, but a sharp rejection suggests that this recovery may now be complete. Traders should remain cautious, as this could mark the beginning of renewed downside pressure.
From an Elliott Wave perspective, there is an alternative scenario to consider. The recent move could be forming a leading diagonal, representing wave A of a larger, higher-degree ABC corrective recovery. This would imply that Bitcoin might still have additional upside potential later on. However, in either case, the short-term outlook favors caution.
Technically, the market now appears poised for at least a three-wave decline. Current projections indicate that this pullback could target the $65K–$60K region, aligning with previous support zones and typical retracement levels after a completed correction.
Traders and investors should closely monitor price action near these levels. Whether Bitcoin confirms a deeper correction or establishes a base for another recovery, the key takeaway is that the rejection at resistance is a warning signal. Short-term weakness seems likely, making careful risk management essential in the coming sessions.

BTCUSD Respecting BPR | Bearish Continuation Toward SellSide LiqBTC has delivered a buy-side liquidity sweep, followed by a failure to sustain above the highs. The rejection from the top indicates weakness after liquidity engineering, suggesting distribution rather than continuation.
Price is currently trading within a Balanced Price Range (BPR) and respecting the 50% equilibrium, but instead of holding as support, this level is acting as resistance.
This behavior signals inefficient bullish continuation and increases the probability of a move lower.
Trade Plan:
- Look for shorts near premium / BPR equilibrium
- Wait for bearish confirmation (displacement on LTF)
- Target sell-side liquidity below lows
Targets:
- Internal liquidity (range lows)
- External sell-side liquidity
Invalidation:
- If price breaks above the BPR and shows acceptance, the bearish thesis fails.

BITCOIN started the final descent towards the 'Sweet Buy Spot'Bitcoin (BTCUSD) is about to break down its 2-month consolidation and start the next Bearish Leg, which will technically be the 3rd of the current Bear Cycle. That should be part of the market's final descent towards the bottoming process.
This process is what we will call on this idea the 'Mayer Multiple and Fib MAs Sweet Spot'. And as you understand that is the common Buy Zone of the MM Bands (MMBs) and the Fib MAs.
As you see, every BTC Bear Cycle dropped on average by at least -50% after entering the MMBs Buy Zone (green). All approached the Fib MA (red trend-line) with the last Cycle even touching it and bottoming there. The 2011 Bear Cycle even hit Multiple 8 (blue) and bottomed.
According to all the above the most optimal combination for this Cycle's buy ('Sweet Spot'), would be $40000 (in my opinion late overextension for practical reasons). That would be in the middle of the Fib MA and Multiple 8 and still not -50% from the moment of the MMBs entrance.
So do you believe we are going to see $40k before this Cycle bottoms? Feel free to let us know in the comments section below!
---
** Please LIKE 👍, FOLLOW ✅, SHARE 🙌 and COMMENT ✍ if you enjoy this idea! Also share your ideas and charts in the comments section below! This is best way to keep it relevant, support us, keep the content here free and allow the idea to reach as many people as possible. **
---
💸💸💸💸💸💸
👇 👇 👇 👇 👇 👇
