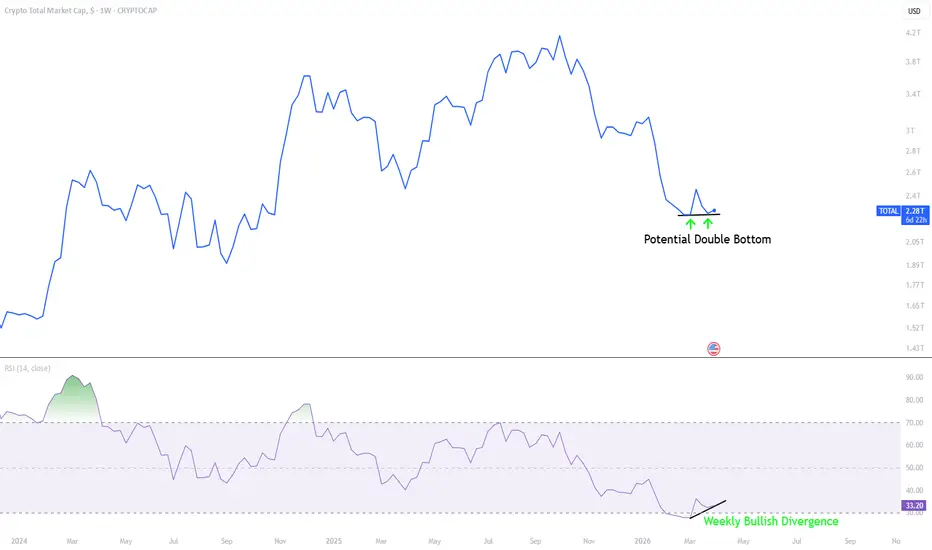
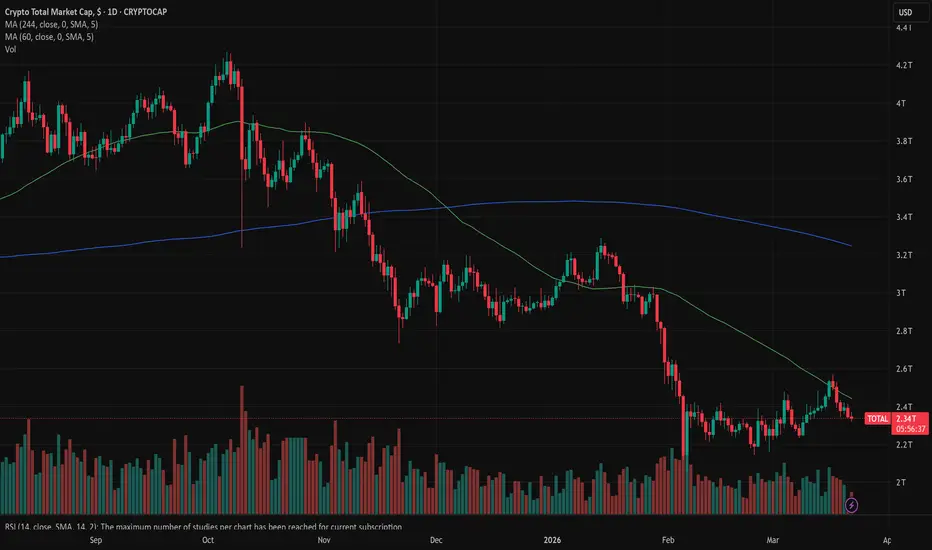
TOTAL - Crypto Recovery Possible?Some major developments have occurred across the board with the price action we saw heading into the weekly close for most cryptocurrencies. For many weeks I have been outlining the bearish case for the crypto total market cap and that scenario remains in play for now.
However, there is a glimmer of hope in the price action that just printed at the close.
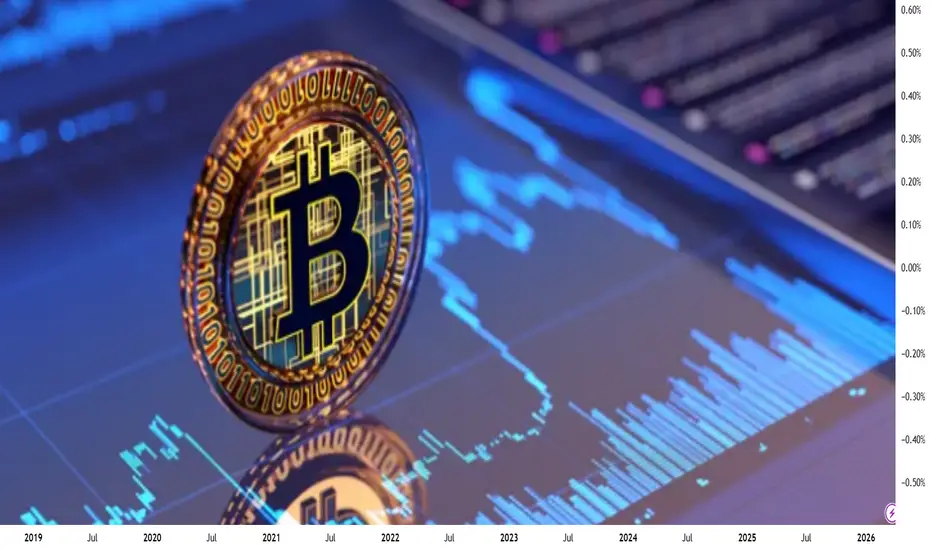
Price has formed a double bottom on the weekly timeframe, accompanied by a bullish divergence forming on the weekly RSI. This is most clearly visible on the line chart, which only accounts for candle body closes.
If tomorrow brings headlines of de-escalation progress with the US-Iran conflict, this could mark a local low for some time and allow price to appreciate meaningfully from these levels.
However, if the lows established today are lost, the much more severe bearish scenarios will begin to play out. That level corresponds to the "Weekly Break Level" I outlined in this post:
So far, TOTAL is still respecting this level for now.
Watch tomorrow's developments closely. The direction of the next major move will largely depend on what headlines emerge.
Crypto Total Market Cap, $
No trades
In-depth trading ideas
MARKETS week ahead: March 29 – April 4Last week in the news
Macro risks are evidently rising with continuation of the Middle East conflict and rising prices of oil. Markets continue to react to such unpredictable macro environments, putting pressure on equities, Treasuries and even gold. The S&P 500 continued its fifth corrective week, closing Friday at 6.368. Despite a modest recovery on Friday, gold continues to be pressured, with a weekly close at $4.493. The strongest reaction last week was with 10Y Treasury yields, which are testing levels modestly below 4,5%. The crypto market is also feeling investors' reluctance, when BTC did not manage to sustain the $70K level, and closed the week at $67K.
Although last week lacked major macroeconomic data, fundamentals continued to influence investor sentiment, particularly elevated oil prices. Key releases for the week included the S&P Global Manufacturing PMI flash for March, which came in at 52.4, slightly above the estimate of 51.3. The University of Michigan Consumer Sentiment for March was finalized at 53.3, with five-year inflation expectations steady at 3.2%.
Rising oil prices continued to pressure markets as escalating tensions around the Strait of Hormuz threatened global supply, pushing Brent and WTI back toward $100+ a barrel amid doubts over a ceasefire. This surge in energy costs is stoking inflation concerns worldwide, with higher fuel and transportation prices expected to feed through broader price indexes. As a result, central banks face increased pressure on monetary policy, with investors and policymakers wary that persistent energy driven inflation could delay rate cuts or even prompt further tightening. As per CME FedWatch tool, markets are currently pricing in a high probability of the Federal Reserve holding rates steady at its next meeting.
U.S. technology stocks came under heavy pressure this week amid escalating geopolitical tensions and broader market weakness, with major names leading declines. Meta Platforms shares slid sharply after adverse legal rulings held the company and others accountable for harms tied to their platforms, eroding investor confidence and dragging on the tech heavy indices. Market anxieties over inflation, rising yields, and slower growth in AI spending also weighed on other big tech giants, contributing to major US equity indexes' entry into correction territory and broader sell-offs across Microsoft, Alphabet, and Nvidia. The combination of legal risks and macroeconomic concerns has intensified volatility in the sector, amplifying downside pressure on major technology stocks.
As per news reporting, U.S. mortgage giant Fannie Mae will for the first time support mortgage loans that leverage cryptocurrency holdings, allowing homebuyers to use assets like Bitcoin or USDC as collateral for their down payment rather than selling them outright. The product, launched in partnership with Better Home & Finance and Coinbase, integrates crypto into traditional conforming mortgages, potentially expanding access to homeownership for digital asset holders while helping borrowers avoid taxable events tied to selling crypto. Although initially likely to remain a niche offering, this move marks a significant step toward mainstream acceptance of digital assets within the U.S. housing finance system and could influence how lenders and investors view crypto as part of broader credit markets.
CRYPTO MARKET
Rising macro risks are in the focus of investors both on traditional and crypto markets. Surging oil prices are making inflation pressures, which makes the current macro outlook unstable and especially future moves of central bankers. Considering the high level of uncertainties, investors are reluctant to invest their capital in any market. The crypto market modestly corrected as of the end of the previous week. Total market capitalization decreased by 4,3% w/w with an outflow of $104B. Daily trading volumes were just modestly increased to the level of $134B on a daily basis, from $125B traded a week before. Total market capitalization since the beginning of this year currently stands in a negative territory of -22%, with a total outflow of -$650B.
BTC and ETH once again set the tone for the market. Bitcoin declined by 5.0% on a weekly basis, while Ethereum posted a somewhat steeper 5.8% w/w loss, reflecting renewed pressure on the largest and most liquid crypto assets. XRP also moved lower, falling 6.1%, while BNB declined 3.9% during the same period. The weakness was broad, with Solana down 6.8%, Avalanche lower by 6.0%, and Cardano declining 5.0%.
Among the largest negative weekly movers among altcoins, Polkadot recorded the sharpest decline, falling 13.8% w/w. Filecoin also posted a significant drop of 12.9%, while DOGE declined 10.3%. Additional notable losses were seen in IOTA (-8.6%), SUI (-7.6%), and Theta (-7.1%), highlighting broad weakness across the altcoin space.
On the positive side, only a limited number of assets managed to finish the week in green. ONDO stood out with a solid 7.0% weekly gain, Stellar also advanced 3.7%, while Tron moved 1.6% higher, providing only selective pockets of strength in an otherwise negative market environment.
Outside of the main monitored list, several tokens delivered exceptional upside performance despite the broader market sell-off. Siren led the gains with a sharp 77.6% weekly surge, followed by MemeCore with a 35.0% increase, while Midnight advanced by 19.0% w/w, placing them among the top performers across the broader crypto universe.
Circulating supply changes remained relatively modest this week. Tether, DOGE, Stellar, DASH, Zcash, Solana and Filecoin each recorded a 0.1% increase in circulating supply, while Hyperliquid remained the only asset with a slight 0.2% decrease.
CRYPTO FUTURES MARKET
Bitcoin futures recorded a broad-based decline this week, reversing the previous period’s moderate consolidation with a renewed downside move across the curve. The March 2026 maturity fell by 5.68% w/w, settling at $66,235. Across the rest of the term structure, losses were remarkably consistent, ranging between 5.92% and 6.12%, with the August 2026 maturity posting the steepest weekly drop. The December 2027 maturity closed at $72,430, down 5.99% on the week. The parallel nature of the move indicates another uniform downward repricing rather than stress concentrated in any specific maturity.
Ether futures also moved decisively lower, underperforming Bitcoin slightly as weekly losses ranged from 6.56% to 6.99%. The March 2026 maturity settled at $1,993, down 6.56%, while the August 2026 maturity recorded the largest decline at 6.99%. Longer dated futures remained under similar pressure, with the December 2027 maturity closing at $2,203, representing a weekly loss of 6.69%.
It is also worth noting that September 2027 futures appeared on the curve for the first time this week for both Bitcoin and Ether, with initial pricing at $71,560 and $2,175, respectively.
Despite the sharp correction, both Bitcoin and Ether futures curves continue to maintain their contango structure, with longer dated maturities trading at progressively higher price levels than near term futures. This suggests that while short term sentiment weakened materially during the week, longer term forward pricing still reflects expectations of relatively higher valuations over time.
A major bullish wave is approaching the Cryptocurrency marketThis is just a very friendly reminder. Just buy everything. Buy as much as you can and hold. No need to focus on the long-term because we are getting very close — Crypto is going up.
We are right in front of a major, major bullish cycle. A true bull market. A true altcoins market bull market like nothing you have experienced before.
This bull market has not been only months in the making, this is only the last part. It has been years in the making and it is late. It is overdue and it is here now.
Are you going to miss it?
Are you going to take action?
When the action starts, it is already too late.
You have this unfair advantage, you know about it before it happens. Make the most of this information. Make the most out of this opportunity. It will be months of sustained growth.
It can last 2 months, just as it can last 3 or 4 months. It will feel like forever when prices are going up.
It will go up for so long, that you will get used to seeing prices rising. You will even become complacent at some point.
All is good. I am here for you.
Thanks a lot for your continued support.
This is the last reminder, until my next article. BUY AND HOLD!
Buy as much as you can. All those pairs trading at bottom prices and all those pairs trading at support. You will be extremely happy with the results.
Namaste.
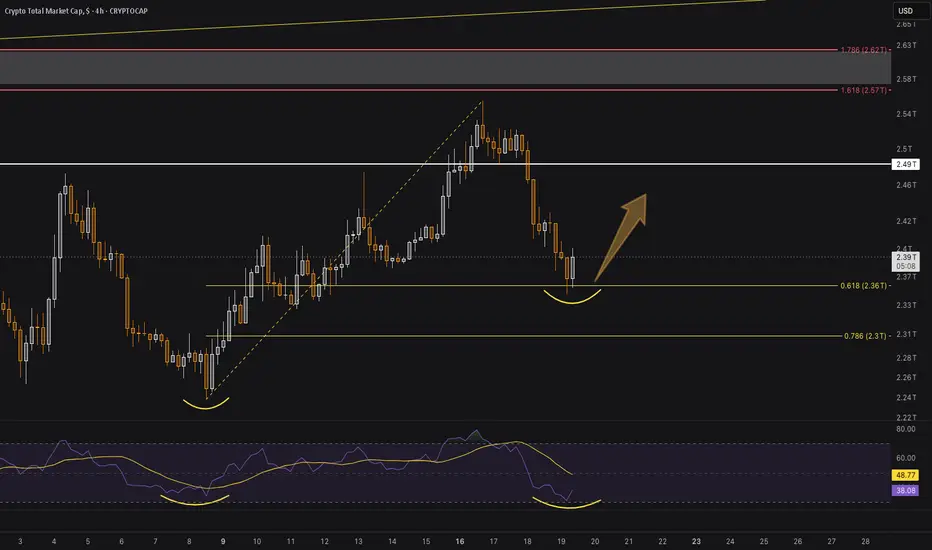
BTC May Have More Fight LeftA bullish engulf candle on the 4HR chart from the 0.618 Support with only minutes until close. RSI hidden bullish divergence is printing. TOTAL may make an attempt for the upper 1.618 Resistance level.
-Not Financial Advice-
MARKETS week ahead: March 22 –28Last week in the news
Fed left interest rates unchanged, however, macro risks continue to loom amid surging in oil prices which could easily be reflected in inflation. The increased inflation means increased probability that central bankers could even increase interest rates, instead of decreasing them. This was the major premise of investors, which shapes developments on financial markets. The S&P 500 continued its fourth losing week, closing Friday at 6.506. On the same premises, US 10Y yields surged to 4,39%, while the price of gold tumbled around 10%, closing Friday at $4.491. The only market that is holding its ground during this period of time is the crypto market. BTC tried to pass the $75K resistance, but still, reverted back toward the $70K as of the end of the week.
The Fed kept rates unchanged as expected, but the overall message remained cautious and slightly hawkish. Policymakers highlighted rising uncertainty, particularly from higher oil prices, which could push inflation higher and delay easing of the monetary policy. The Fed signaled it is not in a rush to cut rates, maintaining a data dependent stance while acknowledging inflation risks remain above target. At the same time, projections still point to limited easing later this year, though confidence in that path has weakened. Markets reacted to the tone rather than the decision, with investors increasingly considering the possibility that rates could stay higher for longer, or even rise if inflation reaccelerates.
The European Central Bank also held its meeting this week, holding rates unchanged, as expected. However, the ECB President Christine Lagarde delivered a more hawkish message, stressing increased uncertainty and signaling readiness to act if inflation risks intensify. The return of “closely monitoring” language indicates a higher level of alert, especially as risks to inflation are now seen on the upside. ECB projections show moderate growth and inflation gradually near target, though oil price shocks could worsen the outlook under adverse scenarios. Lagarde suggested the ECB will react only if energy-driven inflation spreads more broadly into the economy, particularly through wages and demand.
Shares of Super Micro Computer fell sharply, around 30%, after prosecutors charged several executives with illegally smuggling advanced Nvidia AI chips to China. The decline reflects investor concerns over potential legal liabilities, regulatory scrutiny, and disruptions to the company’s operations due to the export control violations.
OpenAI plans to nearly double its workforce from about 4,500 to roughly 8,000 employees by the end of 2026, as part of a major push into the enterprise AI market, according to Financial Times reports. The hiring will be concentrated in product development, engineering, research and sales to support business deployments of its tools and compete more effectively with rivals. This move signals an intensified focus on enterprise clients and scaling operations amid heightened competition across the AI sector.
CRYPTO MARKET
While general correction on traditional markets continues, the crypto market surprisingly is managing to hold its grounds strongly. During the week, BTC even tried to break the $75K resistance, showing that investors' capital is returning in a shy manner to the crypto market. Macro clarity will be more productive from the perspective of investors sentiment, however, the current war in Iran is supporting fears of potential inflation and increased interest rates in the future, which is also affecting the crypto market in terms of investors' reluctance for a return at this moment. Total crypto market capitalization remained flat during the previous week. Daily trading volumes were modestly decreased to the level of $125B on a daily basis. Total market capitalization since the beginning of this year currently stands in a negative territory of -19%, with a total outflow of -$546B.
BTC and ETH once again set the tone for the market. Bitcoin remained relatively flat for the week, regardless of the previous shift toward the $75K. In contrast, Ethereum continued to move higher, advancing 3.4% w/w, suggesting stronger relative momentum among large-cap altcoins. Among other major assets, XRP recorded a solid 3.4% increase, while Solana gained 3.2% and Litecoin moved 2.5% higher. The strongest performer among majors was Zcash, which surged 10.8% w/w. DOGE also stood out with a 9.1% increase, supported by a notable expansion in circulating supply. Filecoin rebounded with an 8.9% gain, while Hyperliquid advanced 4.8% during the week.
Several coins ended the week in negative territory, like Uniswap falling 9.0% w/w. SUI also faced pressure with a 3.2% decrease, while Algorand declined 2.7% and Theta slipped 2.3%.
Outside of the majors, several tokens delivered strong upside performance. Artificial Superintelligence Alliance (FET) led with a 29% weekly gain, followed by DeXe with a 23% increase, while Kaspa advanced by 20% w/w, positioning them among the top performers in the broader crypto market.
Circulating supply dynamics showed some notable movements this week. DOGE recorded a significant increase of 10.3% w/w, marking the largest supply expansion among all assets. IOTA also saw a meaningful rise of 1.2%, while XRP increased supply by 0.2%. Filecoin registered a 0.2% increase, and several other assets, including Solana, Zcash, DASH and POL, posted 0.1% growth. Hyperliquid remained the only asset with a slight 0.2% decrease in circulating supply.
CRYPTO FUTURES MARKET
Bitcoin futures edged lower this week, interrupting the prior recovery phase with a modest and broadly distributed pullback across the curve. The March 2026 maturity declined by 1.55% w/w, settling at $70,220. Similar losses were observed along the term structure, with weekly declines ranging between 1.48% and 1.55%. The December 2027 maturity closed at $77,045, down 1.50% on the week. The relatively uniform nature of the move suggests a parallel downward shift, pointing to mild profit-taking rather than a renewed wave of aggressive selling.
In contrast, Ether futures continued to move higher, extending their recent upward momentum. The March 2026 contract settled at $2,133, rising 1.23% w/w. Gains were consistent across maturities, ranging from 1.22% to 1.37%, with the strongest increases observed toward the long end of the curve. The December 2027 maturity closed at $2,361, up 1.37% on the week, indicating sustained demand for longer-dated exposure.
The divergence between Bitcoin and Ether futures highlights a more selective market environment, with Ether maintaining positive momentum while Bitcoin undergoes a modest consolidation. Despite this divergence, both futures curves remain in contango, with longer-dated maturities trading at progressively higher price levels. This structure continues to reflect expectations of higher valuations over the longer term, even as short-term dynamics vary between the two assets.
Altcoins: Most Still Bearish - Don’t Get TrappedAltcoins still show overall bearish structure.
Most are continuing to print lower highs and failing to confirm a trend reversal.
For bulls to take control, key levels must be reclaimed - until then, this recent bounce is likely just a relief rally within a broader downtrend.
Chasing here without confirmation can be risky.
Drop your altcoin in the comments and I’ll reply with key levels, structure, and what to watch next.
If you’re interested in how I break down charts, you can check my profile.
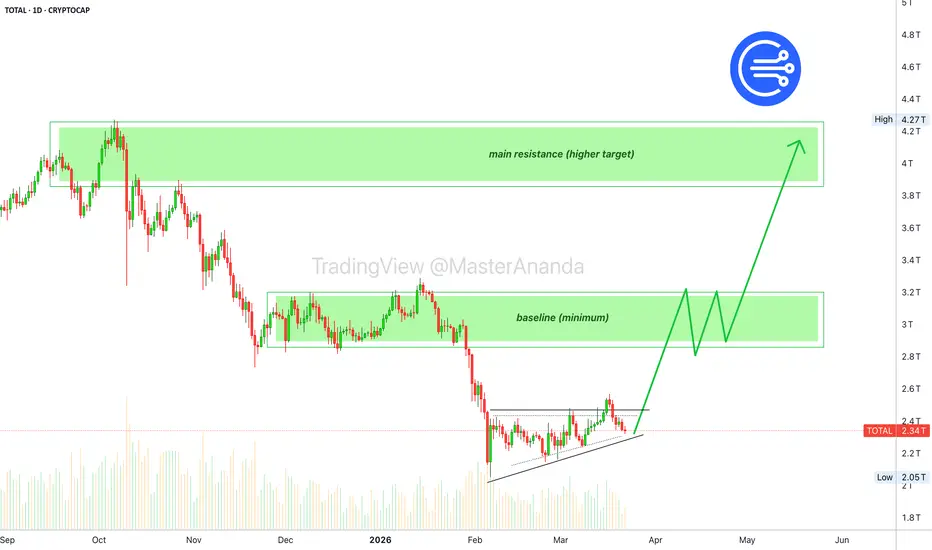
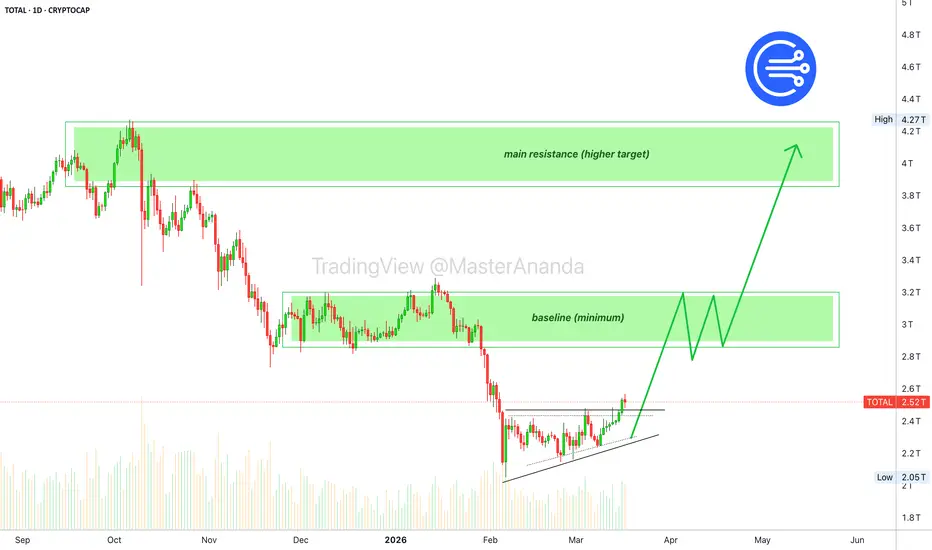
Bitcoin-Crypto-TOTAL-Altcoins: Straight up, hold strong!The Cryptocurrency market has been rising. The total market Cryptocurrency capitalization is up more than 400 billion since the 24-Feb low.
Like Bitcoin, and many of the top and minor altcoins, the TOTAL index closed eight consecutive days green. At this point, it is normal to expect a retrace. Many people would expect a retrace and this would also mean profit taking on high leveraged positions. Stop! The market is set to move straight up.
It is not about the numbers of days but the space that is covered. TOTAL is coming down from a high of 4.27 T. The baseline, the main resistance and recovery range, sits around the 2.95 - 3.20 T. Giving the current chart plenty of room still available for additional growth.
Since we saw months and months of sustained bearish action, we become conditioned, scared and afraid. There is nothing to worry about, stay strong —Crypto will continue to grow. The chart shows plenty of space available for more bullish action. We are set to experience months of sustained growth.
Be careful with FOMO. If you sell a pair trading at resistance, buy a new one trading at support. Hundreds of opportunities are still available, it is early. Never buy those that are rushing ahead. It is better to wait for the right time, the right price and the right entry to secure higher success.
This is a quick update to let you know that the charts are pointing straight up. No long-term retrace, no correction. The recovery wave is only starting to develop. Bitcoin & Ethereum remain super strong. What the King and Queen does, the smaller projects will follow. This is only the start. Hold strong.
(Certain geopolitical developments can cause higher volatility and a short-term retrace, lasting a few days—ignore this as market noise. Higher is already confirmed. It shows clearly on the charts.)
Namaste.
TOTAL Market Cap Update TOTAL Market Cap Update
Total market cap is testing a major support zone (~$2.2T–$2.3T)
After rejection from highs, momentum has turned weak
Trend shows lower highs forming → short-term bearish structure
support breaks:
→ Next downside continuation likely
holds:
→ Possible relief bounce/consolidation
Market is in a decision zone — breakdown = fear, hold = recovery setup
(Watch reaction carefully 👀)
How Martons Group Helps Clients Navigate Crypto Market TrendsThe cryptocurrency market is constantly evolving, offering investors new instruments, technologies, and areas for investment. In such a dynamic environment, it is crucial not only to track changes but also to interpret them correctly. At Martons Group, we help clients identify emerging trends in a timely manner and adapt their investment strategies to new market realities.
Ignoring new developments can lead to missed opportunities, while rushed decisions without proper analysis may increase risks. That is why a structured approach to market research is a key factor in successful investing.
Analyzing Emerging Market Segments
One of the primary tasks is identifying new segments of the cryptocurrency market with strong growth potential. These may include innovative projects, new financial instruments, or advanced technological solutions.
At Martons Group, we conduct in-depth analysis of such areas, evaluating their fundamentals, market demand, and development prospects. This enables clients to gain an objective understanding of new opportunities.
A comprehensive analytical approach reduces the likelihood of investing in unproven or high-risk projects.
Tracking Market Trends
The cryptocurrency market is shaped by multiple factors, including technological innovation, regulatory developments, and investor behavior. Continuous trend tracking allows for timely responses to these changes.
Specialists at Martons Group regularly monitor the market and identify key trends that may influence investment decisions. This helps clients stay informed and aligned with current market developments.
Understanding trends allows investors not only to react to changes but also to anticipate them.
Evaluating New Technologies
The growth of the crypto market is closely linked to the development of new technologies such as decentralized finance (DeFi), Web3, and next-generation blockchain solutions.
At Martons Group, we analyze the technological aspects of projects, assessing their practical use cases, sustainability, and scalability potential. This helps determine which innovations are likely to drive future growth.
A strong technological evaluation enables more informed investment choices.
Explaining Market Changes to Clients
One of the challenges of the cryptocurrency market is its complexity. Without proper explanation, even promising trends can go unnoticed.
At Martons Group, we place strong emphasis on client communication, clearly explaining market developments and their potential impact on investments. This helps investors better understand the environment and make informed decisions.
Clear communication makes complex processes more accessible and manageable.
Adapting Investment Strategies
Identifying trends is only the first step. It is equally important to effectively incorporate new opportunities into an investment strategy.
At Martons Group, we assist clients in adjusting their portfolios based on current trends, reallocating assets and introducing new instruments when appropriate.
Flexibility and adaptability allow investors to take advantage of market opportunities while maintaining a competitive edge.
Understanding and leveraging emerging trends is a crucial element of successful cryptocurrency investing. It enables investors to discover new opportunities and build strategies aligned with future developments. At Martons Group, we support clients in navigating the rapidly changing market by providing analytical insights and effective investment solutions.
PHA Price Soars 27.93% as Broader Crypto Market ShiftsWhile most altcoins traded sideways today, PHA Price broke ranks with a stunning 27.93% surge in just 60 minutes. The token’s current price stands at $0.0426, showcasing a substantial increase from $0.0333. This remarkable jump highlights a moment of heightened interest among traders, particularly as the broader market shows mixed signals.
Market Snapshot
PHA is currently trading at $0.0426 after reaching a high of $0.0426 and a low of $0.0321 within the last 24 hours. Over this period, the token has seen a significant 24-hour price change of +33.54%. Daily trading volume has reached $2,703,111.17, reflecting increased market participation, while the asset currently holds no market capitalization data available.
Growing Attention Around Small Cap Tokens
The recent move in PHA also reflects a broader shift toward smaller cryptocurrencies. Traders often explore such assets when major coins slow down. This behavior supports the ongoing altcoin market movement seen across exchanges. Smaller tokens usually offer faster percentage gains, which attracts short term traders looking for quick opportunities.
The PHA crypto price surge fits perfectly into this pattern. As interest builds, more traders start tracking similar projects. This growing attention can sometimes extend rallies further, especially if momentum continues. However, such moves also bring higher risk, making market timing very important for participants.
Market Volatility Keeps Traders On Edge
Volatility remains a key factor behind sudden price movements like this one. Rapid price swings create both opportunities and risks for traders. The Phala Network price showed how quickly sentiment can shift within minutes. This kind of movement often leads to increased speculation across the market.
The current environment suggests that traders stay cautious despite strong rallies. While the PHA crypto price surge shows strength, sudden pullbacks can still happen. That is why many traders closely monitor support and resistance levels before making decisions. Market conditions can change quickly, especially during uncertain periods.
What Could Be Behind This Move
Market observers note that the recent surge in PHA’s price coincides with broader trends in the cryptocurrency landscape. Analysts suggest that the mixed signals across major assets have led to a rotation in investor sentiment, with altcoins like PHA gaining traction as traders seek opportunities beyond Bitcoin and Ethereum. As the market grapples with uncertainties surrounding interest rates and regulatory outlooks, altcoins may see increased volatility, creating fertile ground for significant price movements.
Additionally, on-chain data indicates a surge in trading volume for PHA, which often precedes sharp price action. The recent uptick in trading activity suggests heightened interest among investors, likely driven by speculative trading and the desire to capitalize on potential price gains. This influx of buying pressure has pushed PHA’s price higher, further fueling enthusiasm in the market and attracting attention from both retail and institutional investors. This dynamic interplay of factors illustrates how market sentiment can rapidly shift, leading to dramatic price movements in a short time span.
What Traders Are Watching Next
Traders are closely watching PHA for potential breakout levels. Key resistance is seen near $0.043, while support is anticipated around the $0.037 mark. A break above these levels could signal further bullish momentum, whereas a pullback might lead to a reassessment of positions. As the market evolves, keeping an eye on external economic factors and sentiment shifts will be crucial for determining PHA’s trajectory in the coming days.
This article is for informational purposes only and does not constitute financial advice. Readers should conduct their own research and consult a financial advisor before making investment decisions.

How Gelaxy IG Helps Clients Build a Consistent Cryptocurrency InThe modern cryptocurrency market is characterized by high volatility, making it both attractive and risky for investors. In such conditions, a systematic approach to investing becomes increasingly important, rather than relying on one-time capital allocations. At Gelaxy IG, we observe a growing interest among clients in regular investment strategies that help manage risks more effectively and build sustainable capital over time.
Regular investing is not just a method of spreading funds over time—it is a comprehensive strategy aimed at reducing the impact of short-term market fluctuations. This approach is particularly relevant in the cryptocurrency market, where asset prices can change significantly within short periods.
The Principle of Regular Investments: The Foundation of Strategy
The core idea behind regular investing is to allocate funds systematically at fixed intervals, regardless of current market conditions. This eliminates the need to predict the perfect market entry point.
At Gelaxy IG, we help clients design such strategies based on their financial capabilities and investment goals. Regular contributions allow investors to distribute risk over time and achieve a more balanced average entry price.
This approach is especially effective in volatile markets, where attempts to “time the market” often lead to costly mistakes. A systematic strategy replaces guesswork with consistency, making the investment process more predictable.
Reducing the Impact of Market Fluctuations
One of the main advantages of regular investing is its ability to reduce dependence on short-term market movements. By purchasing assets at different price levels, investors can mitigate the effects of sharp price swings.
In the cryptocurrency market, where significant changes can occur within a single day, this approach helps reduce emotional stress and prevents impulsive decisions. Clients of Gelaxy IG benefit from following a predefined strategy without reacting to every market fluctuation.
This is particularly valuable for investors who prefer a structured approach without the need for constant market monitoring.
Building an Investment Habit
Regular investing fosters financial discipline and helps establish a consistent investment habit. Instead of making occasional decisions, investors begin to treat investing as an integral part of their financial routine.
At Gelaxy IG, we focus not only on the technical aspects of investing but also on behavioral factors. Developing a sustainable investment habit enables clients to steadily grow their capital without repeatedly facing complex decision-making.
This approach minimizes the influence of emotions and supports the development of a long-term investment mindset, which is essential for success in the cryptocurrency market.
Long-Term Approach: A Strategy for Capital Growth
Regular investments are most effective when applied over a long-term horizon. They help smooth out short-term downturns and allow investors to benefit from overall market growth.
At Gelaxy IG, we assist clients in defining the optimal investment horizon and building strategies aligned with their objectives. A long-term approach shifts the focus from short-term price fluctuations to the fundamental potential of the market.
This is particularly relevant for cryptocurrencies, which, despite their volatility, demonstrate significant long-term growth potential.
Monitoring the Investment Process
Although regular investing is often associated with automation, ongoing monitoring remains a crucial component of the strategy. It is important to periodically review performance, adjust asset allocation, and respond to changes in market conditions.
The specialists at Gelaxy IG support clients throughout the entire investment process. We provide transparency, regular analytics, and recommendations for strategy optimization.
This ensures a balance between consistency and flexibility—an essential factor in the rapidly evolving cryptocurrency environment.
A systematic investment approach based on regular contributions enables clients to engage with cryptocurrency assets more consistently and effectively. It reduces the impact of volatility, builds financial discipline, and supports long-term capital growth. At Gelaxy IG, we view regular investing as a powerful tool for achieving stable financial outcomes and offer solutions designed for structured and sustainable wealth development.

How Aston Pirs Group Helps Clients Manage Cryptocurrency IncomeIn recent years, the cryptocurrency market has become one of the most dynamic areas of investment. High volatility and the potential for significant returns attract both private investors and institutional participants. However, generating profit is only the first step. Equally important is the effective management of earned capital. At Aston Pirs Group, we consider this stage a key factor in achieving our clients’ long-term financial success.
After securing profits, investors often face the critical question: what comes next? The absence of a clear strategy can lead to inefficient use of funds or even partial capital loss. This is why professional support from an investment company becomes an essential element of a structured approach to capital management.
Profit-Taking: The Foundation of Financial Discipline
One of the key aspects of working with cryptocurrency assets is timely profit-taking. Many investors make the common mistake of expecting continued growth while ignoring market signals. This approach often results in missed opportunities or a return of prices to initial levels.
At Aston Pirs Group, we implement structured profit-taking strategies, including partial position closure and phased exits at predefined levels. This allows clients not only to secure achieved gains but also to retain exposure to potential future market growth.
We also pay close attention to the psychological aspects of investing. Emotions such as greed and fear can significantly influence decision-making. Our role is to minimize these factors and ensure a rational, disciplined approach to asset management.
Reinvestment: Sustaining Capital Growth
Once profits are secured, the next step is determining how to effectively utilize the capital. Passive holding may reduce the potential efficiency of funds, while strategic reinvestment helps maintain and grow returns.
We develop personalized reinvestment strategies tailored to each client’s risk tolerance, investment objectives, and current market conditions. These strategies may include reinvesting in cryptocurrency assets, participating in new projects, or allocating funds into related financial instruments.
A key priority is maintaining a balance between risk and return. At Aston Pirs Group, we focus on achieving an optimal balance that supports sustainable and adaptable investment outcomes.
Capital Allocation: Risk Reduction Through Diversification
Concentrating funds in a single asset or market segment significantly increases risk. Therefore, diversification is a fundamental principle of effective capital management. It helps mitigate potential losses and enhances portfolio resilience.
As part of our approach, we offer comprehensive capital allocation strategies. These include diversification across various crypto assets, the use of stablecoins to maintain liquidity, and the integration of traditional financial instruments.
Each portfolio is tailored to the client’s individual profile. This personalized approach not only reduces risk but also supports consistent capital growth over the long term.
Evaluating Future Opportunities: Identifying New Growth Areas
The cryptocurrency market is constantly evolving, creating new investment opportunities and directions. After generating profit, it is essential to assess the current landscape and identify promising growth areas.
Aston Pirs Group analysts continuously monitor market conditions, including macroeconomic factors, technological trends, and emerging financial instruments. Particular attention is given to areas such as decentralized finance (DeFi), Web3 solutions, and the integration of artificial intelligence.
We help clients navigate these developments and make informed decisions based on data-driven analysis and strategic insight rather than short-term market impulses.
Planning Next Steps: A Structured Investment Approach
Effective income management is impossible without a clear action plan. Random decisions and a lack of strategy often lead to reduced returns and increased risks.
At Aston Pirs Group, we place strong emphasis on long-term financial planning. Together with our clients, we define investment goals, set priorities, and develop step-by-step strategies to achieve desired outcomes.
This structured approach enables clients not only to preserve their capital but also to steadily grow it while adapting to changing market conditions and leveraging new opportunities.
Effective management of cryptocurrency income is an integral part of successful investing. A comprehensive approach that includes profit-taking, reinvestment, diversification, and strategic planning allows investors to preserve and grow their capital efficiently. At Aston Pirs Group, we view income management as the foundation of sustainable financial growth and provide our clients with professional solutions focused on long-term results.

ABCD Pattern may appear!TOTAL (Crypto Total Market Cap) Analysis
CMP 2.53T (17-03-2026 04:45am)
Currently around Important Support (2.08T)
S2 is around 1.51T.
Bearish ABCD pattern may appear if 4.27 is crossed.
Sustaining 4.27 may lead it towards 5.71T

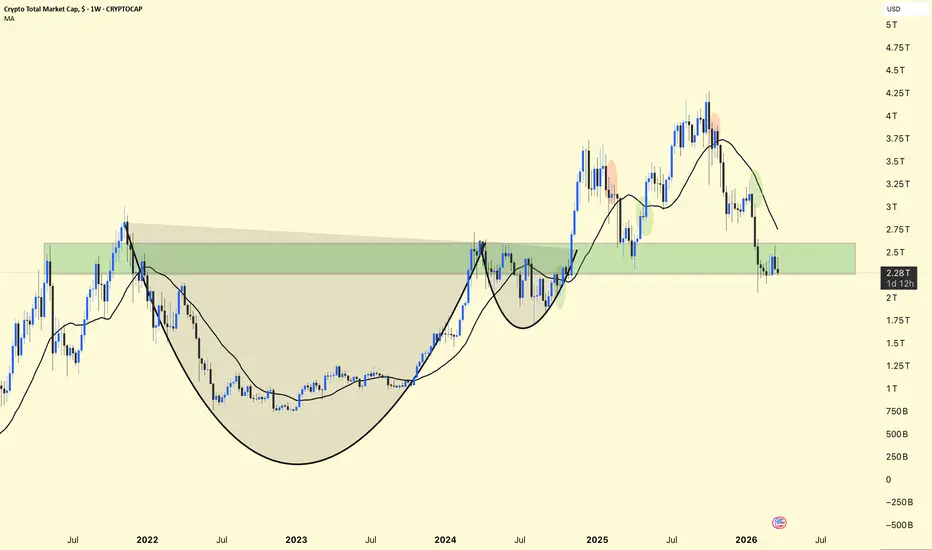
Total Crypto Market Cap – Weekly Chart Analysis. Total Crypto Market Cap – Weekly Chart Analysis
The total crypto market cap is currently around $2.51T and is testing a major historical support–resistance zone near $2.4T–$2.6T. This area previously acted as strong resistance and is now being retested as support.
The chart shows a large, rounded accumulation structure that started after the 2022 bear market.
Price successfully broke above this structure in 2024, triggering a strong rally toward the $4T region.
After the recent correction from the highs, the market is now pulling back to retest the breakout zone, which is a common bullish retest.
The 200-week moving average (green line) is also moving upward and sitting just below the price, adding additional long-term support.
Support: $2.2T – $2.4T
Current Structure: Around $2.5T
Resistance: $3T
Major Resistance: $3.8T – $4T
If the market holds above the $2.3T–$2.4T region, it could confirm a healthy bullish retest and start another move toward $3T and higher.
A strong breakout above $3T would likely bring renewed momentum across the crypto market, potentially pushing the total market cap back toward the $4T zone in the next major expansion phase. 📈

Australia Moves Toward Strict LicensingRules For Crypto PlatformAustralia continues to strengthen its oversight of the digital asset industry. A Senate committee recently supported a bill that could reshape the country’s cryptocurrency ecosystem. The proposal would require many crypto companies to obtain crypto licensing before operating in the market.
The proposal focuses on protecting users and improving transparency across the crypto sector. Regulators want to ensure that companies that hold customer funds follow strict financial rules. These rules already apply to traditional financial institutions across Australia.
Lawmakers emphasize that the bill does not target blockchain technology itself. Instead, it focuses on businesses that manage digital assets for customers. This approach attempts to encourage innovation while ensuring stronger investor safeguards. The proposal also arrives during a global push for clearer crypto regulation. Governments worldwide now recognize the importance of regulating crypto service providers. Australia now aims to build a framework that balances innovation and consumer protection.
Why Australia Wants Stronger Crypto Oversight
Australia’s government sees rapid growth in digital assets across the country. Millions of Australians now trade cryptocurrencies through exchanges and digital platforms. This growth increases the need for strong oversight and clearer rules.
The proposed framework would introduce crypto licensing requirements for many digital asset companies. These licenses would apply to platforms that hold customer funds or provide crypto custody services. Authorities want to ensure these firms meet strict operational standards.
Supporters of the bill believe the rules could reduce fraud and financial risks. They argue that clear regulations increase trust in the digital asset ecosystem. Greater trust could encourage both institutional investors and everyday users to participate in the market.
What The Proposed Crypto Licensing System Includes
The bill introduces a structured digital asset regulation framework for crypto companies operating in Australia. Platforms that hold or manage user assets would need official financial services authorization.
This process would require companies to follow strict compliance standards. Firms would need strong security systems, transparent reporting, and proper custody procedures. These measures would reduce the chances of mismanagement or misuse of customer funds.
The framework also aims to improve accountability within the industry. Licensed companies would need to follow risk management policies and financial disclosure rules. Regulators could monitor the activities of these platforms more effectively.
How The New Rules Could Impact Crypto Exchanges
The proposed law would significantly affect crypto exchanges operating in Australia. Companies that hold customer assets must obtain proper authorization.
These firms must comply with financial rules similar to those of traditional financial institutions. They must maintain transparency in operations and safeguard client funds.
The crypto licensing Australia framework could also reshape competition within the industry. Large exchanges with strong compliance systems may adapt quickly. Smaller firms might face higher operational costs while meeting regulatory requirements.
Australia’s Role In Global Digital Asset Regulation
Australia joins several countries that now push for clearer crypto regulation. Governments worldwide recognize the importance of regulating the digital asset sector. Regions such as Europe and parts of Asia have already introduced detailed regulatory frameworks. These policies aim to protect investors while allowing innovation in financial technology.
Australia hopes its approach to digital asset regulation will strike the right balance. Policymakers want to create a safe market environment without discouraging new blockchain startups.
The Road Ahead For Australia’s Crypto Industry
The Senate committee’s support marks an important step toward regulatory reform. However, lawmakers must still debate and finalize the legislation before implementation. If passed, the framework would transform how crypto companies operate in Australia. Exchanges and custodians must adjust their business models to meet compliance standards.
The new crypto licensing Australia structure could also influence other countries in the region. Governments often watch successful regulatory frameworks before creating their own policies. Australia now stands at a crucial moment in the evolution of its digital asset sector. The decisions made today could shape the country’s crypto landscape for years to come.

MARKETS week ahead: March 16 –22Last week in the news
Geopolitical tensions in the Middle East continue to weigh on the U.S. equity market. Growing concerns that rising oil prices could fuel inflation and slow economic growth have put burden on investor sentiment, pushing the S&P 500 to a new yearly low and marking its third consecutive weekly decline. The index finished Friday’s session at 6,632. On the same grounds US Treasury yields strongly gained, closing the week at 4,28% and ahead of the FOMC meeting. The US Dollar continues to gain in value, pushing the price of gold lower, modestly above the $5K mark. The only market which has not been affected by any of current developments is the crypto market. BTC even managed to mark a weekly gain, closing the week above the $70K.
Last week in the U.S. was dominated by key releases on inflation, the labor market, and economic growth. February inflation came in at 0.3% m/m and 2.4% y/y, broadly matching market expectations. Core inflation stood at 0.2% m/m and 2.5% y/y. The Federal Reserve’s preferred inflation gauge, the PCE Price Index, rose 0.3% m/m and 2.8% y/y in January, also in line with forecasts, while core PCE was recorded at 0.4% m/m. Meanwhile, the second estimate of Q4 GDP growth surprised markets on the downside, showing the U.S. economy expanding by just 0.7%, compared with expectations of 1.4%. Labor market data released toward the end of the week showed JOLTs job openings at 6.946 million in January, roughly in line with forecasts. The FOMC meeting and interest rate decision is scheduled for Wednesday, March 18th. According to the CME Group FedWatch Tool, the market currently sees almost no chance of a rate cut at the March FOMC meeting, with odds of even 99%.
Goldman Sachs warned that the S&P 500 could slide toward 6,300 if U.S. economic growth weakens significantly, highlighting risks to equity valuations from slowing activity. The firm’s caution reflects concerns that softer macro data could weigh on corporate earnings and investor sentiment. Analysts at Goldman pointed to escalating uncertainty in the economic outlook as a key factor that could drive the benchmark lower. This downside scenario underscores the market’s sensitivity to growth trends amid ongoing inflation and geopolitical pressures.
A federal judge has blocked Department of Justice subpoenas targeting Federal Reserve Chair Jerome Powell, ruling they lacked evidence of criminal wrongdoing and appeared politically motivated, potentially aimed at pressuring him on monetary policy. The Justice Department said it will appeal.
CRYPTO MARKET
Regardless of the general correction on traditional markets in light of the increasing oil prices and its potential negative influence on inflation, the crypto market was holding its grounds firmly. Moreover, total crypto market capitalization managed to gain in value during the week. Considering generally negative investors sentiment on markets, this is actually good news for BTC and the crypto market. During the previous week total crypto market capitalization was increased by 4,1%, adding $94B to its total cap. Daily trading volumes were modestly increased to the level of $193B on a daily basis, from $144B traded a week before. Total market capitalization since the beginning of this year currently stands in a negative territory of -19%, with a total outflow of -$555B.
BTC and ETH once again led the market move. Bitcoin increased by 4.5% on a weekly basis, while Ethereum outperformed slightly with a 5.4% w/w gain, reinforcing the positive tone across the broader market. XRP also traded higher, advancing 2.8%, while BNB rose 5.1% during the week. Other major assets followed the upward trend, with Solana gaining 4.5%, Tron 4.6%, and Avalanche standing out with a stronger 6.8% weekly increase. Among the strongest performers within majors, Hyperliquid clearly led the market, surging 25.7% w/w and marking the most significant weekly gain. On the negative side, only a few assets finished the week in red among which, Filecoin recorded the largest decline, falling 8.7% w/w.
Outside of the main coins, several tokens delivered exceptional performance. DeXe led the market with an impressive 47.3% weekly surge, followed by River with a 30.7% increase, while Render gained 29.3% w/w, placing them among the strongest performers across the broader crypto universe.
Circulating supply developments remained modest for most assets. However, this week marked an important milestone for Bitcoin, as the 20 millionth BTC was mined, meaning that more than 95.2% of the maximum 21 million supply is now in circulation. Only 1 million BTC remain to be mined, which is expected to occur gradually over the next approximately 114 years. Among other assets, Filecoin recorded the largest increase in circulating supply at 0.3% w/w, while Solana, Algorand, Stellar, DOGE, Zcash and DASH each registered 0.1% growth. Hyperliquid remained the only asset with a slight 0.2% decrease in circulating supply during the week.
CRYPTO FUTURES MARKET
Bitcoin futures extended their recovery this week, posting another round of solid gains across the entire term structure. The March 2026 maturity increased by 4.44% w/w, settling at $71,325. Similar advances were recorded along the curve, with weekly gains ranging between 4.23% and 4.45%. The April 2026 maturity showed the strongest increase at 4.45%, while the December 2027 contract closed at $78,215, up 4.30% on the week. Overall, the data point to a broad based upward shift in the Bitcoin futures curve, reflecting continued improvement in market sentiment and sustained buying interest across both near- and longer-dated maturities.
Ether futures recorded even stronger gains during the week, outperforming Bitcoin futures across the curve. The March 2026 contract settled at $2,107, rising 6.15% w/w. Across the term structure, weekly gains ranged from 6.03% to 6.17%, with the April 2026 maturity registering the largest increase at 6.17%. The December 2027 maturity closed at $2,329, representing a weekly gain of 6.06%.

TOTAL MCAP to all time highs!!! Long-term analysisHistorically if the total marketcap of crypto drops below 2.25T it gets bought up or at least averages around this area. Marked by the white crosshair this recent dip we just faced is no different.
I have buy zones marked out in red green and yellow that were created in mid 2024 and have remained untouched since. You can see in early 2024 when it smashed through the green zone only to find resistance at the red zone. Then in late 2024 it smashes through the red zoned and uses it as support.
Fast forward to the present, we have broken the support of the red zone and found a new level of support yellow zone. The price briefly wicked into the yellow and found support, it is now climbing back higher looking like it is ready to smash through the red resistance and shoot up to all time highs in no time.
Last year I told myself if it goes below the red zone IT IS A DISCOUNT!!!
Many altcoins are down 80-90%. Now is the time. Not financial advice but WAGMI.

Total Crypto Market Cap – Key Level TestThe TOTAL market cap recently lost the long-term ascending trendline that had been holding the structure since 2023.
After breaking that support, the market saw a strong downside move and is now attempting a short-term recovery.
Currently the market is trading around $2.44T, trying to reclaim the 0.5 Fibonacci level (~$2.51T).
This area is acting as the first important resistance.
----------------------------------------------------------------------------------------------------------------------
Key levels to watch
Resistance
→ $2.51T (0.5 Fib) – current decision level
→ $2.93T (0.618 Fib) – major resistance above
Support
→ $2.10T (0.382 Fib) – strong liquidity zone
→ $1.85T – $1.60T if downside accelerates
----------------------------------------------------------------------------------------------------------------------
Market structure
After the sharp selloff the market is forming a short-term consolidation below the 0.5 level.
Momentum indicators are showing early signs of recovery, but the structure is still technically bearish until resistance is reclaimed.
----------------------------------------------------------------------------------------------------------------------
Possible scenarios
Bullish scenario
If TOTAL manages to reclaim and hold above $2.51T, we could see a continuation move toward:
→ $2.93T (0.618 level)
This would signal that the recent breakdown may turn into a liquidity sweep before continuation.
Bearish scenario
If price fails to reclaim the 0.5 level and gets rejected, the market could rotate back toward:
→ $2.10T liquidity zone
A breakdown there could open the door for a deeper correction toward $1.85T–$1.60T.
----------------------------------------------------------------------------------------------------------------------
Summary
The $2.5T level is the key decision point right now.
• Above → recovery toward $2.9T
• Below → risk of another move toward $2.1T

BULL MARKET HIGHS & BEAR MARKET LOWSThe chart illustrates the total cryptocurrency market capitalization by highlighting past peaks during bull markets and the lowest points reached in bear markets. This breakdown provides a clear historical perspective, enabling viewers to easily identify significant market movements and trends over time. I am not making predictions about future market movements; rather, I simply chart the data, allowing probability to indicate what is visible in the chart. Please note that the final ray line, shown in red, functions as a sliding scale and can provide support at any value within the range box.

TOTAL - Still Mirroring 2022Some really important confirmations are developing this week. Yesterday I examined Bitcoin's daily chart and compared it to the 2022 bear market fractal. Today I want to zoom out to the TOTAL weekly chart and highlight a structure that demands attention.
For a much deeper dive on this topic, I highly recommend reading my article "Bitcoin: The 2022 Blueprint and What It Means for 2026."
In 2022, Bitcoin experienced a large retracement during its second bear market leg, then printed a weekly gravestone doji. The following week, price attempted to rally (posting approximately a 6% gain and filling around 58% of the previous week's wick) before failing, creating a micro lower high, and collapsing once the weekly open was broken. This is what I have labeled "Phase 5" in my article.
The 2026 structure is developing in a remarkably similar fashion, one that will either be validated or negated by this week's close.
Price has seen a large retracement during the second leg of the current bear market. Last week, BTC printed a weekly gravestone doji. So far this week, price has rebounded approximately 7.5%, filling roughly 70% of last week's wick. No confirmation has been given yet, but if the next lower high is established around $71,000, this would be an extremely close mirror of the 2022 fractal.
If price begins to retrace and pull back over the remainder of this week, the most critical level on the chart to watch is what I have marked as the "Weekly Break Level" (the weekly open). A drop below this level would be an extremely bearish warning sign.
As long as price holds above it, bulls can begin to regain momentum. However, a weekly close at or below that level should put the 2022 fractal firmly back on the table. A black swan event could accelerate this, but only time will tell.
This week's weekly close is crucial for the entire crypto market. Watch it closely.

TOTAL - Expect Massive Volatility Keeping this one short and simple. In alignment with much of the broader crypto market, TOTAL has also printed a weekly gravestone doji.
This candle is likely to signal a continuation of the downtrend, but only if price breaks below the close and low of last week's candle. If buyers can hold that close and remain in control, this could mark the beginning of a solid uptrend.
The most important thing to note on the TOTAL chart is how cleanly the weekly candles are respecting the Fibonacci levels. Price is currently sitting in a perfect range between support and resistance. The 0.618 around $2.1 trillion acting as strong demand, and the 0.5 around $2.5 trillion acting as strong selling pressure.
Monday's open will tell us a lot.

March Altcoin Analysis Request – Limited SlotsGlobal tension and ongoing geopolitical conflicts are currently creating extreme uncertainty across financial markets. With increasing instability around the world, market structure has become more reactive, volatile, and difficult to predict, especially within the crypto sector.
Because of this environment, March analysis will be approached with a strict risk-management mindset, focusing only on clear technical structures, strong support zones, and realistic scenarios rather than speculative expectations.
🔹 Only 20 altcoins will be analyzed for March
🔹 First come, first served
🔹 Focus will remain on structure, downside protection, and high-probability zones
Drop the altcoin ticker in the comments if you want it reviewed for March.
Once the 20 slots are filled, the request window will be closed.

MARKETS week ahead: March 8 –14Last week in the news
Emerging inflation pressures, spiking oil prices, Middle East tensions, potential stagflation in the U.S. and weakening US jobs market are currently main topics among investors. There are too many uncertainties, which makes them reluctant to come out from the risk-off mode. As U.S. Dollar gained in strength, so the price of gold modestly reverted, but only to the level of 45,2K. The 10Y Treasury yields are spiking again amid fears of inflation, closing the week at 4,13%. The US equity markets continue to be under pressure, with S&P 500 closing again lower, at 6.740. The crypto market tried to make progress toward the upside, however, it swiftly reverted back to previous levels, with BTC closing the week above the $68K.
Friday brought the week’s most important U.S. macro release as investors focused on the latest labor market data. February nonfarm payrolls unexpectedly showed a decline of -92K jobs, far below market expectations for a +59K increase, while the unemployment rate rose to 4.4% from 4.3%, also missing forecasts. The disappointing data triggered a negative reaction in financial markets. Meanwhile, average hourly earnings increased 0.4% m/m and 3.8% y/y in February. Many analysts are now mentioning that increasing oil prices due to Middle East conflict could easily spill over into inflation figures and make any potential Fed rate cuts postponed for some future period. Increased inflation could also impact further slowdown in the US economy, with increasing risks for the jobs market.
The People’s Bank of China extended its gold-buying streak to a 16th consecutive month in February, continuing to build reserves as geopolitical tensions in the Middle East increased demand for safe-haven assets. China’s central bank added about 30,000 troy ounces of gold, lifting total holdings to 74.22 million ounces, while bullion prices rebounded above the $5,000 per ounce level amid rising global uncertainty. The continued accumulation also reflects China’s longer term strategy of diversifying reserves and gradually reducing reliance on the U.S. dollar, a trend that has accelerated in recent years.
Shares of Palantir Technologies climbed about 15% over the week, marking their strongest performance in months as rising tensions linked to the Iran conflict boosted investor interest in defense- and AI-related companies. Investors increasingly view Palantir as a beneficiary of higher military spending and the growing role of data analytics and artificial intelligence in modern warfare.
BlackRock’s shares dropped about 7% Friday after the firm limited withdrawals from its HPS Corporate Lending Fund for the first time. Investor redemption requests reached 9.3% of the fund’s shares, exceeding the 5% quarterly repurchase limit the fund had committed to. As a result, the fund said it would buy back only up to the minimum 5% this quarter. The news pushed BlackRock stock down nearly 10% for the year and made it one of the worst performers in the S&P 500 that day.
Shares of Marvell Technology surged about 18% after the chipmaker reported better-than-expected quarterly results and issued a strong outlook driven by demand for AI infrastructure. CEO Matt Murphy said orders tied to artificial-intelligence data centers continue to accelerate, highlighting robust demand for the company’s networking and custom-chip products used in large-scale AI systems.
CRYPTO MARKET
Currently there is a lot on the mind of investors on the market, including the latest increased oil prices due to conflict in the Middle East, hence, risk-off mode still stays on. The crypto market had a modest attempt to move from its current “chopping” phase, but it soon reverted back toward the old path. A new liquidity inflow continues to be on-hold. Total crypto market capitalization increased by 2.8% during the week, adding $63B to its market cap. Daily trading volumes were only modestly decreased to $144B, from $166B traded a week before. Total market capitalization since the beginning of this year currently stands in a negative territory of -22%, with a total outflow of -$649B.
BTC and ETH once again set the tone for the market. Bitcoin increased by 3.5% on a weekly basis, while Ethereum followed closely with a 3.4% w/w gain, indicating a moderate return of buying interest in the largest caps. XRP also traded higher, gaining 2.3%, while BNB rose 2.7% during the week. Other large-cap assets such as Solana and Avalanche advanced 2.6% and 2.9% respectively. Among the strongest performers Maker stood out with a notable 9.9% weekly increase, marking the largest gain among major coins. SUI also delivered a strong performance with a 6.3% rise, while Monero moved 5.7% higher on a weekly basis.
On the negative side, DOGE experienced the most pronounced decline, falling 10.4% w/w, clearly underperforming the broader market. POL (previously MATIC) also faced notable pressure with an 8.1% weekly loss, while Polkadot declined 5.0% and Cardano slipped 4.8% during the same period.
Outside of the majors, several tokens delivered significant upside momentum this week. River led the market with a surge of 37.4% w/w, followed by Pi with a 35.3% weekly gain, while OKB advanced by 33.2%, placing them among the strongest performers in the broader crypto universe.
Circulating supply changes remained relatively moderate across most assets. SUI recorded the largest weekly increase in circulating supply at 1.3%, while Polkadot and Filecoin both expanded supply by 0.6%. XRP and Tether saw a 0.2% increase, while Stellar, DASH, Zcash and POL each recorded 0.1% growth in supply. On the other hand, DOGE had a significant decrease in circulating supply of -9.2% w/w.
CRYPTO FUTURES MARKET
Bitcoin futures rebounded this week, reversing the declines observed in the previous period and posting solid gains across the entire term structure. The March 2026 maturity increased by 3.67% week-on-week, settling at $68,295. Contracts along the curve recorded similar advances, with weekly gains ranging around 3.63%. The August 2026 maturity showed the strongest increase, rising 3.93%, while the December 2027 contract closed at $74,990, up 3.83% on the week. The broadly uniform gains across maturities indicate a parallel upward shift in the Bitcoin futures curve, reflecting improved market sentiment and renewed buying interest across both near- and longer-dated futures.
Ether futures also moved higher during the week, following the recovery observed in Bitcoin futures, although the magnitude of the increase remained slightly more moderate. The March 2026 contract settled at $1,985, rising 2.96% w/w. Across the curve, gains ranged from 2.82% to 3.25%, with the August 2026 maturity recording the largest weekly increase at 3.25%. The December 2027 maturity closed at $2,196, marking a weekly gain of 2.86%.
Despite the recovery in prices, both Bitcoin and Ether futures curves continue to display a contango structure, with longer-dated maturities trading at progressively higher price levels than near-term contracts. This suggests that market participants maintain expectations of higher valuations further along the forward curve, while the recent weekly gains point to a stabilization in sentiment following the prior period of declines.
