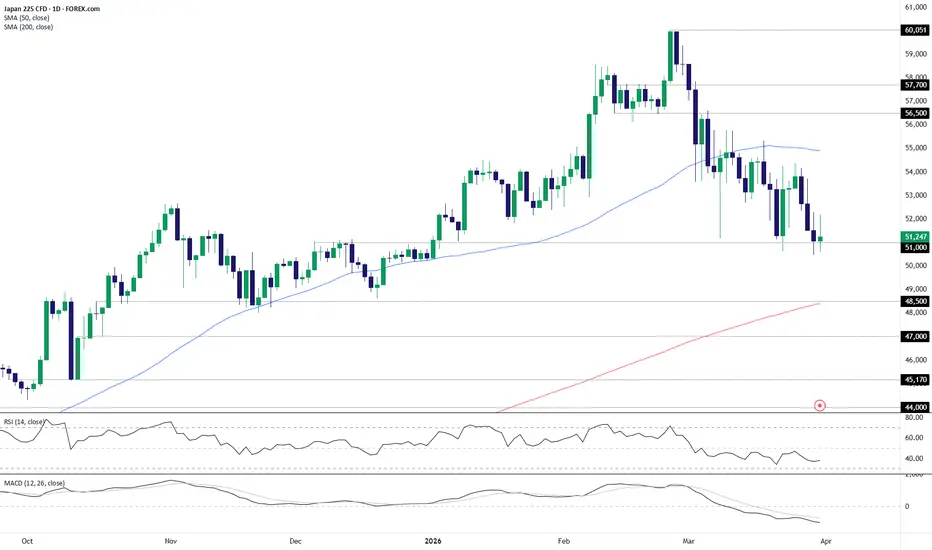
Nikkei: Heavy tape, 51000 under threat51000 is the line in the sand for Nikkei bulls. Defend it, or risk enticing more participants into the unwind already seen.
We’ve seen multiple bearish break attempts in March, all of which have failed. But the telling thing is the string of lower highs from bounces, sequentially failing around the 50DMA and, more recently, ahead of 54000. The index looks heavy.
RSI (14) is yet to set lower lows but remains below 50, indicating downside pressure remains in the ascendancy, a signal backed up by MACD which is motoring lower in negative territory.
Risks are therefore tilted to the downside, but they are unlikely to be acted upon until we see a definitive break, ideally accompanied by a close. Otherwise, it risks being just another failed break, potentially paving the way for a retest of sellers parked above 54000.
A sustained break of 51000 would allow for a stop to be placed above the level for protection, targeting the intersection of 48500 support and the 200DMA.
From a fundamental perspective, the longer the Iran war disrupts energy supply and keeps prices elevated, the greater the downside risk to Japanese corporate earnings, especially industrial names who derive a substantial share of revenues from offshore.
Good luck!
DS
Community ideas
USD Index, EUR/USD, GBP/USD, USD/JPY OutlookI outline why I think the US dollar could continue higher towards 102, but not before a pullback due to price action clues from EUR/USD, GBP/USD and USD/JPY.
MS.

Potential bearish drop off?Ethereum (ETH/USD) has rejected the pivot and could drop towards the 1st support.
Pivot: 2,079.39
1st Support: 1,950.25
1st Resistance: 2,183.23
Disclaimer:
The opinions given above constitute general market commentary and do not constitute the opinion or advice of IC Markets or any form of personal or investment advice.
Any opinions, news, research, analyses, prices, other information, or links to third-party sites contained on this website are provided on an "as-is" basis, are intended to be informative only, and are not advice, a recommendation, research, a record of our trading prices, an offer of, or solicitation for, a transaction in any financial instrument and thus should not be treated as such. The information provided does not involve any specific investment objectives, financial situation, or needs of any specific person who may receive it. Please be aware that past performance is not a reliable indicator of future performance and/or results. Past performance or forward-looking scenarios based upon the reasonable beliefs of the third-party provider are not a guarantee of future performance. Actual results may differ materially from those anticipated in forward-looking or past performance statements. IC Markets makes no representation or warranty and assumes no liability as to the accuracy or completeness of the information provided, nor any loss arising from any investment based on a recommendation, forecast, or any information supplied by any third party.

Technical Analysis: Crude Oil (WTI) march 31 2026
Technical Analysis: Crude Oil (WTI)
Price Action
· Monday opened with a decisive break above the $100 resistance, confirming bullish momentum.
· Currently trading above $101, holding well above the former range top.
· The breakout follows a prior week of strong buy-side demand visible on the W1 candle, signaling institutional accumulation.
Outlook
· With the $100 level now acting as support, the immediate technical target is a retest of the recent $119 high.
· The previous consolidation range ($85–100) is complete, and price has entered a new leg of the uptrend.
· Key resistance lies at $119; a daily close above that opens the door to higher levels.
Risks
· Geopolitical tensions remain elevated (Iran / Hormuz / Kharg Island threats), adding a supply-side risk premium.
· Failure to hold above $100 would invalidate the bullish setup and trigger a pullback toward $95.
Summary
Bullish breakout confirmed. Expect upside continuation toward $119 in the coming sessions. Stop discipline below $100.
Not financial advice. Past performance does not guarantee future results.

NZDUSD H1 | Bearish Reaction Off Key ResistanceMomentum: Bearish
Price is currently below the ichimoku cloud.
Sell entry: 0.57402
- Overlap resistance
- 78.6% Fib retracement
- 100% Fib projection
Stop Loss: 0.57525
- Overlap resistance
Take Profit: 0.57152
- Swing low support
High Risk Investment Warning
Stratos Markets Limited (fxcm.com/uk), Stratos Europe Ltd (fxcm.com/eu):
CFDs are complex instruments and come with a high risk of losing money rapidly due to leverage. 69% of retail investor accounts lose money when trading CFDs with this provider. You should consider whether you understand how CFDs work and whether you can afford to take the high risk of losing your money.
Stratos Global LLC (fxcm.com/en): Losses can exceed deposits.
Please be advised that the information presented on TradingView is provided to FXCM (‘Company’, ‘we’) by a third-party provider (‘TFA Global Pte Ltd’). Please be reminded that you are solely responsible for the trading decisions on your account. Any information and/or content is intended entirely for research, educational and informational purposes only and does not constitute investment or consultation advice or investment strategy. The information is not tailored to the investment needs of any specific person and therefore does not involve a consideration of any of the investment objectives, financial situation or needs of any viewer that may receive it. Past performance is not a reliable indicator of future results. Actual results may differ materially from those anticipated in forward-looking or past performance statements. We assume no liability as to the accuracy or completeness of any of the information and/or content provided herein and the Company cannot be held responsible for any omission, mistake nor for any loss or damage including without limitation to any loss of profit which may arise from reliance on any information supplied by TFA Global Pte Ltd.
Stratos Trading Pty. Limited (fxcm.com/au):
Trading FX/CFDs carries significant risks. FXCM AU (AFSL 309763), please read the Financial Services Guide, Product Disclosure Statement, Target Market Determination and Terms of Business at fxcm.com/au

buy setup coming GBPJPYAfter that abc setup i see price is likely to continue bullish in the direction of the impulsive diagonal setup

Can Science Build a $1 Trillion Moat?A Pharmaceutical Titan in Full Transformation
Eli Lilly and Company is undergoing one of the most consequential transformations in modern pharmaceutical history. No longer simply a drug manufacturer, the company has evolved into a high-tech industrial platform, one that fuses cutting-edge biological science with autonomous manufacturing systems and artificial intelligence. At the center of this revolution is tirzepatide, a first-in-class dual GIP and GLP-1 receptor agonist marketed as Mounjaro (diabetes) and Zepbound (obesity). This molecule has become the engine of Lilly's financial ascent, delivering 23.6% average weight loss in clinical trials and outperforming rival semaglutide by 47% in relative weight loss. In 2025, the company reported revenue of $65.2 billion, a performance that drove a 40% total shareholder return, and issued 2026 guidance of $80 to $83 billion, representing a projected year-over-year increase of 23% to 27%. With a market capitalization that recently crossed the $1 trillion threshold, Lilly's rise is not a speculative story; it is a structural, multi-domain rearchitecting of the global healthcare economy.
Manufacturing Moat and Geopolitical Realignment
To sustain its dominance, Lilly is constructing a manufacturing fortress that smaller competitors cannot replicate. The company has committed over $55 billion to 13 new production sites worldwide, including a $3 billion facility in Katwijk, Netherlands, featuring fully automated "dock-to-dock" systems, and a €400 million biopharmaceutical plant in Limerick, Ireland. On the horizon, its next-generation oral GLP-1 drug, orforglipron, could be priced as low as $149 per month, a move that would fundamentally reprice the entire obesity treatment category. Simultaneously, Lilly is navigating the geopolitical turbulence created by the BIOSECURE Act, which threatens to restrict partnerships with Chinese biotechnology suppliers by 2032. With Chinese firms representing 13% of global active pharmaceutical ingredient manufacturers, the company is actively reshoring production to allied nations, a costly but strategically vital shift. These capital-intensive decisions are not merely defensive; they are offensive moves designed to lock out rivals and create a decade-long supply chain advantage.
AI, Pipeline Innovation, and Patent Durability
Lilly's competitive edge extends deep into the future through its integration of artificial intelligence and a robust pipeline of next-generation molecules. A $1 billion partnership with NVIDIA has yielded AI-powered "factories" capable of analyzing complex protein structures, while a $2.75 billion collaboration with Insilico Medicine is compressing drug discovery timelines from years to months. The pipeline's crown jewel is retatrutide, a triple agonist targeting GIP, GLP-1, and glucagon receptors, which demonstrated 16.8% weight loss in just 40 weeks without a plateau, a signal of even greater potential. On the intellectual property front, tirzepatide is shielded by 23 separate U.S. patents, with an estimated generic launch for Zepbound not until 2039, providing over a decade of high-margin exclusivity. Policy shifts, including the CMMI BALANCE Model that caps Medicare out-of-pocket costs for GLP-1 drugs at $50 monthly starting in 2027, further expand the addressable population, turning weight-loss medications into affordable standards of care for millions.
Risks, Valuations, and Analyst Consensus
Despite its commanding position, Lilly is not without meaningful risks. Realized prices fell 7% in Q4 2025 even as volume surged 50%, signaling intensifying pressure from pharmacy benefit managers demanding larger rebates. Competitive threats are materializing from Structure Therapeutics, Roche, and AstraZeneca, particularly around the emerging "muscle preservation" standard expected to define the next generation of obesity trials in 2027. A 16% year-to-date share price decline in early 2026 has created what many analysts view as a compelling entry point: over 91% of covering analysts maintain a "Buy" rating, with an average price target near $1,223 per share, and a PEG ratio of 0.41 that suggests the stock remains undervalued relative to its growth trajectory. The lone dissenting voice, HSBC, which issued a "Reduce" rating with an $850 target, argues that consensus market size estimates above $150 billion may be too optimistic. Yet with revenue growth at 4x the S&P 500 average and 2026 non-GAAP EPS guidance of $33.50 to $35.00, Eli Lilly remains, by most metrics, the highest-conviction large-cap opportunity in the global healthcare sector.

Iran conflict and Key US Data Collide to Influence sentimentIt’s the start of a critical week for US 100 traders. The index entered correction territory on Friday, officially defined as a move of 10% below its previous high, and it briefly extended that fall in early trading this morning when it touched a low of 22901 before recovering to trade around 23162 at time of writing (0700 BST). Part of the reason for the early drop to 8-month lows could have been news of the arrival of 3500 US troops in the Middle East region on Saturday, via an amphibious assault ship (Bloomberg), which has forced traders to consider the possibility of a US led ground assault of Iran, or it could have been news that Iranian backed Houthi rebels in Yemen have officially entered the conflict after firing ballistic missiles at Israel over the weekend, opening up a new risk to oil shipments from the region.
Whatever the reason for the fall and initial rebound, the price action may have already grabbed the attention of traders, which could be a good thing considering the list of scheduled events this week that may also influence the direction of the US 100 index. For example, later today Federal Reserve Chair Jerome Powell is due to speak (1530 BST) at a moderated discussion at Harvard University. Any comments he makes regarding the impact of the Iran war on inflation, growth or future interest rate moves could set the early tone for risk sentiment.
Not only that, but there are also 4 updates on the health of the US labour market due this week, starting with the JOLTs Job Openings release at 1500 BST on Tuesday, then ADP Private Sector Payrolls on Wednesday (1315 BST), Initial Jobless Claims on Thursday (1330 BST) and ending with the pivotal Non-farm Payrolls release on Friday (1330 BST). These releases may face a deeper level of scrutiny and their outcome could have a more significant influence on the direction of the US 100 index as traders try and ascertain the on-going impact of the Iran conflict on US economic growth.
Technical Update: A Potentially Important Breach of Support in Focus
Recent price activity within the US 100 index has been skewed to the negative side. The latest decline produced the first closing breaks below 23834, the November 21st correction low, and pushed the index to levels last seen on September 2nd, 2025.
In the current uncertain environment, traders may be asking whether this decline has further to run.
Potential Support Levels:
Following the latest price weakness, support levels are the first area to monitor. As shown in the chart below, the September 2nd low at 22990 may now be a key level for traders to focus on.
It may prove useful to monitor how 22990 is defended on a closing basis. While a sustained close below this level may not guarantee further weakness, it could suggest scope for a move toward 22424, which is the 38.2% retracement of the entire April 7th to October 30th 2025 advance. If 22424 is then also broken on a closing basis, it could imply a more extended phase of weakness and a deeper retracement.
Potential Resistance Levels:
While support at 22990 continues to hold on a closing basis, the risks for price strength and fresh upside could begin to reemerge. This could place initial resistance at 23621, a level which is equal to half of the latest decline, under pressure. Closing breaks above this level could indicate potential for attempts at renewed price strength.
As shown in the chart above, a closing break above 23621, may shift focus toward the next resistance at 23879, which is the 38.2% retracement of the latest weakness. Breaks above this level could then potentially open moves toward 24178, the 50% level, and even 24476, the higher 61.8% retracement.
The material provided here has not been prepared accordance with legal requirements designed to promote the independence of investment research and as such is considered to be a marketing communication. Whilst it is not subject to any prohibition on dealing ahead of the dissemination of investment research, we will not seek to take any advantage before providing it to our clients.
Pepperstone doesn’t represent that the material provided here is accurate, current or complete, and therefore shouldn’t be relied upon as such. The information, whether from a third party or not, isn’t to be considered as a recommendation; or an offer to buy or sell; or the solicitation of an offer to buy or sell any security, financial product or instrument; or to participate in any particular trading strategy. It does not take into account readers’ financial situation or investment objectives. We advise any readers of this content to seek their own advice. Without the approval of Pepperstone, reproduction or redistribution of this information isn’t permitted.

NAS100: Crashed to 22,900 Then Bounced — Bullish MSS This analysis uses SmartFlow SMC (Free) — auto-detects BoS, MSS, EQH/EQL, BSL/SSL, and Sweeps. No repainting. Community Scripts. Pro version coming soon.
═══════════════════════════════════════
█ STRUCTURE
NAS100 had the most dramatic move of the four. Crashed from 24,400 to 22,900 — a nearly 1,500-point drop. Then bounced with bullish MSS and BoS stacking to 23,259.
SmartFlow shows LONG/Bullish, but EMA200 is at ~23,500 — still $240 above price. The structure has flipped but the macro filter hasn't confirmed yet.
This is where gold was about a week ago: bullish structure but below EMA200. The question is whether NAS100 follows gold's path (eventually reclaiming EMA200) or repeats the failed pattern.
█ KEY LEVELS
Resistance: 23,500 (EMA200 — the key test)
Resistance: 23,800 (prior BoS zone)
Support: 23,100-23,200 (BoS structure base)
Below: 22,900 (Sweep low — invalidation)
█ CROSS-ASSET SCORECARD
End of week 3 — the macro picture has shifted dramatically:
XAUUSD: ✅ LONG / Above EMA200 / Bullish — LEADER
BTCUSD: ✅ LONG / Above EMA200 / Bullish — following gold
EURUSD: ❌ SHORT / Below EMA200 / Bearish — dollar strength holdout
NAS100: ⏳ LONG / Below EMA200 / Bullish — structure flipped, EMA200 test ahead
Two weeks ago, all four were bearish. Now 3 of 4 have bullish structure. Gold is leading the recovery.
Not financial advice. For educational purposes only.

Will gold prices surge again?Market Outlook: Gold Bulls Face Uphill Battle Amid Hawkish Shift
As the U.S.-Iran conflict enters its second month, the odds of a rate cut are fading. Soaring energy prices are expected to stoke inflation, narrowing the window for monetary easing—a sharp reversal from the pre-conflict consensus of two potential cuts.
Technical Analysis:
Daily Chart: Gold remains capped below the 100-day MA ($4,633). The 14-day RSI sits near 36, indicating bearish momentum that has yet to reach oversold territory.
Signals: A "Death Cross" (21-day and 50-day MAs) confirmed on March 25 continues to signal a downtrend. While selling pressure has stabilized over the last two sessions, prices remain below key short-term moving averages, keeping the outlook weak.
Support: Buying interest emerged near $4,099, suggesting bulls are attempting to regain control.
Strategy: Gold has entered a broad consolidation phase. For today’s session, consider a "long then short" tactical approach (buying the dip before selling the rally).

FX Markets MovingThe last two weeks in the FX futures markets have been dominated by a powerful "risk-off" surge, propelled by the escalating conflict in the Middle East. The U.S. Dollar Index surged to a 10-month high, breaking past the 100.50 mark as traders flocked to the greenback’s safe-haven status and adjusted to a "higher-for-longer" interest rate environment. This bullish momentum was cemented by the Federal Reserve’s March 18 meeting, where a "hawkish hold" signaled only one projected rate cut for 2026. Simultaneously, surging energy prices have intensified inflationary fears, further supporting the dollar while severely pressuring energy-importing currencies.
In contrast, major G10 currencies like the Euro and British Pound have faced significant technical breakdowns in the futures pits. The EUR/USD pair collapsed toward 1.1400, hit by a "stagflationary" cocktail of rising input costs and weakening manufacturing data, which has complicated the European Central Bank's policy path. Meanwhile, the Japanese Yen has remained under intense pressure, with the USD/JPY futures briefly breaching the 160.00 level. This move has reignited fears of direct market intervention by Japanese officials, as the Bank of Japan grapples with the dual threat of cost-push inflation and a deteriorating terms-of-trade balance.
If you have futures in your trading portfolio, you can check out on CME Group data plans available that suit your trading needs tradingview.com/cme/
*CME Group futures are not suitable for all investors and involve the risk of loss. Copyright © 2023 CME Group Inc.
**All examples in this report are hypothetical interpretations of situations and are used for explanation purposes only. The views in this report reflect solely those of the author and not necessarily those of CME Group or its affiliated institutions. This report and the information herein should not be considered investment advice or the results of actual market experience.

ES - March 30th - Daily Trade PlanMarch 30th - Daily Trade Plan - 7:55am
*Before reading this trade plan, if you did not read yesterday's take the time to read it first! (You can view the posts in the related publication section) *
If my posts provide quality information that has helped you with your trading journey. Feel free to boost it for others to find and learn, also!
My daily trade plan and real-time notes that I post are intended for myself to easily be able to go back and review my plan and how I did from an execution perspective.
** NOTE - Contract Roll: ES is in the process of rolling over from the March 2026 (ESH2026) front month contract, to June (ESM2026) front month contract. You will see that the contract price has changed and past levels are now different. I will be using the June (ESM2026) contract levels moving forward until the September contract.
*If you trade before I write out my daily trade plan. You can look at the prior days chart and 9/10 the levels already pre-planned out are still being respected. **
--------------------------------------------------------------------------------------------------------
We gapped down on the open for the 3rd straight week, closed the gap and rallied into the 6481 overnight high. The overnight low is 6366. We continue to be in a downtrend and will need to reclaim 6481-85 to continue higher.
Key Levels Today - Flush & Reclaim
1. 6446
2. 6433
3. 6415
4. 6394
5. 6366
If we do clear 6481, we should be able to back test the 6568 level which is where this most recent breakdown started. My general lean is that we are now in a new range between 6366-6568 that will continue to morph the rest of this week. I do not expect price to lose 6366 until Friday of this week (If we are going to lose it). Institutions are window dressing and looking to keep price higher into end of month/quarter.
I will post an update around 10am EST.
----------------------------------------------------------------------------------------------------------
Purple = A Weekly Low (Current or Previous Week)
Blue = Key Support/Resistance Levels
Yellow = The previous day low (Includes the current weekly daily lows)
Red - Overnight Session High/Low (Prior to my post)

AUDUSD | FRGNT DAILY OUTLOOK | Q1 | W14 | D30 | Y26 |📅 Q1 | W14 | D30 | Y26 |
📊AUDUSD | FRGNT DAILY OUTLOOK |
🔍 Analysis Framework
This forecast is built using an advanced adaptation of Smart Money Concepts, with a structured and disciplined approach:
• Marking Key Points of Interest (POIs) on Higher Time Frames (HTFs) 🕰️
• Defining a clear, controlled trading range from those zones 📐
• Refining entries on Lower Time Frames (LTFs) 🔎
• Waiting for confirmed Break of Structure (BoS) before execution ✅
This process ensures precision, removes emotional decision-making, and keeps me aligned with the overall market narrative.
💡 Core Philosophy
“Capital management, discipline, and consistency create longevity.”
A strong risk-to-reward model, paired with high-probability execution, is the foundation of sustainable trading 📈🔐
⚠️ Understanding Losses
"Losses are part of the game" — a mathematical certainty 🎲
They don’t define performance. Nor do they define you as a Trader.
They are managed, reviewed, and used as evidence for growth 📊
🙏 Final Note
Appreciate you taking the time to review today’s forecast.
Stay disciplined 🎯
Protect your capital 🔐
— FRGNT 🚀📈
📌 Disclaimer
This content is for educational purposes only and does not constitute financial advice.
It reflects my personal approach to the markets — a tested framework that has supported my own journey to consistent profitability in trading currencies.
This is not a signal service, and all trading decisions remain your own responsibility.
Additionally, this post is not intended to breach ANY TradingView House Rules.
FX:AUDUSD

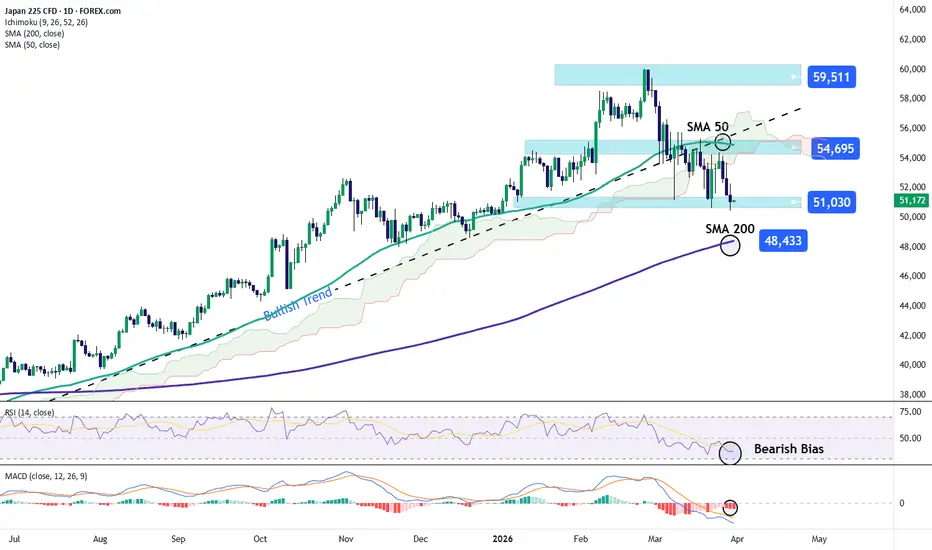
Nikkei continues to show weakness around the 51k levelThe Japanese index has started to show weakness over the last three trading sessions, posting a decline of more than 5% in the short term and reflecting a relevant bearish bias in the chart. For now, selling pressure appears to have re-established itself, partly due to the increase in risk sentiment across markets, which has reduced appetite for risk assets such as the Nikkei. Additionally, a neutral stance from the Bank of Japan limits expectations for rate cuts, strengthening the bond market and reducing the attractiveness of Japanese equities. If these factors persist, a more consistent selling pressure could continue to dominate in the short term.
Bearish move becomes more relevant: Over recent sessions, Nikkei price action has started to break below the long-term upward trendline that had been in place for several months. If the bearish bias continues to consolidate, this could lead to the formation of a new short-term downtrend, potentially dominating price action in the coming sessions. However, it is important to note that the price still faces a key resistance area, which could trigger short-term corrective moves.
RSI: The RSI remains below the 50 level, suggesting that selling momentum continues to dominate over the past 14 sessions. If this behavior persists, it could reinforce a consistent bearish pressure in the short term.
MACD: A similar scenario is observed in the MACD, with the histogram remaining below the zero line, indicating that short-term moving average momentum is still in bearish territory. This supports the view that selling pressure could remain dominant.
Key levels to watch:
54,695 – Key resistance level, aligned with the 50-period simple moving average. Moves toward this area could lead to a sideways scenario if no clear direction emerges.
51,030 – Near-term support, aligned with recent lows. A break below this level could reinforce a dominant bearish bias in the short term.
48,433 – Key support, aligned with the 200-period moving average. A sustained break below this level could trigger a more structured downtrend in the coming weeks.
Written by Julian Pineda, CFA, CMT – Market Analyst
GOLD Local Short!
HI,Traders !
#GOLD went up and made
A retest of the horizontal
Resistance of 4561.86 from
Where we will be expecting
A local bearish pullback
And a move down !
Comment and subscribe to help us grow !

XAUUSD Rejection Zone – Bearish Move ExpectedGold showed a temporary bullish move after breaking the trendline, but now price is approaching a strong SBR + supply zone (around 4550–4615).
This area is a high-probability sell zone, where previous buyers may turn into sellers and fresh selling pressure can enter.
📉 Expectation:
If price rejects this zone, we can see a bearish move toward 4460, and if momentum continues, further downside toward 4315 support.
📊 Overall, this looks like a pullback into supply within a bigger bearish context.

BTC Bullish Setup — Short Squeeze Incoming?BTC is showing strength and holding key levels.
Market looks positioned to liquidate short traders, which could trigger a strong upward move.
If momentum continues, we may see a sharp pump driven by short liquidations.

Expecting a bounce on Google this weekExpecting a bounce on Google this week as RSI is sold on daily. Its supported by trendline on the RSI and also in the support channel. As long it hold up $260, i am expecting a bounce towards $290-300

EURUSD Trading Opportunity! BUY!
My dear friends,
My technical analysis for EURUSD is below:
The market is trading on 1.1508 pivot level.
Bias - Bullish
Technical Indicators: Both Super Trend & Pivot HL indicate a highly probable Bullish continuation.
Target - 1.1550
About Used Indicators:
A pivot point is a technical analysis indicator, or calculations, used to determine the overall trend of the market over different time frames.
Disclosure: I am part of Trade Nation's Influencer program and receive a monthly fee for using their TradingView charts in my analysis.
———————————
WISH YOU ALL LUCK

Sell usdjpyStrong sell
Daily and weekly overbought
Strong supply are reached which shows previous strong bearish engulfing from this level
Hope again sell seen from here

Here comes the money.-BULL TREND
-Triangle (bearish/bullish)
-Price is under moving averages same as 2020
-Administration is pro crypto and endorses US stablecoins
-CURRENT NEWS is bearish, which is bullish.
Crypto is a small market vs other investment, so I see potential growth sill occurring.
Current timeline, I'm major bullish for the next 3 years.
Price target is 100k or top of the trend.

OIL Breakout Done ( Fake Or True ) , Let`s Get This 500 Pips !Here is my 2H Chart on OIL , We Have A Clear Breakout and the price closed above my old res And above my C.T.L after more than 2 weeks the price respect the res and touch it and move to downside but for the first time the price closed above it with 4H Candle and that prove it`s a real breakout and we have a very good bullish Price Action on 4H /Daily T.F Also , the price will try to retest the area and if it give us a good bullish price action on smaller time frames we can enter a buy trade and we can targeting from 200 to 400 pips , if we have a daily closure again below my new res then this idea will not be valid anymore .
Entry Reasons :
1- Clear 4H Breakout .
2- Many T.F Confirmations .
3- Perfect Price Action .
4- Clear Bullish P.A .
5- Broken C.T.L .

USD: Final CountdownTick Tock... Can you hear that? The clock is ticking down. DXY is sitting at the last stage of consolidation, and all that's left is to pull the trigger. Destination: Stratosphere.
# - - - - -
Technicals:
1. : The price has been consolidating above the bottom Support Line of the Long-Term Global Ascending Trend Channel for 350 days as of today. This price behavior suggests that the market may have found a global bottom, indicating that institutional capital is accumulating USD.
2. : The horizontal accumulation channel at resistance/support levels has formed dense order clusters and contains an enormous amount of volume. This range will act as a spring, potentially catapulting the price once it breaks through either the upper or lower boundary..
3. : The psychological mark of $100.00 plays only the orientation role, the more important point is that, taking into account the repeatedly retest of $100.00 mark as bulls are sticking to it from below, the potential upward breakthrough move will be fueled by hunting the numerous stop-losses above the $100.00 and up to $103.50 , which have been set by traders who traded all the time in the channel range.
4. : If price passes through the next target will be:
- the 1D Imbalance zone ,
- the local High at $110.00 and
- the Upper Boundary of Long-term Trend Channel between $118.00 and $122.00
5. : The main targets in time for this 12-15 month long trend are:
- The 250th Anniversary of US Independence ( July 4, 2026, and the following 2–3 weeks ).;
- The US Midterm Elections ( on and around November 3, 2026 );
- The US Inauguration and post-election period, coinciding with the 2026 Annual Corporate Reporting season ( throughout February 2027 );
- Projected turnaround point for Wave 3 ( End of March 2027 ).
# - - - - -
Conclusion:
That being said, the probability of the near-term upward movement for USD is very HIGH.
Note: Before the price brakes above, in worst case there could still be a retest of 0.618 Fibo or even the retest of bottom support at $97.40 . So be aware.
# - - - - -
Long-Term LONG SETUP:
✅ Entry Point 1 : Market
✅ Entry Point 2 : TRIGGER Above $100.70
🛑 Stop-Loss: $94.20
🤑 Target 1: $105.70
🤑 Target 2: $110.37
🤑 Target 3: $117.97
🕒 Timeframe: 15 months
The scenario will be invalidated if we see a strong close of 1D candle below $95.30 .
# - - - - -
Good Luck! ☺️
# - - - - -
DISCLAIMER: Not financial advice. Everyone must make trading decisions at their own risk, guided only by their own criteria and strategy for opening or not opening a trade.
# - - - - -
P.S. Check out my other DXY analyses in Related Publications on the right >>>
P.P.S Follow me to stay updated on this and others setups
