EURUSD: The Bears Dominated March, With April Likely To FollowWelcome back to the Weekly Forex Forecast for the week of Mar. 30 - Apr. 3.
EURUSD is looking to close the month of March bearish, with plenty of momentum. Look
for that momentum to continue into this week.
Any short term pullback may present a good short entry.
Enjoy!
May profits be upon you.
Leave any questions or comments in the comment section.
I appreciate any feedback from my viewers!
Like and/or subscribe if you want more accurate analysis.
Thank you so much!
Disclaimer:
I do not provide personal investment advice and I am not a qualified licensed investment advisor.
All information found here, including any ideas, opinions, views, predictions, forecasts, commentaries, suggestions, expressed or implied herein, are for informational, entertainment or educational purposes only and should not be construed as personal investment advice. While the information provided is believed to be accurate, it may include errors or inaccuracies.
I will not and cannot be held liable for any actions you take as a result of anything you read here.
Conduct your own due diligence, or consult a licensed financial advisor or broker before making any and all investment decisions. Any investments, trades, speculations, or decisions made on the basis of any information found on this channel, expressed or implied herein, are committed at your own risk, financial or otherwise.
Community ideas

OIL - Sunday Developments So far price is staying right in line with the SUN/MON fractal that has played out for the last 3 weeks. For a more detailed explanation check out my last post:
So far, price is staying right in line with the Sunday/Monday fractal that has played out for the past three consecutive weeks.
Something very interesting has occurred within the first four hours of the Asia session. Price began with a print higher followed by an immediate dump (identical to the previous Sunday sessions, with the exception of the move that produced the $119.48 high). Another key development is that price is struggling to hold above the $103 level (0.618 of the micro trend I outlined in my last post).
Since I laid out the bullish case in detail in my last post, I want to focus here on how the bearish scenario could play out and how the fractal could repeat for a fourth consecutive week.
Early this evening, headlines have begun to emerge such as: "20 large oil tankers to be escorted through the Strait of Hormuz under US Navy escort." If large quantities of oil are successfully passing through the Strait, this would be a major development and should create increased downside pressure on price. The most significant headlines will likely develop throughout Monday, but these early signals suggest a coordinated effort to engineer another large Monday drop which would be consistent with what we have seen over the past three weeks.
From a purely technical standpoint, the structure is also setting up well for a rejection.
Price appears to be forming a 4H doji or spinning top candle (both indecision signals that often precede reversals). In addition, the 4H RSI is sitting exactly at overbought conditions, meaning a rejection from here would be the perfect structural move to the downside from a momentum perspective.
One additional note: This structure could also be interpreted as a rising wedge rather than the ascending triangle I outlined in my last post. If that is the case, price has just rejected from the top of the wedge and may be positioning for a move lower.
Of course, major volatility is expected this week regardless of direction. If price does not begin dropping and instead breaks above the high of this candle with 4H or higher timeframe candle body closes above $103, this idea will be negated and the ascending triangle breakout from my previous post becomes the more likely outcome.
Updates to follow as developments continue to unfold.

Lilly - Corrective StructureLet’s take another look at Lilly stock.
In the previous idea, we noted that one more wave up was missing.
However, since that impulse didn’t materialize and the structure is starting to hint at downside potential, it makes sense to consider possible targets.
Key targets:
950
890
The potential move from the current level is 6-12% .
We’re treating this move as a correction to Wave 3 , just a deeper one.
Alternative scenarios with deeper corrections are also possible.
---
Subscribe and leave a comment.
You’ll get new ideas faster than anyone else.
---

Tria moves within an ascending channel, an uptrendThe smaller projects move first, revealing what is coming to the rest of the market.
Here we are looking at TRIAUSDT and we have an interesting chart with a clear uptrend. A recent retrace, and signals coming from the last session that closed, reveals additional growth is possible.
Notice the volume signal here, left side of the chart.
The highest volume ever appeared 16-Feb during a retrace. The low happened and then we see sustained growth. Notice that there isn't any high volume during the growing phase. Lack of volume within this context means a continuation. For as long as this trend remains, volume is not needed. It will show up again once high resistance is met or when the market changes direction.
Here the low happened 11-Feb which is the same day as RECALLUSDT.
What Is Tria?
Tria is the routing and execution layer for modern finance, with a fast-growing neobank as its first reference product. It makes a fragmented world of networks, venues, and legacy endpoints work like one system for moving value.
Tria functions as an intelligence layer for value movement. Instead of forcing users or developers to manage bridges, networks, venues, and settlement paths manually, Tria takes a single intent like send, convert, spend, or earn and routes it end to end for faster settlement, lower leakage, and higher reliability. That intelligence is powered by BestPath.
The consumer neobank is how Tria proves the layer in production. The product experience users see as “a great neobank” is a direct outcome of the routing and execution layer underneath it. Tria been able to quickly execute on building a high-utility, fast-scaling neobank because BestPath makes the underlying execution consistently better.
Tria Products and User Flows
Tria’s neobank consumer app packages a set of everyday financial actions into one account experience, routed by BestPath:
Spend: Visa-powered crypto credit cards available across 150+ countries, supporting spending from 1,000+ token balances.
Trade: Spot swaps and perpetual futures (perps), designed to be accessed directly from a user’s existing balances.
Earn: Vault-based yield functionality for users who park assets over time.
Prediction markets: Outcome-based markets integrated alongside the trading experience.
Across these flows, users express what they want to do and BestPath determines how to execute it across the underlying rails.
Thank you for reading.
Namaste.

Bitcoin Testing Key Structure – Direction PendingOn the daily timeframe, Bitcoin is currently consolidating within a symmetrical triangle structure after a strong bearish move from the highs. This pattern reflects market indecision, where both buyers and sellers are compressing price action toward a potential breakout point.
The 82,800–85,000 resistance zone remains a critical level, acting as a strong supply area where price has previously faced rejection. For bullish confirmation, Bitcoin needs a decisive breakout and daily close above this zone, which could trigger momentum toward higher levels.
On the downside, the triangle structure suggests a potential bearish continuation if support fails. A breakdown below the pattern could lead to a sharp move toward the 40,000–38,000 major support zone, which is a strong demand area on the higher timeframe.
Currently, the market is in a compression phase, and a significant move is expected once price breaks out of this structure.
Key Levels:
Resistance: 82,800 – 85,000
Support: 40,000 – 38,000
Outlook:
Neutral in the short term, but a breakout or breakdown from the triangle will likely define the next major trend direction.

Bearish hoodHood looks like it wants to break down further despite it already being in a massive drawdown. I expect this gap I’m pointing at to fill at some point with a macro bottom around 54$.

Bearish coin Coin has finally failed the momentum trend line after years of riding it on the weekly chart. I look to 115$ ish as a macro bottom for the stock, Bitcoin is likely to follow.

kvmev - GBPUSD entryPrice has been on a strong downtrend since retesting mid/late-2025 highs. Entering a 1:1.5 RR short position as price has broken below the previous support zone and is currently retesting and rejecting it as resistance.
Clean break and retest structure.
Looking to secure full or partial profits at 1.32542 depending on how candles close around that price point.
___
Disclaimer: The content shared is for educational and informational purposes only and does not constitute financial, investment, or trading advice. I am not a licensed financial advisor. Any actions you take based on this content are done at your own risk. Past performance is not indicative of future results.

Gold Ready for a Big Move – ABC Reversal in PlayOn the daily timeframe, Gold is developing a clear ABC corrective structure, indicating a potential long-term continuation of the broader bullish trend. After forming a strong impulsive move into wave (A), price experienced a deep correction into the 4,300–4,370 support zone, marking wave (B), where strong buying pressure has already been observed.
This support area is acting as a key institutional demand zone, suggesting that the market is preparing for the next expansion phase. If this structure holds, Gold is likely entering wave (C), which typically carries strong bullish momentum and can lead to a retest — or even a breakout — of previous highs.
The major level to watch on the upside remains the 5,050–5,100 resistance zone. A decisive daily close above this region would confirm bullish continuation and open the path for further upside in the long term.
As long as price respects the support zone, the overall bias remains bullish, and pullbacks can be considered as strategic buying opportunities. However, a sustained breakdown below this level would weaken the structure and shift momentum toward the downside.
Key Outlook:
Gold remains structurally bullish on the daily timeframe, with a high probability of continuation if support holds and resistance is broken.

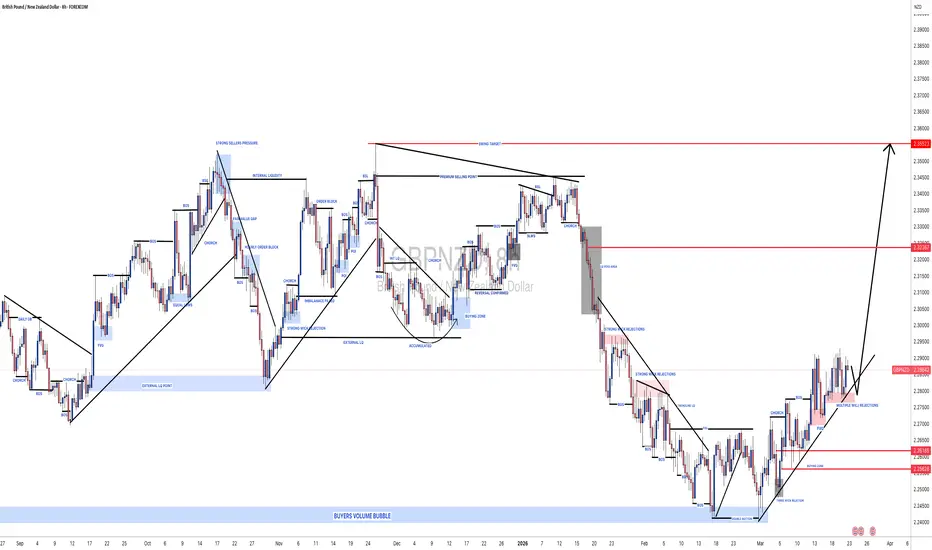
#GBPNZD: Two Targets, Once Strong Bullish Entry! ✴️ The GBP/NZD pair demonstrated a favourable reversal upon reaching our designated buying zone at 2.256, currently trading at 2.287. This indicates potential for continued upward momentum. We anticipate the price may advance towards the 2.32 level where a liquidity void is expected to be addressed. The British Pound is projected to maintain its strength against the New Zealand Dollar with expectations of a robust bullish continuation extending to 2.35.
✴️ Our strategic targets are established at 2.32 for the initial objective and 2.35 for the secondary objective. The successful execution of these trades is contingent upon strong fundamental support. We recommend closely monitoring price action on Monday to inform subsequent trading decisions. Adherence to stringent risk management protocols is advised.
We wish you successful and secure trading.
Sincerely,
Team Setupsfx 🧠❤️
kvmev / GBPJPY outlookPrice has been in a strong uptrend on the higher time frame.
There is also clean break and retests being formed as well as the ascending trendline is being respected.
Will look to enter a 1:1 RR long position if price is able to pull back, retest & respect the support zone/trendline around 212.000
Note - Price is also retesting the highs from 2008, no entry until confirmation is clear.
___
Disclaimer: The content shared is for educational and informational purposes only and does not constitute financial, investment, or trading advice. I am not a licensed financial advisor. Any actions you take based on this content are done at your own risk. Past performance is not indicative of future results.

Weekly Bias — 30 MarchThe market is leaning into a “vol trap” — everyone is buying puts, making them expensive
Short into failed bounces when QQQ rallies & oil holds strong + call credit spreads (on bounce)
Sell into $580–$585 area April expiration (captures the high IV rank while keeping the cap above the $577 resistance — 81% historical win rate)
Trapped longs unwind into major supply
Momentum + macro both against upside
Avoid chasing puts after big red days → wait for bounce into resistance
Most traders will chase downside too late or buy dips too early
Forward curves suggest the market is betting this is a “front-month panic” rather than a multi-year regime shift
WTI futures are in deep backwardation → May 2026 contract is at $93, the December 2026 contract is priced at $77
The market expects the supply shock to be temporary
QQQ is hitting new lows, but RSI is starting to bottom out near 30
We’re seeing a bear trap setup where the selling may have overextended
The market is leaning heavily into puts (high put IV)
With the expected move for next week being unusually wide (±$17, or roughly ~3%), the edge lies in credit spreads to capture the massive IV crush that will occur if a ceasefire is announced

oil war premium : accumulation before expansion“Oil War Premium: Why Bulls Are Targeting $115+ Next”
The chartis clean, structured and tells a clear story of accumulation before expansion. Price is currently reclaiming the $100–101 demand/flip zone, with bullish continuation potential driven by both technical compression and explosive geopolitical catalysts.
Technical Breakdown (4H – WTI)
Key Resistance Reclaim: ~$101
Immediate Demand Zone: $95–96
Higher Low Structure: Intact since mid-March
Liquidity Target: Above $115+
This is a classic range-to-expansion setup:
Previous distribution → breakdown → re-accumulation
Price now pushing into range highs with momentum
👉 The blue zone (~101) is now acting as a pivot flip
👉 The red box = invalidity (below $95)
👉 The green projection = imbalance fill toward 115+
Bias: Bullish continuation
Entry Zone: 100 – 101 (retest / breakout hold)
Stop Loss: Below 95
Targets:
TP1: 107.50 (range high liquidity)
TP2: 112.00 (macro resistance)
TP3: 115.00+ (war premium extension)
⚠️ What Could Invalidate This Setup
Clean break below $95 demand
Sudden ceasefire or de-escalation headlines
Emergency supply flooding markets (unlikely short-term)
This is not just a technical breakout, it’s a geopolitical premium trade.
Markets are no longer pricing oil purely on supply/demand, they are pricing uncertainty, disruption, and risk.
The best trades happen when:
Structure aligns with narrative
Liquidity aligns with fear
Right now, oil has both.
Watch the $101 hold, that’s your trigger.
put together by : Pako Phutietsile as @currencynerd

do we get a liquidity sweep?seems like a liquidity sweep event is upon us in the next few hours or days then we go check above 85k

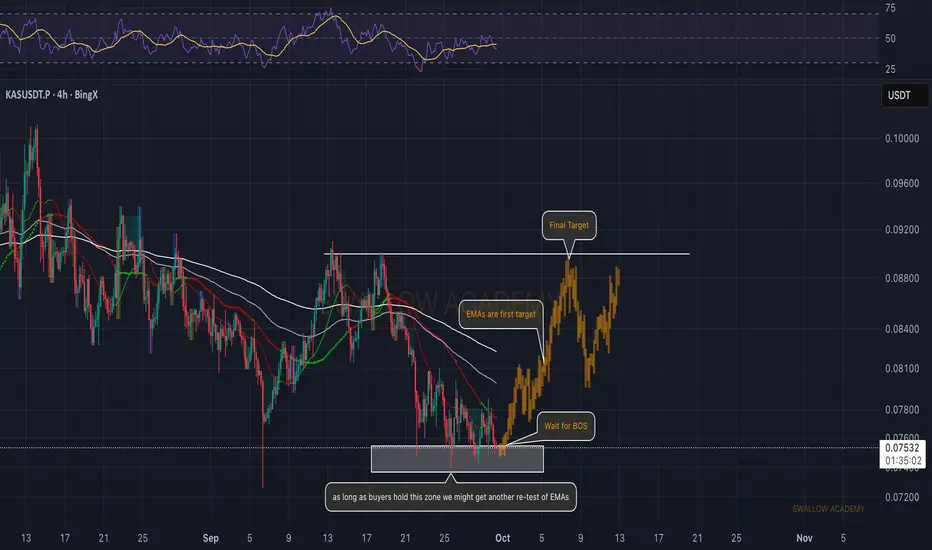
Kaspa (KAS): Expecting Bounce From Current Support ZoneKAS is holding its current support zone well, giving buyers a chance to defend structure. As long as this area doesn’t break, we could see another push into the EMAs, which stand as the first target. From there, a successful break of structure will be the key step for continuation toward higher levels, with the final target sitting at $0.092.
Swallow Academy
Gold at 4583, Is This a Reversal or a Liquidity TrapPrice is holding just below a key supply zone. Liquidity is stacking above, but reactions are becoming sharper.
Geopolitical tension remains elevated, keeping underlying demand for gold supported, but not impulsive.
At the same time, upcoming Fed communication is creating hesitation as positioning feels balanced rather than committed.
Current Observation (H1)
Price formed a short-term bullish structure with a clear BOS and respect for the rising channel.
Momentum is pushing back into highs, approaching the 4583 area where prior supply sits.
The reaction from 4440 held well, confirming demand is still responsive for now.
Trade Areas in Focus
🟥 Sell Liquidity Area
Entry 4583 – 4585
Invalidation 4593
This is a clear premium zone aligned with previous highs, where liquidity is likely resting.
A push into this area could attract sellers, especially if price shows hesitation or weak continuation.
🟩 Buy Liquidity Area
Entry 4440 – 4438
Invalidation 4430
This remains a strong demand zone from the recent reaction.
Buyers already stepped in once, so another revisit could offer continuation, though a sweep below is still possible.
Acceptance above 4585 suggests continuation and potential expansion higher.
Failure to hold above mid-range opens the door for a deeper pullback into demand.
Traders are watching reactions at extremes rather than chasing, especially with Fed speak ahead.
Closing Observation
Price is pressing into key liquidity while macro tension builds.
Does it react from premium, or continue squeezing higher first?

OIL - Major Volatility AheadPrepare for another massive week of volatility in OIL. Here is a full breakdown of everything you need to know and what to expect based on the current chart structure.
The Chart Setup
I have the 12H chart pulled up, as it has provided the most precise confluence with price action over the past few weeks.
It all started with establishing the key $101 level, marked by the 12H candle that closed after OIL reached its high of $119.48. Since then, price has repeatedly found local highs around this level. This is also exactly where Friday's candle closed, and where price currently sits.
This $101 level has established the top of what now appears to be a clear ascending triangle pattern (multiple touchpoints at a flat resistance line at $101 and multiple touchpoints of ascending support along the lower white trendline). It is also worth noting that I have a range from $101 to $103, as the $103 level represents the 0.618 of the micro trend. No breakout from the ascending triangle is confirmed until price closes above the 0.618 level as well.
The Fractal Pattern
Here is where things get really interesting. Since the last major oil crisis target of $120 was reached, OIL has been developing a remarkably clear fractal pattern in both price and time.
I have drawn two vertical yellow lines on the chart at multiple points, each pair representing Sunday's open candle to Monday's close candle.
The pattern is striking. On Sunday, OIL opens during Asia's trading session and appears to rally, only to close at or below the $101 level. Then Monday arrives and a significant breakdown follows. This has now occurred for three consecutive weeks, each time triggered by some form of headline during the Monday session.
OIL is now sitting at the exact same level for this fractal to repeat. Price appears set to open higher based on weekend developments and the key question is whether we will see another Monday breakdown to repeat the pattern for a fourth time.
This time, however, I believe the breakout will occur and here is why.
Why This Time Is Different
First, refer back to this post:
Last week Oil was at an almost identical decision point, watching for a breakout or breakdown.
Just as the fractal suggested, the rejection at $98 and the bull flag rejection led to a breakdown. But the current setup has several key differences.
OIL just closed its highest daily candle above $100 since July 2022. That is a significant milestone that should not be overlooked.
RSI levels across multiple timeframes are approaching overbought conditions simultaneously which could either accelerate price appreciation (overbought strength) or mark local tops upon rejection on Monday. The key levels to watch are the 4H RSI (69.02), the daily RSI (67.25), and most importantly the monthly RSI (69.23).
Here is my theory on the monthly RSI: I believe it will close lower at the April print. This does not mean OIL cannot skyrocket during the month of April if a resolution is not reached this week, but it does suggest that at some point in April, the top for OIL will be established. By the end of April, the monthly RSI will likely have rejected near overbought conditions and begun its cooldown phase toward more reasonable price levels.
The bull flag trendlines have also been reclaimed and breached. However, that pattern already played out as outlined in this post:
But it is worth noting that price is now trading back above those trendlines, adding to the bullish case.
The Targets
Given everything outlined above, OIL appears to be back in position for a massive breakout toward the $120 level and potentially as high as the oil crisis target of $145–$154 outlined in my original post, if conditions deteriorate further.
The pivotal question heading into this week is whether the Trump administration will use the same playbook they have employed for the past three weeks to suppress oil prices ("breakdown") or whether they will let this move run until forced to intervene at those higher levels.
Monday's price action should tell us everything.

ASCM: Testing the "Line in the Sand"!ASCM: Testing the "Line in the Sand"! 🏗️📉
After a challenging period, ASCM is showing strong signs of a fundamental recovery, transitioning from "Value Trap" to "Growth Play." 📈
The Swing to Profit:
After losses in 2024, the company reported a consolidated net profit of EGP 373.2M for the 9 months ending September 2025 a massive jump compared to last year. 💰✅
Asset Play: Even with the recent rally, the stock trades at a Price-to-Book (P/B) of ~0.87x, offering a discount on its industrial assets and mining equipment. 💎
The Valuation Gap: At a current price around 41.75 EGP, the stock is trading well below the conservative Fair Value estimate of 49.50 EGP. 📏🎯
Sharia Status: ✅ Compliant. As a key member of the EGX33 Shariah Index, it meets the strict activity and financial ratio filters required for Islamic investment. ☪️📜
The Risk: High debt-to-equity (186%) remains the primary concern, keeping the stock sensitive to interest rate fluctuations. ⚠️🏦
While the fundamental turnaround is impressive, the technical chart is telling a story of caution📊
The Bearish Channel: Since hitting its 52-week high in October, the stock has been locked in a persistent downward channel. 📉
Critical Support: We are currently hovering right at the 200-day Moving Average (200 MA) at 41.11.
If this "floor" breaks, the correction could accelerate. 🛡️⚠️
The Resistance Wall: No real "positivity" is expected until we see a decisive break and close above the 46.50 resistance. 🧱
Strategy for "Holders": If you are stuck at higher prices, don't panic-sell at the 200 MA. Wait for a technical rebound toward the upper boundary of the channel to exit or reduce your position. 🧘♂️🏹
The stock is "Guilty until proven Innocent" respect the trend and wait for the 46.50 breakout! 👀🔥
If you like my posts, please follow and boost 🙌

Bearish reversal off pullback resistance?GBP/NZD has rejected off the resistance level, which is a pullback resistance and could potentially drop from this level to our take profit.
Entry: 2.3111
Why we like it:
There is a pullback resistance level.
Stop loss: 2.3280
Why we like it:
There is a pullback resistance level.
Take profit: 2.2889
Why we like it:
There is an overlap support level.
Enjoying your TradingView experience? Review us!
Please be advised that the information presented on TradingView is provided to Vantage (‘Vantage Global Limited’, ‘we’) by a third-party provider (‘Everest Fortune Group’). Please be reminded that you are solely responsible for the trading decisions on your account. There is a very high degree of risk involved in trading. Any information and/or content is intended entirely for research, educational and informational purposes only and does not constitute investment or consultation advice or investment strategy. The information is not tailored to the investment needs of any specific person and therefore does not involve a consideration of any of the investment objectives, financial situation or needs of any viewer that may receive it. Kindly also note that past performance is not a reliable indicator of future results. Actual results may differ materially from those anticipated in forward-looking or past performance statements. We assume no liability as to the accuracy or completeness of any of the information and/or content provided herein and the Company cannot be held responsible for any omission, mistake nor for any loss or damage including without limitation to any loss of profit which may arise from reliance on any information supplied by Everest Fortune Group.

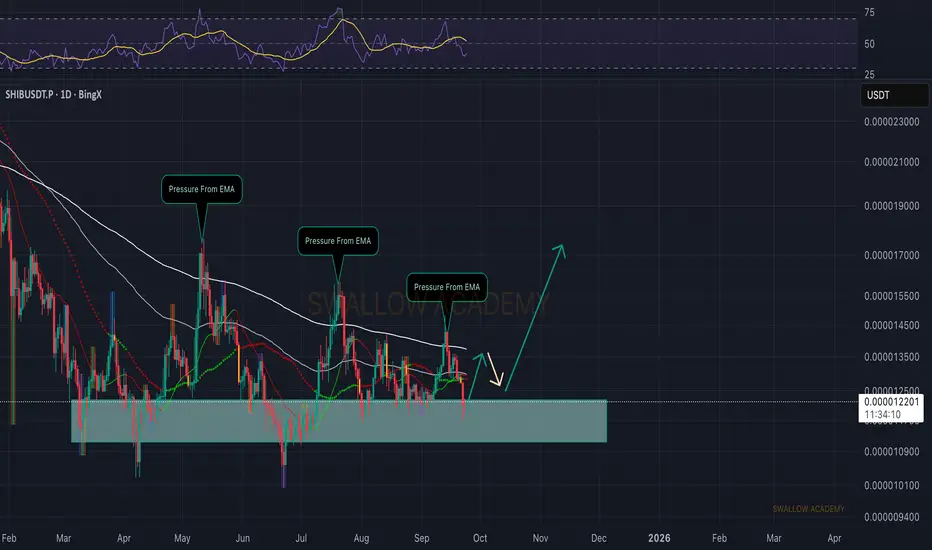
Shiba Inu (SHIB): Expecting For Breakout From EMAsSHIB is once again holding inside the support block, even after repeated pressure from the EMAs that keep pushing the price lower. What stands out is how buyers have defended this zone multiple times, leaving long wicks that show clear absorption of sell-side attempts.
The current compression between EMAs and support makes this zone critical—either buyers finally secure it for a bigger push up, or another liquidity sweep happens before continuation.
Swallow Academy
Bitcoin—BTCUSDT 25X—Long trade-numbers with 2,058% potentialBitcoin dropped from a high of $76,000 to a low of $65,550, a strong retrace by any standard. The low level is a perfect support from 8-March, double-bottom and also intermediate higher low.
You know the old axiom: Sell at resistance, buy at support.
Bitcoin is now trading at support.
I am not saying that this is a 100% successful trade. I am only showing a chart that allows for risk to be taken with a high probability of success. Not 100% certainty, but the probabilities should go in your favor. The market will support you if you make the decision of being courageous when others are fearful. And there is also the signal from the RSI.
The 4H RSI hit the lowest level since 6-February producing oversold conditions. When this happens, a reversal becomes very close. The STOCH also supports a rising wave starting in the coming days.
Full trade-numbers below:
_____
LONG BTCUSDT
Leverage: 25X
Potential: 2058%
Allocation: 5%
Entry zone: $63,900 - $67,000
Targets:
0) $70,800
1) $74,565
2) $79,023
3) $83,481
4) $89,828
5) $97,913
6) $106,829
7) $112,345
8) $121,261
Stop: Close weekly below $63,000
_____
Thank you for reading, your continued support is highly appreciated.
If you enjoy the content, make sure to follow. New charts daily for Bitcoin and the altcoins, also stocks.
Namaste.

US 10Y TREASURY: Signaling rising risksLong term Treasury yields are not sending a good signal with respect to the US economy at this moment. The 10Y Treasury yields climbed toward 4.48% on Friday, driven by rising inflation expectations amid surging oil prices and escalating geopolitical tensions. Markets are also repricing the Federal Reserve path toward higher-for-longer rates, while weaker demand for Treasuries adds further upward pressure on yields. During the week there have also been a few notes from Federal Governors, noting a possibility for interest rates to be even increased if inflation starts its uptrend again. This is exactly what markets don't need to hear at this moment.
The current macro and geopolitical situation will continue to shape investors sentiment with its consequences on the US Treasury markets. Friday also brings March NFP and Unemployment data, which promise to be another volatile day. Some just a short relaxation in 10Y yields is possible at the start of the week, however, nothing significant should be expected at this moment. On the opposite side, based on charts, there is a possibility of testing the 4,5% level. Higher levels are also possible, which will depend on further developments with the price of oil and Middle East conflict.

kvmev / EURCAD outlookPrice is currently retesting the highs from 2015, 2018 & 2020, may be a HTF break and retest despite price closing below the ascending trendline on the LTF.
Will look to enter a 1:2 RR long position if price is able to pull back, retest & respect the support zone around 1.59350
Note - High risk entry, will only enter a long position if confirmation is strong.
___
Disclaimer: The content shared is for educational and informational purposes only and does not constitute financial, investment, or trading advice. I am not a licensed financial advisor. Any actions you take based on this content are done at your own risk. Past performance is not indicative of future results.
