XDC | updated 4hr chartupdated chart. tested levels changed from dashed to single point dotted lines.
New levels added @ $0.026 which are the final levels support the low angle accumulation trend.
If price is a good entry at 0.026 then what would get price down to that zone?
There is are a few 4hr areas of resistance locally. A 4hr timeframe level will have an expected strength to break lower timeframe levels and contend with / possible breaking of a daily timeframe level.
the tested levels currently supporting price at $0.0310 is a tested 4hr so it can break. The tested weekly levels in grey below that could also break being tested already. There is no expectation of liquidity at those area's since they are already tested and not candidates for trends to originate from them. We can look for Inv.BS candles to form and create an origin level for an accumulation trend to be created.
We can also look for BS levels to be tested 2x to become origin levels for distribution trends to be created and push price down to the final levels of supports.
- T.A explained -
Range = two or more consecutive color candles.
DISTRIBUTION RANGES DEFINED: BackSide (BS) Candle - First distribution candle in a distribution range. Expectation = strong reaction to price. long wicks reaching to or away from level.
FrontSide (FS) Candle - Last distribution candle in a distribution range. Expectation = reversal, create a trend in the opposite direction. Distribution candles are used as support.
ACCUMULATION RANGES DEFINED:
Inverse BS (Inv.BS) - First Accumulation candle in an accumulation range. Expectation. = strong reaction to price. long wicks reaching to or away from level.
Inverse FS (Inv.FS) - Last accumulation candle in an accumulation range. Expectation = reversal, create a trend in the opposite direction. Accumulation candles are used as resistance.
Horizontal Ray tool on BS & FS levels are default support levels when dashed lines, tested when dotted lines and resistance when solid lines.
Horizontal Ray tool on Inverse BS & Inverse FS levels default as resistance and shown with a dashed line, tested when 1x dotted line, and support when solid line.
The inverse is true for the Inv. BS Inv. FS levels, they are resistance as dashed lines, tested as dotted and support as solid lines.
Monthly timeframe is color pink
weekly grey
daily is red
4hr is orange
1hr is yellow
15min is blue
5min is green if they are shown.
strength favors the higher timeframe.
Community ideas

USAR: Started To Look Good Again.Eyes on USAR ladies and gentlemen the 1hr TF started to look good again and knowing that the Daily still has like 3 or 4 more sessions of berish TIME and a first supply zone at $14 - $15 we can start building a position for the next bounce so what's the R/R for the 1hr TF? it at least 1:1 and if bounce is strong enough and moves to the 4hrs TF then R/R will be 1:3
Place your bets ladies and gentlemen. The plan is to buy at each supply zone or wait until it gets to the 2nd supply zone and buy the whole order at once.
Remember as of now this is a trade based on the 1hr TF and will last from 24 to 36 candles depending of volatility.
By Tuesday March 31 we should have a clearer picture so stay tuned.
Play it right..............Play it safe.................Play it The Numberfive Way.
Boost........................Follow...................Comment.

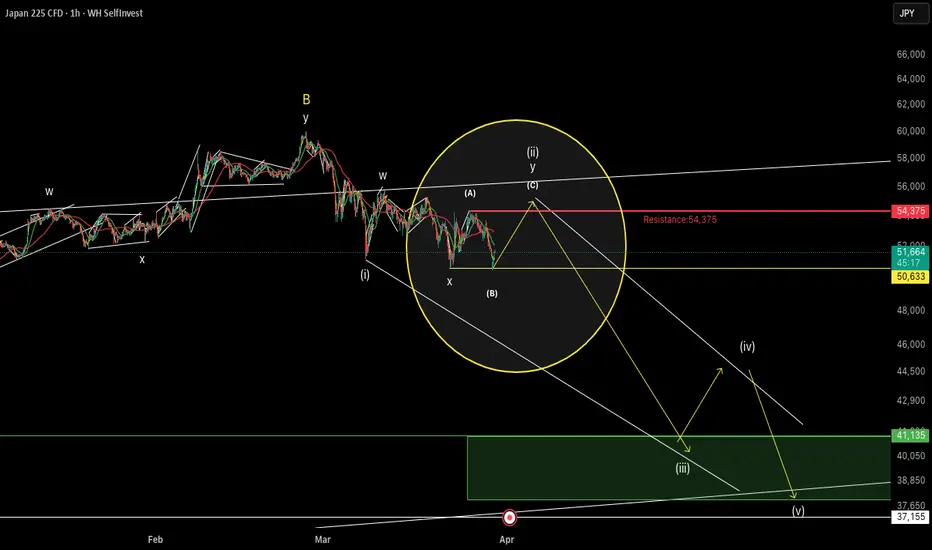
Nikkei 225 Count Update – Bullish in Flat (C) of Wave 2Nikkei225 Count Update
Touched the invalidation level at 50,633 → temporarily shifted to neutral.
However, converted to long-only in the 50,800 zone.
Now viewing the large downward impulse wave 2 as forming a double three (zigzag + flat), with the flat’s (C) currently in progress.
Bias & Position
Bullish
Main Target
54,375
Invalidation
Break below 50,467 (3/30 low) invalidates the flat (C).
(Downside alert starts at 50,619)
#Nikkei225 #JAPAN225CFD #ElliottWave
JUFO is still in a downtrend.JUFO is still in a downtrend.
I would prefer to see another touch of the trendline around the 25 level before a potential rebound.
The first sign of positivity would be a break above the Fibonacci 38.2% level at 27.66, which could indicate a possible shift in momentum. 📉➡️📈
⚠️ Due to the current market volatility, I don’t recommend entering at this stage.
👉 If you like my analysis, please follow and boost 🚀📊

Sell gbpusdStrong sell
Bearish correction continue more 500 pips
Clear clean analysis shows broken daily support trend and retested successful

XAU/USD Weekly Outlook | Levels to Watch | NFP WeekWe saw a strong push higher on Friday, with price reclaiming the MA50, shifting short-term momentum and opening the potential for a move toward the MA200.
Immediate resistance sits at 4529, aligning with the channel midline. A confirmed break above this level would open the path toward 4607 as the next target, while key resistance remains at the 4700 level.
On the downside, immediate support is seen at 4426, in line with the channel bottom. A break below this level would signal weakness and open the door for further downside into lower support zones, including a potential retest of the lows.
📌Key levels to watch:
Resistance:
4529
4607
Support:
4426
4352
4263
4169
4049
👉 Let key levels guide your decision — wait for confirmation.

Dollars falls/USD/CHF sellingthis is my first video of me recording how I trade in the market.wish me luck and let me know if you want more videos. Good Luck Traders.

Today's Gold Analysis and Strategy
International gold is in a strong corrective pattern after an oversold decline, currently range-bound between $4400 and $4550. The long-short game centers on three main drivers: Fed rate-cut expectations, geopolitical risks in the Middle East, and continuous gold purchases by central banks. Technically, the price has stabilized but faces heavy resistance to the upside.
Trading Strategy
In the short term, gold is undergoing an oversold rebound combined with bottom-building. $4400 serves as the key long-short level, while $4550 acts as the strength-weakness threshold. The trading approach prioritizes long positions on dips with strict position control.
Entry: Go long on stabilization around $4450–$4480
Stop Loss: $4440
Take Profit: 1st target $4510–$4550

USDJPY — Extended Uptrend Testing Multi-Year HighUSDJPY has been trending higher for approximately one month and is now testing a previous swing-high area, marking the highest price level seen in roughly two years.
At this stage, we are beginning to observe technical conditions that could support a potential exhaustion phase if confirmation continues to develop.
Current technical observations:
• Daily momentum is turning lower and showing signs of divergence
• 4-hour momentum is also divergent, suggesting weakening trend strength
• Price action is forming a possible double-top structure at a major resistance level
• Multiple engulfing candles have appeared, indicating rejection pressure
• Volume participation is present across execution timeframes
– 4H volume around 82
– 1H volume around 87
– 15M volume around 90
After an extended directional move, markets often transition into corrective or reversal phases once momentum and structure begin to shift.
We are monitoring this market closely for continued confirmation and potential rule-based opportunities if full alignment develops.
⚠️ Educational market analysis only — not financial advice.
Preparation and patience remain essential.

GOLD NEW ANALYSIS (READ CAPTION) Market Structure Breakdown – Bearish Rejection at Resistance
Price has rallied into a strong resistance confluence zone (4,530 – 4,598) after forming a higher low and short-term ascending structure. However, momentum is weakening as price struggles to break and hold above this supply area.
🔑 Key Levels
Resistance 1: 4,530
Resistance 2: 4,598 (major supply zone)
Support: 4,444
Target Zone: 4,361 – 4,356
🧠 Trade Idea
The chart suggests a potential distribution phase at resistance:
Repeated rejection wicks indicate seller presence
Structure hints at a lower high formation
A break below 4,444 support would confirm bearish continuation
📊 Bearish Scenario
If price fails to reclaim 4,530 and breaks down:
➡️ Expect a move toward 4,361 (primary target)
➡️ Possible extension toward 4,270 if momentum accelerates
The projected path (black arrows) shows a step-down structure—lower highs leading into breakdown.
⚠️ Invalidation
A strong breakout and close above 4,598 would invalidate the bearish bias
That would likely trigger continuation to the upside
💡 Summary
This is a classic resistance rejection setup with a high probability of downside if support breaks. Watch for confirmation before entry—patience is key here.

#Bitcoin is about to Crash ?✅Triangle has broken through the support line.
📊Possible bearish price movement forecast for the next 5 days towards 63,200

BTC bitcoin price analysisCRYPTOCAP:BTC moving according to the scenario?
Maybe it sounds a bit bold, but it feels like CRYPTOCAP:BTC has been moving pretty close to what we’ve been outlining in recent weeks.
For now, the idea stays the same:
📈 In the coming days, we expect OKX:BTCUSDT to move toward $70K+ and then we reassess.
We’ll keep watching and adapting along the way.
📊 Market metrics:
🔻 Fear & Greed Index: 8 (Extreme Fear) → potential for a bounce
📉 Liquidations (24h): ~$400M but the key shift:
🔹 70% longs 🔹 30% shorts
⚠️ Important:
When the market is heavily shorted and price stops falling → it often leads to short squeeze
📈 which means aggressive market buying
But don’t forget:
📉 We are still in a downtrend
Stay sharp, stay flexible — this is not a “to the moon” phase yet
______________
◆ Follow us ❤️ for daily crypto insights & updates!
🚀 Don’t miss out on important market moves
🧠 DYOR | This is not financial advice, just thinking out loud

Solana (SOL) TD Indicator Flashes "Buy" – Is a Bounce Next?* TD Sequential flashes buy signal on Solana's 4-hour chart, indicating a potential rebound
* SOL price sits oversold at $85 with RSI at 34, while on-chain data shows network activity holding steady
* Risk-reward favours bounce with defined downside at $84 and upside targets at $89, $95, and $100
When you step back for a second and look at what Solana's doing, honestly, it feels like it's reaching a point where something has to give.
After weeks of just slowly bleeding lower, sliding from $110 all the way down to the $85 zone, SOL finally looks like it might be running out of steam on the downside. It's been the kind of quiet grind that doesn't make headlines but just slowly wears on you. Every time it looks like a bounce might happen, sellers step back in.
But here's the interesting part, Ali Charts just pointed out that the TD Sequential indicator flashed a buy signal on the 4-hour chart. Now, I know indicators aren't magic. But this one has a track record. The last time it flashed a buy on this timeframe, SOL bounced from $80 to $100 in weeks.
Look a little closer, and other things line up too.
Zoom out to the daily chart, and the RSI is sitting at 43.87. That's not screaming oversold, but here's the thing, it's neutral with room to run. The 100-day SMA is way up at $106, which tells you we're still in a bearish structure, but the daily RSI has been trending lower for weeks and might be bottoming out. That's often when momentum starts to shift.
That's the kind of quiet strength that tends to catch up with price eventually.
The next test is $89. Clear that, and $93 to $95 starts looking real, then the $100 zone. Lose $84, and we're back talking about $80. But the setup is there, and the risk-reward actually looks pretty solid for once.

NZDUSD BUY Entry @ 0.57407
SL@0.57003
TP: open
Based on current jobs and employment data, along with smart money positioning, the New Zealand dollar (NZD) appears to be showing bullish strength against the U.S. dollar (USD).
Based on these factors, I expect NZD/USD to maintain a bullish bias in the coming days.

BTC PERPETUAL TRADE BUY SETUP Long from $68'500BTC PERPETUAL TRADE
BUY SETUP
Long from $68'500
Currently $68'500
Targeting $69500 or Above
(Trading plan IF BTC
go down to $67300 will add more longs)
Follow the notes for updates
In the event of an early exit,
this analysis will be updated.
Its not a Financial advice

Infinex (INX): The start of a new uptrend? (PP: 120%)Here we have a new project, INXUSDT (Infinex), and it looks like it is about to move. These projects can develop an uptrend early on and go at it for months. After a major top, a sudden crash follows as we've seen multiple times.
Here the signals are very strong supporting a bullish breakout. Any confirmed break of resistance near the upper-trendline of the sideways channel or a price 0.01400 can start an uptrend. The sideways period has been active for more than a month.
The bullish signal comes from the volume indicator. Volume has been rising steadily since 22-March and now it is pretty high. With the last active candle producing the highest volume ever.
Looks interesting. Can be a good choice in these quiet days.
What is Infinex (INX)?
Infinex is a decentralized perpetuals exchange created by the founder of Synthetix, Kain Warwick, aimed at providing a user experience similar to centralized exchanges. Unlike traditional DeFi platforms, Infinex allows users to create an account with a username and password, storing private keys in the browser without the ability to withdraw deposited funds, enhancing security and ease of use. The platform leverages Synthetix's derivatives and stablecoins, such as sUSD, for trading, while collecting fees from trading, integration, and staking SNX tokens. Infinex is designed to attract existing crypto traders from centralized exchanges by offering a familiar and efficient trading experience within a decentralized framework. Additionally, the platform is built with open-source components to minimize regulatory risks and will be governed by the Synthetix (SNX) token.
Thank you for reading.
Namaste.

Lilly - Continuing LowerLet’s return to NYSE:LLY
The targets from the previous idea have been reached:
It appears that a strong downside impulse is forming, so let’s define the new targets.
Key targets:
811
688
611
Potential move from current levels: ~7–30%
A pause or temporary bounce is possible upon reaching the first target.
---
Liked the idea? Hit Boost 🚀
Disagree? Share your targets in the comments.
---

$ZRO and $STG FractalBINANCE:ZROUSDT is showing a similar structure to BINANCE:STGUSDT before its recent expansion with a double rounded bottom followed by a higher low and reclaim of the moving averages.
After reclaiming the mid moving averages, price is now pressing against the range highs, which is the same phase where STG broke out before its impulse move.
If ZRO can hold the $1.80 area, the next levels to watch are $2.60 as the first resistance and $3 to $3.30 as the potential expansion area.
Invalidation would be losing the $1.80-1.75, which likely sends price back into the $1.60 to $1.50 range.
Not a guarantee, but the structure closely mirrors the STG fractal before its expansion.

US30 Massive Long!
HI,Traders !
#US30 has also fallen
Down by a lot last week
And we think that the
Initial panic move is over
So as is oversold
And is about to retest a
Horizontal support of 44918.5
A strong bullish correction
Is to be expected on Monday !
Comment and subscribe to help us grow !

XAUUSD H1: Liquidity Swept Away – Smart Money Moves NextXAUUSD H1: Liquidity Swept Away – Smart Money Moves Next
Gold executed a classic smart money move on the hourly timeframe: clearing the lows, taking stop-losses, and reversing sharply. The price is now consolidating, forming an accumulation zone. We'll examine where major players have been accumulating positions, which levels are currently key for entry, and where the market is likely to move after breaking out of the range. The approach is clear for both beginners (clear levels) and professionals (structure, liquidity, order blocks).
Gold is in the accumulation phase on H1 after clearing liquidity and changing structure. Major players have already built positions in demand zones ($4,530–4,560). The optimal strategy is to buy from demand zones with confirmation and sell from supply zones when bearish signals appear.
Control levels:
Key support: $4,530–4,560 (Demand)
Key resistance: $4,660–4,690 (Supply)
Until these boundaries are broken, further consolidation is likely. A breakout with sufficient volume and consolidation will indicate the direction of the next trend movement.

USDCHF | Gains as Fed Holds Firm, SNB Stays at ZeroFundamental approach:
- The US dollar-swiss franc posted a net gain this week, supported by broad US dollar strength amid the Fed's 'hawkish hold', keeping rates in the 3.50%–3.75% range, while the Swiss franc faced headwinds as the SNB also held its policy rate unchanged at 0%.
- The pair climbed through mid-week as the Fed signaled no urgency to cut rates, underpinned by resilient US labor data and sticky core inflation.
- The SNB's decision to hold, as universally anticipated, offered little surprise to markets; however, investors focused on Chairman Martin Schlegel's press conference for signals on FX intervention rhetoric, given the SNB's growing willingness to cap CHF appreciation to avoid deflationary risks.
Technical approach:
- USDCHF saw larger swings after bottoming out around 0.7640. The price is above both EMAs, indicating an upward shift.
- If USDCHF remains above 0.7840, the price may rise to retest the resistance at 0.8100.
- On the contrary, breaking below 0.7840 may prompt a further correction toward the following support at 0.7640.
Analysis by: Dat Tong, Senior Financial Markets Strategist at Exness

EurUsd more downside in Near TermHello Traders, Price action suggest more downside and a retest of the monthly support level 1.142-3. We come back for a retest to 1.152 or 1.154 4Hr Zones, but we already did on Friday March 27th. We may also drop straight into the abyss , first sell target 1.1484 Structural liquidty price and then 1.145 Daily support level. For us to psuh past the monthly level 1.142, there will need to be continued Iran Escalation. EUR is being hit hard recently because it's a currency that enjoys certainty. The Iran conflict defintely is not very encouraging in that regard.

Next Volatility Period: Around April 22
Hello?
Nice to meet you, fellow traders.
If you "follow" me, you can always get new information quickly.
Have a great day.
------------------------------------
(BTCUSDT 1D Chart)
From a chart analysis perspective, the important range is between 69000.0 and 73909.36.
This is because if it falls below this level, there is a high probability that it will show a downtrend in the mid-to-long term.
Therefore, from a chart analysis perspective, I believe it is appropriate to explain countermeasures for a mid-to-long-term downtrend.
However, from a trading perspective, the most critical range is the 57,694.27 to 61,299.80 range.
This is because a drop below this level would mean falling below the previous high point; thus, this is a zone that must be supported to sustain an uptrend in the mid-to-long term.
Currently, the HA-Low indicator point on the 1W chart is formed at 71,058.26, and the HA-Low indicator on the 1D chart is formed at 67,720.67.
The formation of the HA-Low indicator signifies that a low point zone has been established.
Therefore, if it shows signs of being supported near the HA-Low indicator, it is a buying opportunity.
If this fails and the price falls, there is a possibility of a stepwise decline, so you must consider countermeasures.
Since the end of a stepwise decline is an uptrend, you must ultimately consider how to proceed with buying.
- (1W Chart)
Looking at the 1W chart, you can understand why the creation of the HA-Low indicator on the 1W chart is important.
While there is no guarantee that past movements will appear similarly in the present, this is because if the price maintains the range of 57,694.27 to 61,299.80 mentioned in the 1D chart, or above that level, it is expected to show an upward trend.
- (1M Chart)
You can identify the previous high point by looking at the 1M chart.
----------------------------------
Therefore,
from a mid-to-long-term perspective, the buying timing corresponds to the area between 57,694.27 and 61,299.80,
and from a short-to-medium-term perspective, the buying timing corresponds to the area between 67,620.39 and 71,058.26.
Thus, you can proceed with the position currently in the buying phase.
However, since the price is located below the M-Signal indicator on the 1M chart, position sizing adjustments are necessary.
This is because a full-scale uptrend is highly likely to begin when the price maintains a level above the M-Signal indicator on the 1M chart.
Looking at the current price position at 75,719.90, this corresponds to the StochRSI 20 indicator point on the 1M chart.
Therefore, the likelihood of an upward trend is increasing as the price breaks above the 75,719.90 point.
Therefore, if the price rises when the StochRSI 20 indicator on the 1M chart maintains the 75,719.90 level and the M-Signal indicator passes near this point, that can be considered the final buying opportunity.
After passing through the volatility period around March 23, the price appears to be feigning an upward trend before falling.
The next volatility period is around April 22, but looking at the ETHUSDT chart, a volatility period exists around April 2.
Therefore, you should consider a response strategy assuming there is a possibility that a trend will form after April 2.
To sustain an uptrend after breaking out of a key point or zone, the StochRSI, BSSC, and OBV indicators must show an upward trend.
In particular,
1. It is preferable that the StochRSI indicator has not entered the overbought zone. 2. It is advisable for the BSSC indicator to remain above the 0 point.
3. It is advisable for the OBV indicator to remain above the High Line.
When the price breaks upward from any point or zone, you must verify whether the above conditions are satisfied and formulate a trading strategy accordingly.
- Thank you for reading to the end.
I wish you successful trading.
-------------------------------------------------
(The coin market is expected to start its uptrend in July)
-
- This is an explanation of the big picture.
(3-year bull market, 1-year bear market pattern)
------------------------------------------------------
