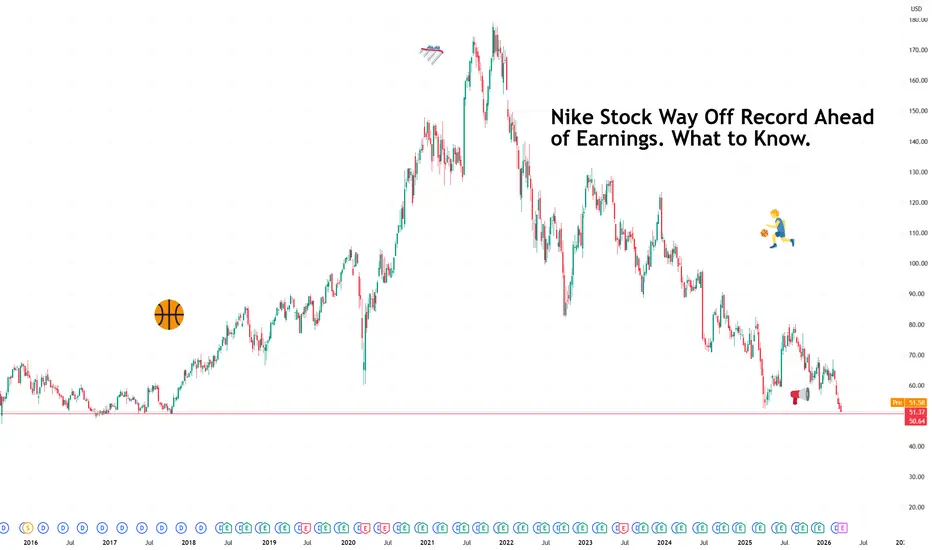
Nike Stock Way Off Record Ahead of Earnings. What to Know.There is a particular kind of corporate humbling that comes not from collapse but from irrelevance creeping in at the edges.
Nike NYSE:NKE is still the world's largest sportswear brand, still moving tens of billions in revenue, still on the feet of more athletes than any other company on earth.
And yet at around $50 a share, nine-year lows, off 70% from its 2021 peak, the stock is asking a question the company has to answer on Tuesday: So how’s that reset going? (insert "well we’re waiting.gif")
The earnings calendar rolls on with Nike’s earnings day next .
📉 How Did We Get Here?
Nike's November 2021 high of $178 looks almost fictional from today's vantage point. The shares are lower by more than 20% this year alone and have spent the past several months hovering near levels last seen when athleisure was still a novelty.
The company is in the middle of what it calls a business reset , refocusing on wholesale partnerships after a years-long push toward selling direct to consumers that did not deliver the margins management had anticipated.
Wholesale means selling through retailers like Foot Locker rather than exclusively through Nike's own stores and app. The retreat is sensible but the execution has been choppy, and the market has been keeping score.
🌍 Three Problems, One Earnings Call
Investors heading into Tuesday's report are watching three specific pressure points.
Europe is slowing. Consumer confidence across the continent has softened, and discretionary spending, the kind that goes on premium trainers, tends to be the first casualty when household budgets tighten.
The US wholesale business, the very channel Nike is trying to reinvigorate, remains unhealthy. Rebuilding retailer relationships after deprioritizing them takes time, and the inventory and shelf-space dynamics are still normalizing. All the while profits are slumping .
Outside the tariff woes from a year ago , China continues to disappoint. The post-pandemic recovery that Nike and many other consumer brands were counting on has been more stubborn than anticipated, with local competitors gaining ground and consumer sentiment remaining soft.
The market is expecting revenue of roughly $11.1 billion for the quarter, flat year on year, an improvement on the 9.3% decline recorded in the same period last year.
Earnings per share, meaning profit divided across all outstanding shares, is expected to land at 29 cents. Last quarter Nike beat on both revenue and earnings, so the bar exists, even if it is not set particularly high.
👟 The Cool Factor Problem
Beyond the financials, Nike has a cultural challenge that balance sheets struggle to capture. The brand that defined athletic aspiration for four decades is working harder than usual to stay relevant.
Its answer, at least partly, is a sneaker called Mind, a shoe focused on mindfulness. Whether a mindfulness sneaker moves the needle on coolness is a question the market will eventually answer, but it is the kind of product that signals a company actively searching for its next identity.
🆕 New Balance Is Having a Moment
While Nike searches, New Balance is sprinting. The 120-year-old brand, once synonymous with sensible footwear for people who prioritize comfort over style, grew sales 19% last year and 180% since 2020.
It has raised average prices by roughly 30% over the past five years, proving consumers will pay a premium for a brand they believe in. It opened 80 new stores last year, aggressively rebuilding physical retail presence at the exact moment Nike was stepping back from it.
New Balance expects to cross $10 billion in sales this year, putting it roughly $2 billion behind Nike's quarterly revenue run rate. That gap is closing, and it is closing fast.
🎯 What to Watch Tuesday
The headline numbers are important, for sure, but the language around China and wholesale recovery will tell the more important story. So grab your two shares and listen for whether management sounds like a team executing a plan or a team revising one.
At $50, Nike is cheap relative to its own history. Cheap and done falling are different things, though.
Off to you : What’s your outlook for Nike? Share your views in the comments!
Community ideas
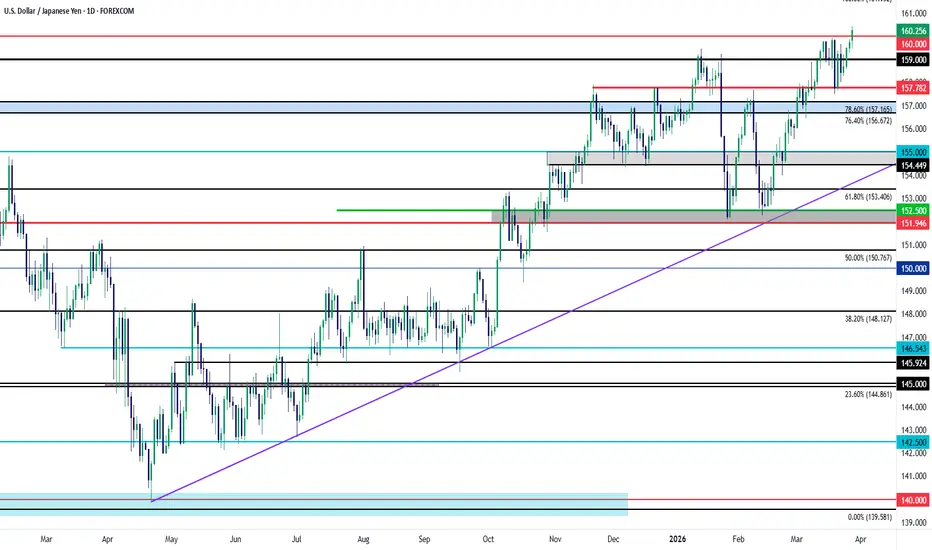
USD/JPY: The 160.00 TestFor the first time since July of 2024 USD/JPY has pushed above the 160.00 handle.
The move hit around 1am Tokyo time so we could still see a response from Japanese policymakers around the Sunday open, and interestingly, last week began with another threat of intervention that brought pullback to USD/JPY which was jumped on buy buyers that drove right back up to create the current fresh highs.
At this point chasing the move is still a challenge, especially given the dynamics around weekly closes and opens. But, price being above 160.00 isn't necessarily a death knell either as, like 2022, we may simply be seeing the BoJ move their line-in-the-sand a bit higher.
Overhead, it's the 161.95 level that stands out which is a clean 1,000 pips above the intervention-high in 2022 (which held in 2023, as well), while also being the swing-high from 2024.
Until the fundamental backdrop changes, it's difficult to imagine interventions having any long-lasting success so if we do see the BoJ forced into action, that pullback remains as opportunistic, like we saw in April of 2024. - js
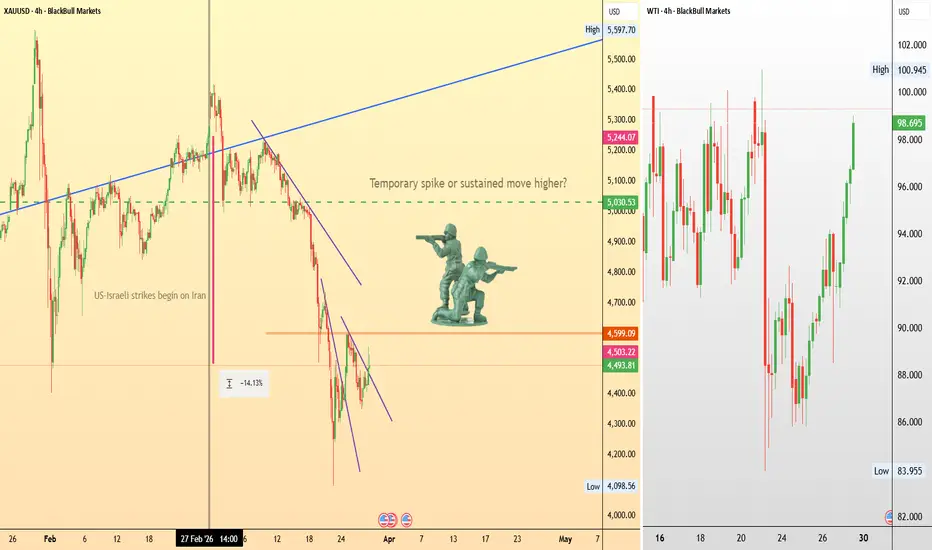
Will a ground invasion finally move gold?From a technical perspective, gold is currently in a clear short-term downtrend following the initial geopolitical spike. Gold appears to be waiting for a stronger catalyst.
Are ground troops what gold needs to start moving upward?
Iran has claimed it could mobilise more than 1 million troops to counter what it describes as a “suicidal” U.S. ground war on Iranian soil.
The United States has deployed approximately 5,000 Marines from bases in Japan and California, alongside 2,000 personnel from the elite 82nd Airborne Division. In addition, the USS Tripoli has just arrived carrying a further 3,500 troops.
Although, diplomatic efforts are apparently still active. Talks between the U.S. and Iran are expected to take place in Pakistan in the coming days.
The key level to watch is around $4,600, which is now acting as a potential resistance.
The key trading question around any ground troop invasion announcement is whether gold would deliver only a brief spike on the news or begin a more sustained move higher.
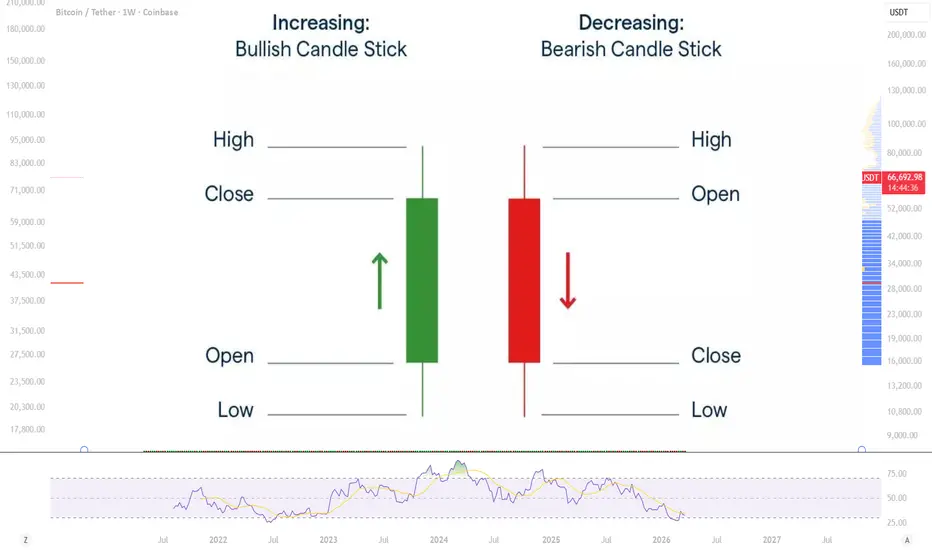
Candlestick Analysis — Complete Guide to Patterns📊 Candlesticks — the most popular way to read price action
The wide part of the candle is called the body.
It shows the price range between the open and close for a given period.
🟥 A red candle forms when the close is below the open
🟩 A green candle forms when the close is above the open
The thin lines above and below the body are called wicks (shadows)
They represent the highest and lowest prices during that session
Important: The higher the timeframe — the more reliable the candlestick pattern
📚 Spinning tops are candles with a small body that reflect a strong battle between buyers and sellers.
Typically, this pattern is considered neutral and often appears within a tight trading range.
Spinning tops can be both bullish (green) and bearish (red) .
💭 Doji is a type of candlestick with little to no body.
The entire candle is basically made up of wicks.
This pattern forms when the open and close are the same (or very close) within a trading session.
The length of the wicks can vary — they can be short or very long.
🔨 Hammer and Hanging Man are among the most popular reversal patterns.
What makes them interesting is that they can be both bullish or bearish, depending on where they appear in the market cycle.
If this candle appears after a downtrend, it signals weakening selling pressure — this is called a Hammer .
If the same candle appears after an uptrend, it signals weakening buying pressure — this is called a Hanging Man .
🔍 How to identify them:
1️⃣ The body is located at the top of the price range
2️⃣ The lower wick is at least 2x longer than the body
3️⃣ There is little to no upper wick
The longer the lower wick and the smaller the body, the stronger the signal — whether it’s a bullish Hammer or a bearish Hanging Man.
📲 Engulfing pattern is formed by two candles with opposite-colored bodies and is one of the most important reversal signals in the market.
Key conditions:
1️⃣ There must be a clear uptrend or downtrend in the market
2️⃣ The pattern consists of two candles, where the second candle fully engulfs the first one
3️⃣ The second candle must be opposite in color
Factors that increase the probability of a reversal:
1️⃣ The first candle has a small body, while the second one is much larger — this shows the previous trend is weakening and a new one is gaining strength
2️⃣ The engulfing pattern appears after a prolonged or strong trend
3️⃣ The second candle is formed with high trading volume
4️⃣ The second candle engulfs multiple previous candles
☁️ Dark Cloud Cover is a two-candle pattern that appears after an uptrend and signals a potential top reversal.
The first candle should have a strong bullish (green) body. On the next session, the price opens above the previous high, but then closes near the lows, covering a significant part of the previous bullish candle.
The lower the close of the second candle, the higher the probability of a trend reversal.
Key factors that strengthen the signal:
1️⃣ The closer the red candle closes to the open of the previous green candle, the higher the chance of a market top
2️⃣ If after a prolonged uptrend there is a strong bullish candle (open = low, close = high) , followed by a strong bearish candle (open = high, close = low) , this is often referred to as an extreme reversal day
3️⃣ If the second candle opens above a key resistance level and then drops, it shows that buyers are losing control
4️⃣ A high trading volume on the second candle increases the probability of the uptrend ending
⛅️ Piercing Pattern is the opposite of the Dark Cloud Cover. It consists of two candles that appear during a downtrend and signals a potential bottom reversal.
The first candle is bearish (red) , and the second one is a strong bullish (green) candle.
This pattern is purely bullish and closely related to the bullish engulfing pattern:
The green candle only partially covers the previous red candle. The more of the red body it covers, the higher the probability of a reversal.
In an ideal setup, the green candle should close above the midpoint of the previous red candle.
Variations (weaker bullish signals) :
1️⃣ Weak — the green candle closes near the low of the previous candle
2️⃣ Moderate — the green candle closes slightly above the red candle’s close
3️⃣ Shallow push — the green candle fails to reach the midpoint of the red candle
⭐️ Star pattern is a reversal formation represented by a candle with a small body that gaps away from a previous candle with a large body. Wicks can overlap — that’s acceptable.
Stars can appear both at tops and bottoms, and there are several variations of this pattern.
Morning Star (bullish reversal)
A bottom reversal pattern consisting of:
1️⃣ A strong bearish(red) candle
2️⃣ Followed by a small-bodied candle that gaps down(the star)
3️⃣ Then a strong bullish(green) candle that covers a significant portion of the first candle
This indicates that buyers are taking control.
Evening Star (bearish reversal)
The bearish counterpart of the Morning Star, signaling a top reversal:
1️⃣ A strong bullish (green) candle
2️⃣ Followed by a small-bodied candle (the star)
3️⃣ Then a strong bearish(red) candle that covers a significant part of the first candle
Factors that strengthen the signal:
▪️ Gaps between the first candle and the star, as well as between the star and the third candle
▪️ The third candle covers a significant portion of the first candle’s body
▪️ Low volume on the first candle and high volume on the third candle
🌟 Shooting Star is a two-candle pattern that warns of a potential end of an uptrend, but it’s not considered one of the strongest reversal signals.
1️⃣ The candle has a small body located at the lower part of the range and a long upper wick
2️⃣ Like other star patterns, the color of the body doesn’t matter
3️⃣ Ideally, the body forms a gap relative to the previous candle, but this is not required
Inverted Hammer looks very similar to a Shooting Star. It has a small body at the lower part of the range and a long upper wick.
However, unlike the Shooting Star, the Inverted Hammer appears after a downtrend and signals a potential bullish reversal at the bottom.
1️⃣ You should wait for the next candle to confirm the signal — ideally, it opens above the body of the Inverted Hammer
2️⃣ The larger the gap, the stronger the bullish signal
3️⃣ Another confirmation is a strong green candle closing higher
🌿 Harami is a candlestick pattern where a small candle forms within the body of a previous larger candle.
The word “harami” translates from Japanese as “pregnant” — the large candle is the “mother”, and the small candle is the “baby”.
Key features:
1️⃣ The small candle must be fully inside the body of the previous candle (wick length does not matter)
2️⃣ The smaller the “baby” candle, the stronger the signal
3️⃣ Harami is not a strong reversal signal — it usually indicates a pause in the market and the end of the previous trend
Harami Cross is a variation of this pattern:
Instead of a small-bodied candle, a Doji appears after the large candle.
This makes the pattern a much stronger reversal signal.
👮♀️ Belt Hold is a candlestick pattern represented by a long candle.
In the bullish case, it’s a strong green candle that opens at the low of the previous candle and then moves upward.
For the bearish version, everything works in reverse.
The longer the Belt Hold candle, the stronger its impact on the market.
Key points:
1️⃣ If the next candle closes above a bearish Belt Hold, it increases the probability of a continuation of the uptrend
2️⃣ If the next candle closes below a bullish Belt Hold, it signals that selling pressure is increasing again
_ _ _ _ _
👉 If you want to trade like a professional and not like a gambler — follow for real insights and strategies 🚀
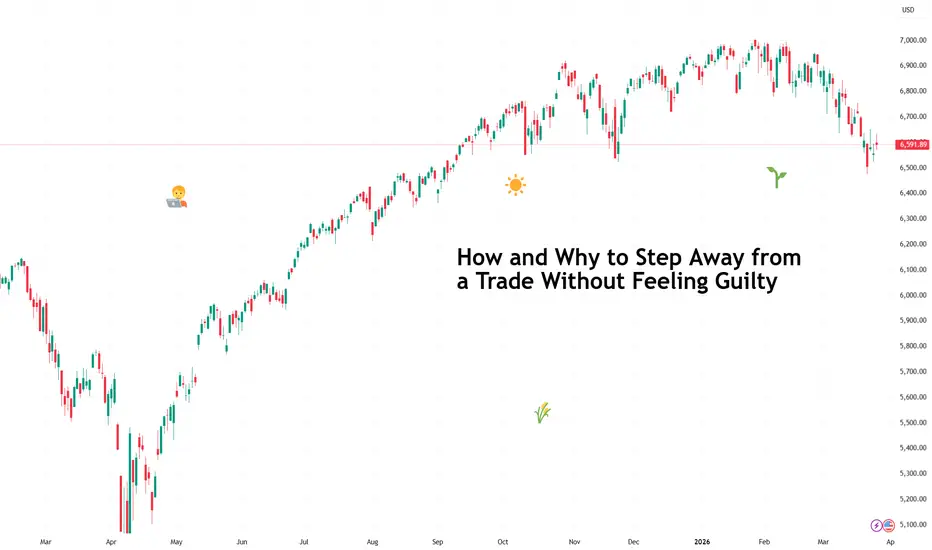
How and Why to Step Away from a Trade Without Feeling GuiltyAt some point, every new trader discovers the hover. You know the one. The trade is open, the position is set, the stop loss is in place, and yet there you are, two inches from the screen, watching the chart refresh every second.
Almost as if your physical proximity is somehow influencing the outcome. It is not. The market has not noticed you are watching. It does not care.
The inability to walk away from an open trade (or a pending trade) is one of the most common and least discussed problems in beginner trading. It feels like diligence. It is actually interference.
🔒 The Setup Is the Decision
Here is the mindset shift that changes everything. By the time a trade is open, the decision is already made. You identified the opportunity, defined your entry, set your stop loss (the price level at which you exit to cap your losses) and your take profit (the target price where you lock in gains).
The work is done. Watching the price move tick by tick adds no new information and subtracts a measurable amount of sanity.
Professional traders often call this "setting and stepping." The trade has a plan. The plan runs the trade. Your job after entry is largely supervisory, not surgical. That’s when things are working in your favor.
📺 What Watching Actually Does to You
Staring at an open position activates a part of your brain that is very good at survival and very bad at trading. Every red candle feels like a threat. Every pullback, even the tiniest temporary move against your position, feels like the beginning of a catastrophe.
The result is a long list of avoidable mistakes. Closing a winning trade too early because a small dip scared you.
Moving your stop loss further away to avoid being taken out, which ironically increases your risk. Adding to a losing position because you have been watching it long enough to convince yourself you understand what it is doing.
None of these decisions come from analysis. They come from proximity and anxiety, which is a terrible combination.
✅ When Stepping Away Is Responsible, Not Lazy
Stepping away is appropriate in several concrete situations. When your stop loss and take profit are set and the trade simply needs time to play out, there is nothing left to manage.
When you notice yourself making up narratives about why the trade should be doing something different from what it is doing, that is a signal to close the laptop (or turn away from the dual-monitor setup), not adjust the position.
When you have been watching for so long that the chart starts to look like it is talking to you, it has been too long.
A useful exercise is to ask yourself, before looking at the chart again: has anything materially changed in the market since I last looked?
New economic data , a major news event , a significant shift in the broader market environment.
If the answer is no, the chart looks the same as it did twelve minutes ago. You already know that. You just wanted to check.
🕰️ Building the Habit of Structured Checking
The practical solution is a self-administered checking schedule and setting up price alerts .
Decide in advance how often you will review an open position, once an hour, at the close of each candle, twice a day, whatever suits your trading timeframe, and then leave the rest to the price alerts. Between those check-ins, the trade is running. You are not.
This feels uncomfortable at first. That discomfort is the point – you’re building muscle. You are training yourself to trust the plan over the impulse, which is the single most valuable skill a beginner can build.
🚶 The Walk That Saves Accounts
Some of the best trade management decisions happen on a ten minute walk. Away from the screen, without a chart refreshing in front of you, the position becomes abstract again. You remember why you took it and what your target-to-risk ratio is.
You come back calmer, and calmer traders make better decisions. The market runs twenty-four hours in some asset classes. It will be there when you get back.
Step away. The trade knows what it is doing, even when it feels like it doesn't.
Off to you : How do you deal with the sense of urgency when trading and are you able to step away for a second and touch grass? Share your experience in the comments!
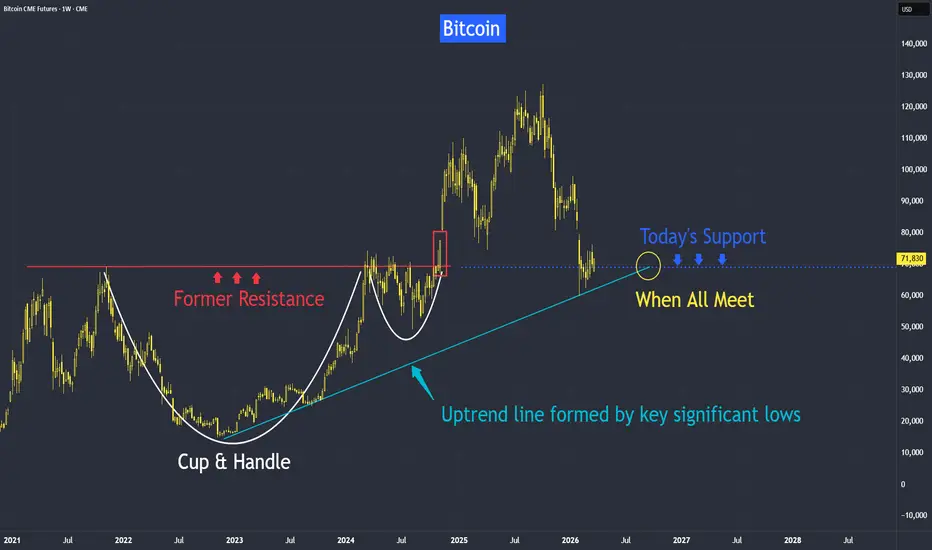
Bitcoin Key Support Level at 70,000It has fallen from last year's highs, but technical support could be near, and also supported by several fundamental factors.
Let me first touch on two key fundamentals before covering the technical aspects.
1) Regulator creating a friendlier environment - with new SEC rules and upcoming legislation (CLARITY Act)
2) Institutional adoption — major banks like Morgan Stanley and Goldman Sachs are now launching their own crypto ETFs. market demand is expected to drive the launch of 25 to 50 new crypto-linked funds by 2026.
Its video version:
Mirco Bitcoin Futures and Options
Ticker: MBT
Minimum fluctuation:
$5.00 per bitcoin = $0.50 per contract
Disclaimer:
• What presented here is not a recommendation, please consult your licensed broker.
• Our mission is to create lateral thinking skills for every investor and trader, knowing when to take a calculated risk with market uncertainty and a bolder risk when opportunity arises.
CME Real-time Market Data help identify trading set-ups in real-time and express my market views. If you have futures in your trading portfolio, you can check out on CME Group data plans available that suit your trading needs tradingview.com/cme/
Silver Analysis: Which Direction Is Next?Before anything else, it’s important to note that silver, unlike gold, tends to have sharp and aggressive corrective moves. This makes it a bit more challenging to trade, so proper risk management and caution are essential when dealing with it.
From the point where we placed the red arrow on the chart, the corrective phase in silver appears to have started.
This correction currently looks like either a flat structure or possibly a more complex corrective pattern, such as a diametric formation.
At the moment, price action seems to be within wave C, which is typically a bearish wave.
The best support zone and potential rebuy area for short-term trading is the green zone highlighted on the chart.
From this green zone, a move is expected, with a potential target of at least $69.
If you have a symbole or altcoin you want analyzed, first hit the like button and then comment its name so I can review it for you.
What do you think? Is TON bullish?

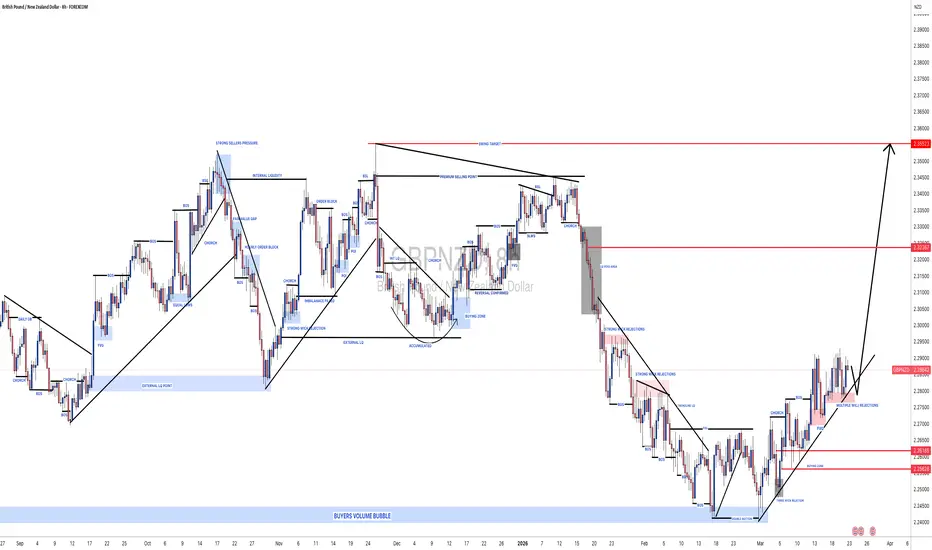
#GBPNZD: Two Targets, Once Strong Bullish Entry! ✴️ The GBP/NZD pair demonstrated a favourable reversal upon reaching our designated buying zone at 2.256, currently trading at 2.287. This indicates potential for continued upward momentum. We anticipate the price may advance towards the 2.32 level where a liquidity void is expected to be addressed. The British Pound is projected to maintain its strength against the New Zealand Dollar with expectations of a robust bullish continuation extending to 2.35.
✴️ Our strategic targets are established at 2.32 for the initial objective and 2.35 for the secondary objective. The successful execution of these trades is contingent upon strong fundamental support. We recommend closely monitoring price action on Monday to inform subsequent trading decisions. Adherence to stringent risk management protocols is advised.
We wish you successful and secure trading.
Sincerely,
Team Setupsfx 🧠❤️
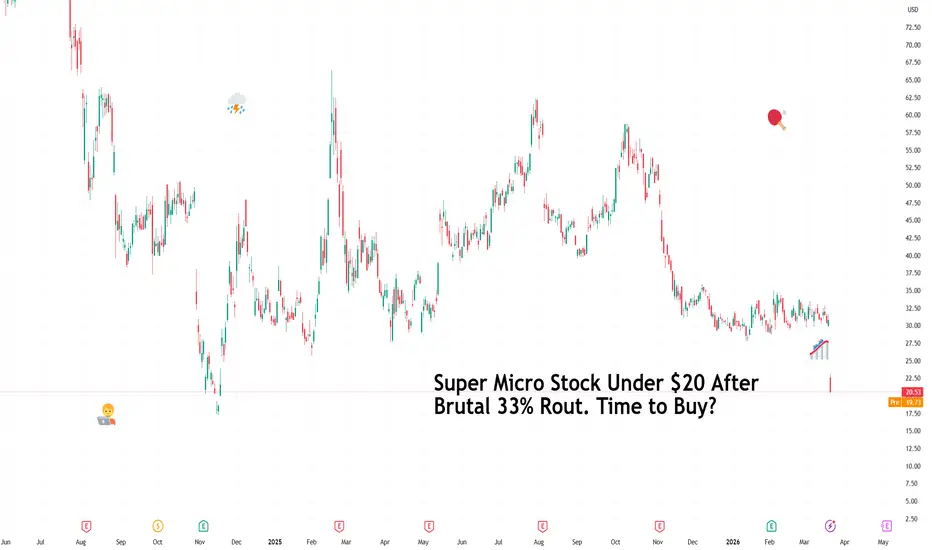
Super Micro Stock Under $20 After Brutal 33% Rout. Time to Buy?If only there was a way to track where things went wrong.
The board of directors at Super Micro NASDAQ:SMCI got together one day in the boardroom and decided it’s a good idea to bring back the same executive who had already resigned once over an accounting scandal.
They voted to hire him as a consultant and later promoted him to senior vice president. Then put him back on the board.
That executive has now been arrested for allegedly smuggling $2.5 billion worth of Nvidia NASDAQ:NVDA AI chip servers to Chinese customers. And cost the company $6 billion in wiped out market cap on Friday. The Netflix NASDAQ:NFLX documentary practically writes itself.
Super Micro Computer stock NASDAQ:SMCI dropped 33% on Friday after the news dropped during pre-market trading. With pre-market Monday prices at $19 (another 4% implied drop), it sits more than 84% below its all-time high of $123 from March 2024.
The question the market is now chewing on: is this a buying opportunity, or is it a value trap?
🚨 What Actually Happened
The US Attorney's Office for the Southern District of New York charged Wally Liaw, a Super Micro co-founder and board member, along with a Taiwan-based company employee and a contractor named Willy Sun, with violating US export controls.
The allegation is that the three conspired to ship Nvidia AI chip servers to Chinese customers, sidestepping the restrictions successive US administrations have placed on advanced chip exports to China.
Liaw and Sun have been arrested. A third defendant, Steven Chang, a Super Micro sales manager based in Taiwan, "remains a fugitive," according to the Department of Justice.
Super Micro itself is not named as a defendant in the indictment, which is a meaningful legal distinction, though the market on Friday was in no mood for nuance.
📜 Liaw's Remarkable Track Record
Here is where the story earns its documentary potential. This is, remarkably, Wally Liaw's second act at Super Micro.
He first resigned in 2018, alongside the company's finance chief, following an audit committee investigation that led Super Micro to restate its financial results.
In 2020, the company paid $17.5 million to settle SEC allegations of widespread accounting violations. Liaw returned as a consultant in 2021, was promoted to senior vice president in 2022, and was reinstalled as a board member in late 2023.
The due diligence conversation that preceded that board reappointment would be an interesting one to read.
📉 A Stock That Knows How to Fall
Super Micro is no stranger to turbulence. In 2024, the company delayed its annual report filings following another accounting investigation, triggering a Nasdaq delisting warning .
A short seller report alleging financial irregularities landed around the same time. Its auditor resigned . The stock spent most of the past two years absorbing one headline after another.
Heading into Monday’s open, shares were lower by 50% over the prior twelve months. Under $20, it is trading at a fraction of the valuation that briefly made it one of the most talked-about AI infrastructure plays in the market.
🤔 So, Time to Buy?
All things considered, Super Micro is a real business. It packages Nvidia's AI chips into servers and sells them to major US tech groups, sitting at a genuinely useful point in the AI infrastructure supply chain.
The problem is there have been patterns. Accounting restatements, SEC settlements, auditor resignations, delisting warnings, and now a criminal indictment involving a co-founder.
Each of these events, taken alone, might be survivable. Together, they describe a company with a structural governance problem that keeps expressing itself in new and creative ways.
Value investors will point to the price. The stock, at $12.3 billion, is cheap relative to where it was. Risk-tolerant traders might see a bounce from oversold levels, a technical term for when selling has been so aggressive that a short-term recovery becomes statistically likely even without good news.
At this point, the honest answer is that this is a speculation, not an investment, until Super Micro demonstrates that the board overhaul is real, the accounting is clean, and the next headline is something different than arrests or manhunt.
At $20, the risk-reward is not obviously wrong. It’s a huge drop after all, with the stock ranking third on the “Biggest losers” board on Friday. The risk-reward is genuinely unknown, and those are very different things.
Off to you : Are you looking to buy the huge dip at today’s opening bell? Or do you expect it to drop some more? Share your views in the comments!
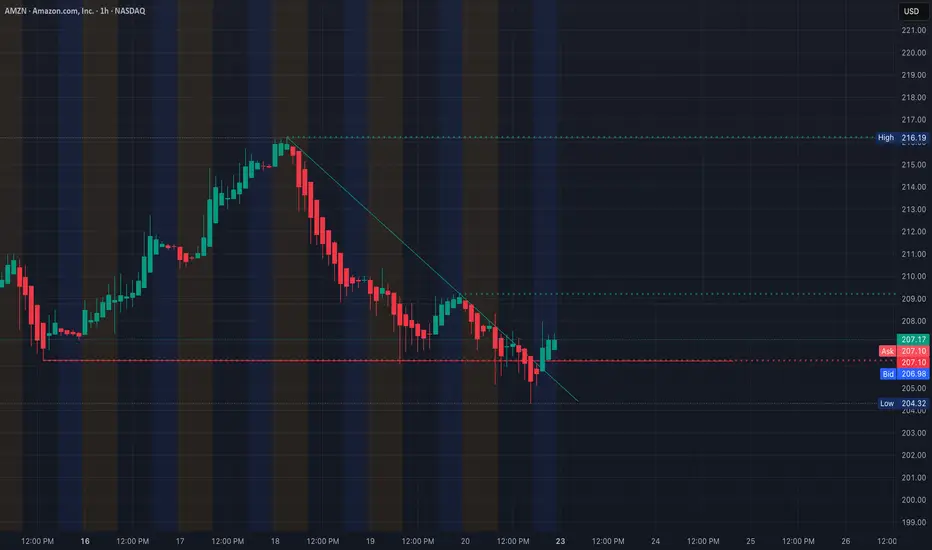
AMZN Holding Range - Waiting for Direction. Mar. 23Looking at AMZN right now, price is coming off a selloff but starting to stabilize around the 205–207 area.
This looks like a base forming, but it’s still sitting right under a key resistance zone.
1H Structure - Downtrend Trying to Slow
On the 1H chart, AMZN has been trending lower with consistent lower highs.
The recent bounce from around 204 shows buyers stepping in, but price is still below the main supply area around 208–209.
That means sellers still have control unless this level breaks clean.
15-Min Structure - Range / Early Transition
On the 15-minute chart, price is starting to compress.
We had a push down, then a bounce, and now consolidation between 205–207.
* Liquidity was taken below 204
* Buyers reacted quickly
* Price reclaimed into the range
* Now it’s moving sideways
This is typical behavior when price is transitioning, but not trending yet.
Phase Context
We had distribution near 208–209
Then a markdown move down to 204
Now price is attempting to build a base
So currently, AMZN is between markdown and early accumulation — still neutral until we get confirmation.
GEX Context (Simple Read)
Options positioning shows strong resistance stacked above around 230–250.
That suggests upside may be capped unless momentum really builds.
On the downside, support is building around 195–200, which aligns with where buyers stepped in before.
So for now, GEX supports more of a range unless price breaks out of this zone.
Key Levels
Resistance - 208 to 209
Major resistance - 210+
Support - 205
Major support - 204 to 200
Scenarios
If AMZN breaks and holds above 209, we could see continuation toward the 210+ area.
If price rejects again and loses 204, the downtrend likely continues.
Simple View
Right now AMZN is:
* holding a base
* sitting under resistance
* waiting for direction
This is a decision zone, not a clean setup yet.
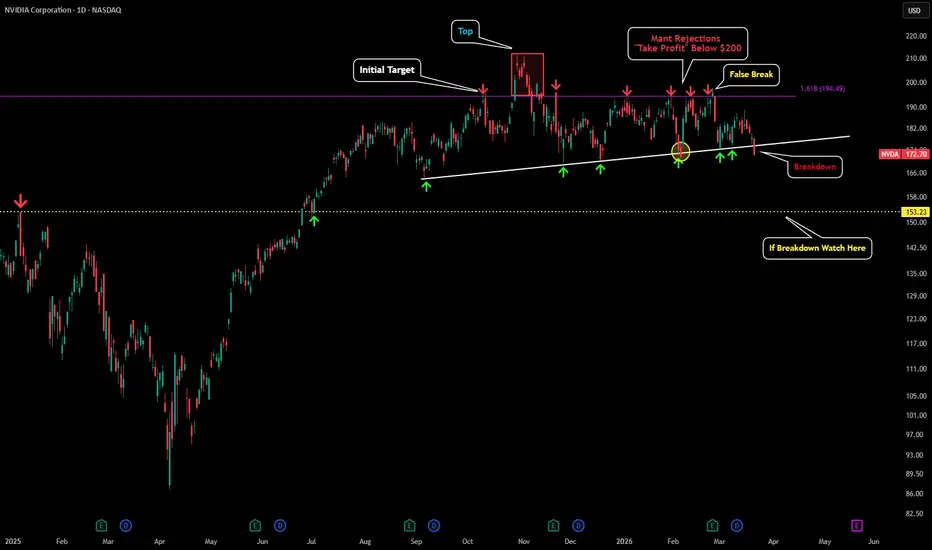
NVDA - On Verge of Breakdown This is an update to my last post:
I have been monitoring this trendline for quite some time, and with Friday's close, NVDA has broken below a trendline it has been holding for the past six to seven months which is a significant development.
It is possible for NVDA to reclaim this trendline on Monday, as occurred previously (marked by the yellow circle on the chart). However, for now it is best to assume that will not be the case, and that price will either continue lower from here or stage a brief retest of the trendline before declining further.
The first breakdown target sits around $153, marked by the yellow dotted line. However, given that this would represent a loss of the range NVDA has been trading within for so long, a much larger correction becomes very plausible from here.
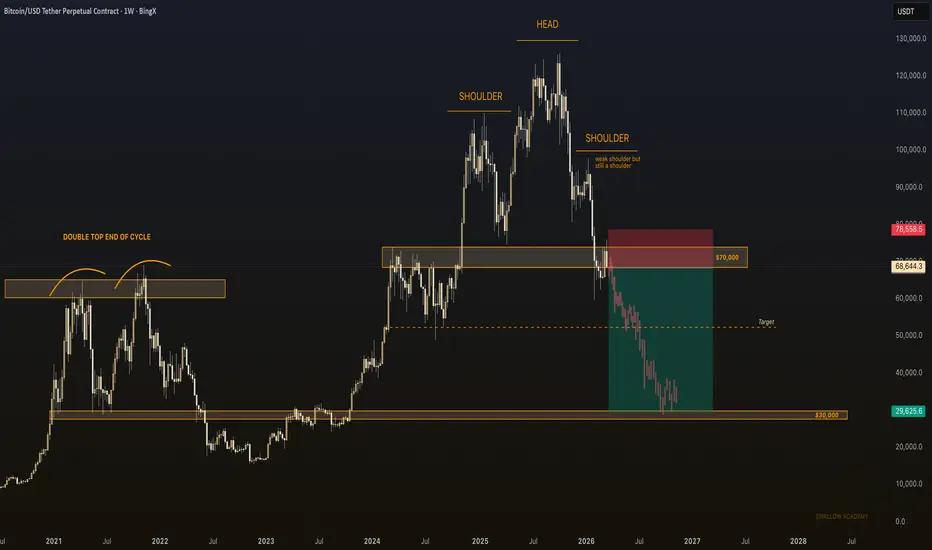
Bitcoin | We Are Officially In Bear MarketThe structure of Bitcoin is telling us just one thing: we are going to keep moving to lower zones from here on; we are in a bear phase of the markets.
Now saying that we are in bear markets is a little extreme, some might say but let's face the facts here: this bull market we had was never supposed to be exactly the same as the previous times, and as many traders were expecting, the most logical thing happened.
The opposite of expectation happened, where Bitcoin had its momentum and left most of the altcoins behind it.
So as we lost the major support at $70,000, where we had a strong breakdown, it seems like this ATH has been finished with a head & shoulders pattern.
A strong retest of that broken zone has been successfully rejected as well, which once again showed the dominance by sellers.
The next plan for us here is the $52,300; after that, we might be bottoming near the $30,000, which seems like a lot as of now but if we look at the bigger picture, it seems the most logical zone for an accumulation!
Swallow Academy
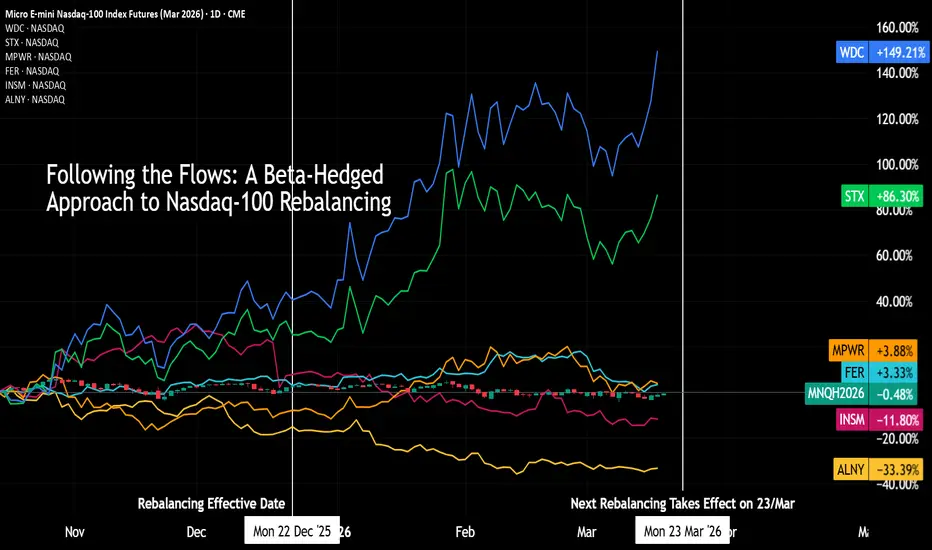
Following the Flows: Beta-Hedging around Nasdaq RebalancingRebalancing can create some of the most predictable flows in equity markets. When an index changes the weights of its constituents, funds tracking it must buy and sell the affected stocks to stay aligned with the benchmark. Those adjustments can influence prices, particularly for companies seeing the largest weight changes relative to their market cap/daily volume.
The Nasdaq-100 is a good example. Its modified market-capitalisation methodology forces a redistribution of weight across the broader index when the largest constituents become too dominant. The result is a rotation wherein large index constituents are trimmed while smaller constituents absorb the redistributed weight.
This note examines how Nasdaq-100 rebalancing/reconstitution operates and outlines a simple educational trade structure using Micro E-mini Nasdaq-100 futures to illustrate how traders can position around rebalancing.
Rebalancing Rules
The Nasdaq-100 is constructed using a modified market-capitalisation weighting framework designed to prevent excessive concentration among the largest constituents.
The index undergoes two types of adjustments.
Annual reconstitution determines which companies are included in the index. Companies may be added or removed depending on eligibility requirements such as listing venue, market capitalisation, and sector classification.
Quarterly rebalancing, in contrast, adjusts constituent weights. The process begins with raw market-capitalisation weights based on updated prices and shares outstanding. These weights are then tested against two concentration thresholds embedded in the methodology.
First, no single company may exceed 24% of the index weight. If breached, the company is scaled down to 20%.
Second, the combined weight of companies exceeding 4.5% cannot exceed 48% of the index. If breached, the largest companies are scaled down and the excess weight redistributed across smaller constituents while preserving rank order.
The Nasdaq-100 is rebalanced and reconstituted periodically. The calendar for 2026 rebalance/reconstitution events is provided below.
Firms Exposed to the Current Rebalance
Applying the Nasdaq-100 methodology to recent market capitalisations highlights a cluster of mega-cap technology firms that are likely to be trimmed down at the March rebalance.
As of 02/March, 2026, the cumulative weight of firms with 4.5% of index weight summed up to 60.8%. To scale them back to 40%, we must multiply their weights by 0.66.
Likewise, for the remaining 39.2% of the weight, they must be scaled to 60% cumulatively. Multiplying each weight by 1.53 would give us the new weights for these firms.
However, doing this naively would alter the ranking post-adjustment, as seen in the table above. Therefore, Nasdaq subsequently adjusts the weights of constituents to preserve rank order, meaning the final weights may differ slightly from the proportional redistribution shown here.
Capping all subsequent weights below Meta’s new 2.98%, and redistributing down the rest of the index iteratively, the new weights could be similar to the following:
The biggest gainer would be the ASML ADR, while Micron, Costco, and Netflix also gained about 1% in their weights for the quarter.
The annual reconstitution, on the other hand, takes place in December, wherein several firms were introduced in 2025:
Source: Nasdaq
The rules for the reconstitution are dictated by market-cap weighted rankings while adding a lag factor to ensure firms are not being constantly added/removed.
For reference, the firms removed last year were:
Source: Nasdaq
Historical Trade Example
Consider an investor anticipating index-addition flows into the six firms following their inclusion in the Nasdaq-100 in December, 2025.
To isolate these stocks’ relative performances while neutralising broader market exposure, the position can be hedged using Micro E-mini Nasdaq-100 futures.
Assume the investor allocates $100,000 equally across these 6 tickers: WDC, STX, MPWR, FER, ALNY, and INSM. Taking prices from 19/Dec 2025 for all of them, an allocation of roughly 552 shares across firms is made, with an average share price of $181.53.
To estimate the portfolio’s sensitivity to the Nasdaq-100, we compute a value-weighted average beta across the six positions. Each stock’s beta is weighted by its share of the total invested capital, and the contributions are summed to arrive at an aggregate portfolio beta.
The individual weights amount to about 0.166, given an almost proportional allocation. For example, the weight for MPWR would be 16,866/100,202 = 0.168.
Computing the aggregate beta for the portfolio:
0.166(1.76) + 0.165(1.61) + 0.168(1.45) + 0.166(0.15) + 0.168(0.36) + 0.166(1.13) = 1.07
This brings our aggregate exposure to 107,000, and in order to hedge this position, we would require:
107,000/50,600 = 2.11, or roughly 2 MNQ contracts.
If the position of holding our portfolio while shorting 2 MNQ futures was held from 19/Dec to 20/Jan, i.e. the window comprising one month after the last rebalancing, the P&L would have been as follows:
Stock PnL
3,864 + 1,680+ 1,746 +0 −1,890 − 1,140 = 4,260
Futures PnL
2 x 2 x (25,300 – 25,100) = 800
Net strategy PnL
4,260 + 800 = USD 5,060
Had that position been held until the date of the next rebalancing announcement (March 13, 2026), the relative performance would have been as follows:
Stock PnL
8,372 + 4,928 + 2,070 – 996 − 3,654 − 3,325 = 7,395
Futures PnL
2 x 2 x (25,300 – 24,500) = 3,200
Net strategy PnL
7,395 + 3,200 = USD 10,595
While the example above focuses on a basket of select few stocks that were added to the index just last year, investors anticipating index inflows may construct a basket of likely beneficiaries around quarterly rebalances as well, all while hedging market exposure through Nasdaq-100 futures.
More sophisticated implementations may involve combining several expected gainers and losers within the same portfolio, or dynamically adjusting hedge ratios to reflect differing betas and index sensitivities across constituents.
MNQ futures allow investors to tailor strategies to their own risk preferences and market views, while maintaining the objective of isolating stock-specific performance from broader market movements.
This content is sponsored.
MARKET DATA
CME Real-time Market Data helps identify trading setups and more effectively express market views. If you have futures in your trading portfolio, you can check out on CME Group data plans available that suit your trading needs at tradingview.com/cme .
DISCLAIMER
This case study is for educational purposes only and does not constitute investment recommendations or advice. Nor are they used to promote any specific products, or services.
Trading or investment ideas cited here are for illustration only, as an integral part of a case study to demonstrate the fundamental concepts in risk management or trading under the market scenarios being discussed.
Tungsten: gaining exposure to a strategic military metalGeopolitical events in the Middle East have had a strong impact on the commodities market. In particular, the energy sector has experienced a sharp rise in oil and natural gas prices, which may seem quite logical given the disruptions affecting energy supply around the Persian Gulf. However, in the metals segment, the expected movements have not materialized, as precious metals were not the ones supported, since they were already heavily overbought and had been in strong demand for several months due to geopolitical factors.
Within the metals segment of the commodities market, the clear leader since the beginning of the military operations on February 28 has been tungsten. This metal, which is not traded on the stock market like gold or silver, has seen its price rise by more than 400%. Tungsten is indeed a strategic military metal because it is used in the manufacturing of many of the most decisive types of ammunition within the global military apparatus.
Given the intensity of current military operations as well as those expected in the future, major powers need to rebuild their war reserves, and this will inevitably require strong demand for tungsten.
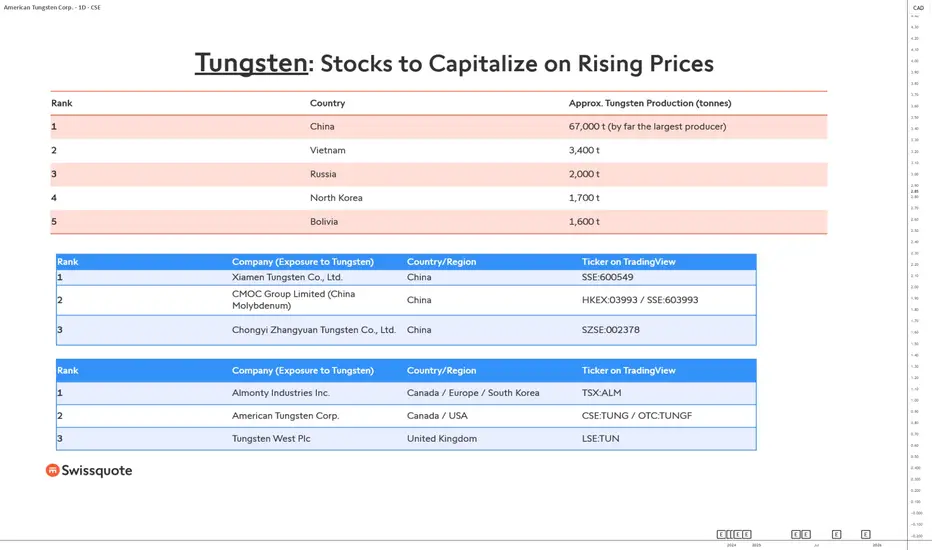
However, tungsten is a rare strategic metal. China is the world’s leading producer and alone accounts for about 80% of global supply. The United States will make every effort to expand its production, but supply constraints will likely persist over the coming years, putting upward pressure on prices. It is not possible to gain direct exposure to tungsten on the stock market as one can with gold or silver.
However, the main tungsten producers are listed companies, and the table below shows the top three Chinese companies in tungsten and the top three Western tungsten companies.
These companies currently represent the main stock market vehicles for gaining indirect exposure to tungsten price movements. Chinese companies largely dominate the value chain, whether in ore extraction, refining, or industrial processing. This dominance reflects China’s strategic lead in critical metals, a field in which Beijing has invested massively for several decades in order to secure its supply and strengthen its industrial and military influence.
On the Western side, several companies are gradually trying to develop alternative production capacities. Although their volumes remain modest compared with Chinese production, these companies are attracting increasing interest from governments and investors, particularly in the context of policies aimed at securing supply chains. Critical metals, including tungsten, are now at the heart of the industrial and defense strategies of major powers.
In this context, Western producers could benefit both from a favorable price environment and from supportive public policies. For investors, these companies therefore represent an indirect but potentially effective way to position themselves in a strategic metal whose demand could remain structurally high in the coming years.
The chart below shows, for example, the daily Japanese candlesticks of American Tungsten Corp, with an upward trend above the 200-day moving average.
DISCLAIMER:
This content is intended for individuals who are familiar with financial markets and instruments and is for information purposes only. The presented idea (including market commentary, market data and observations) is not a work product of any research department of Swissquote or its affiliates. This material is intended to highlight market action and does not constitute investment, legal or tax advice. If you are a retail investor or lack experience in trading complex financial products, it is advisable to seek professional advice from licensed advisor before making any financial decisions.
This content is not intended to manipulate the market or encourage any specific financial behavior.
Swissquote makes no representation or warranty as to the quality, completeness, accuracy, comprehensiveness or non-infringement of such content. The views expressed are those of the consultant and are provided for educational purposes only. Any information provided relating to a product or market should not be construed as recommending an investment strategy or transaction. Past performance is not a guarantee of future results.
Swissquote and its employees and representatives shall in no event be held liable for any damages or losses arising directly or indirectly from decisions made on the basis of this content.
The use of any third-party brands or trademarks is for information only and does not imply endorsement by Swissquote, or that the trademark owner has authorised Swissquote to promote its products or services.
Swissquote is the marketing brand for the activities of Swissquote Bank Ltd (Switzerland) regulated by FINMA, Swissquote Capital Markets Limited regulated by CySEC (Cyprus), Swissquote Bank Europe SA (Luxembourg) regulated by the CSSF, Swissquote Ltd (UK) regulated by the FCA, Swissquote Financial Services (Malta) Ltd regulated by the Malta Financial Services Authority, Swissquote MEA Ltd. (UAE) regulated by the Dubai Financial Services Authority, Swissquote Pte Ltd (Singapore) regulated by the Monetary Authority of Singapore, Swissquote Asia Limited (Hong Kong) licensed by the Hong Kong Securities and Futures Commission (SFC) and Swissquote South Africa (Pty) Ltd supervised by the FSCA.
Products and services of Swissquote are only intended for those permitted to receive them under local law.
All investments carry a degree of risk. The risk of loss in trading or holding financial instruments can be substantial. The value of financial instruments, including but not limited to stocks, bonds, cryptocurrencies, and other assets, can fluctuate both upwards and downwards. There is a significant risk of financial loss when buying, selling, holding, staking, or investing in these instruments. SQBE makes no recommendations regarding any specific investment, transaction, or the use of any particular investment strategy.
CFDs are complex instruments and come with a high risk of losing money rapidly due to leverage. The vast majority of retail client accounts suffer capital losses when trading in CFDs. You should consider whether you understand how CFDs work and whether you can afford to take the high risk of losing your money.
Digital Assets are unregulated in most countries and consumer protection rules may not apply. As highly volatile speculative investments, Digital Assets are not suitable for investors without a high-risk tolerance. Make sure you understand each Digital Asset before you trade.
Cryptocurrencies are not considered legal tender in some jurisdictions and are subject to regulatory uncertainties.
The use of Internet-based systems can involve high risks, including, but not limited to, fraud, cyber-attacks, network and communication failures, as well as identity theft and phishing attacks related to crypto-assets.
How to Day Trade Futures While Still Working Hey Traders here is quick way to use end of day trading to day trade the futures market. This is really easy set it and forget it system. You place your entry orders when the market is quiet and closed. This gives you a great time to trade with good risk vs reward with stop losses and take profits. This can be applied to futures and other markets or even prop firm trading accounts.
Good Luck & Always use Risk Management!
(Just in we are wrong in our analysis most experts recommend never to risk more than 2% of your account equity on any given trade.)
Hope This Helps Your Trading 😃
Clifford
RISK DISCLOSURE
TRADING IN THE FUTURES AND FOREX MARKET INVOLVES SIGNIFICANT RISK. ALWAYS CONSULT A FINANCIAL ADVISOR AS HIGH RISK ASSET CLASSES MAY NOT BE SUITABLE FOR ALL INVESTORS. THIS IS NOT A RECOMMENDATION TO BUY OR SELL ANY ASSETS. ALL IDEAS ARE MADE FOR EDUCATIONAL PURPOSES. PAST PERFORMANCE DOES NOT GUARANTEE FUTURE RESULTS.
CFTC RULE 4.41 – HYPOTHETICAL OR SIMULATED PERFORMANCE RESULTS HAVE CERTAIN LIMITATIONS. UNLIKE AN ACTUAL PERFORMANCE RECORD, SIMULATED RESULTS DO NOT REPRESENT ACTUAL TRADING.

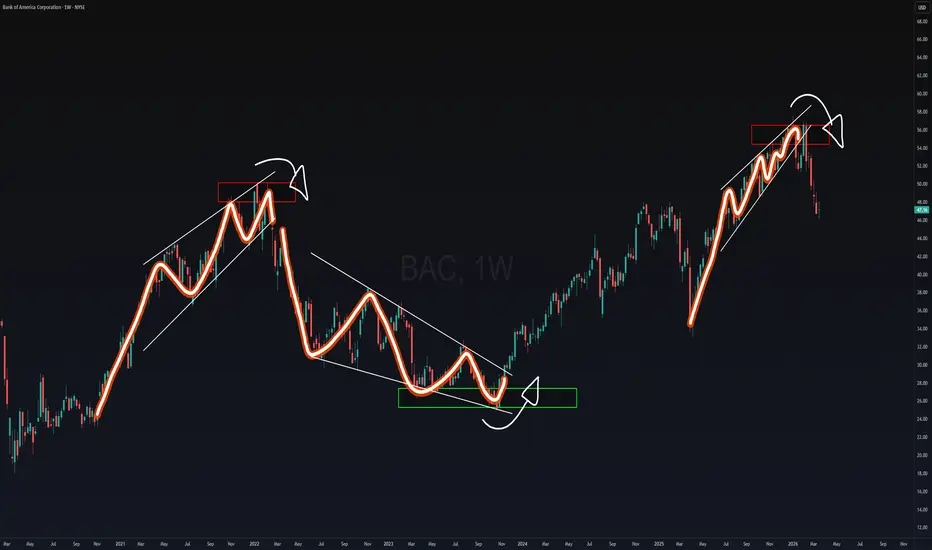
Textbook Patterns | How to Spot a WedgeBest way to spot chart patterns are by simply looking for the loss in momentum and linking the external points to outline the pattern your looking for.
I'll stick to just one textbook pattern to keep it simple for now.
LOSS IN MOMENTUM
In this first example starting from the left side of the chart we can see buyers lose momentum by identifying external points and visually looking for exhaustion as price continues to rise.
Same goes with the sellers when price declines. Momentum dies off and hands the power back over to bulls.
PATTERN
Now that we spotted the loss in momentum we can link those external points to create a visual representation of a wedged-like shape.
BREAKOUT
A squeeze is now created at the smallest point of the shape and this is where the breakout occurs.
BONUS
Another way to make sure these patterns are valid and powerful is by looking for areas of liquidity and or levels of support/resistance.
Hope this was educational and helpful as it could strengthen your current strategy or if your a beginner this may have been very insightful, enjoy! :)
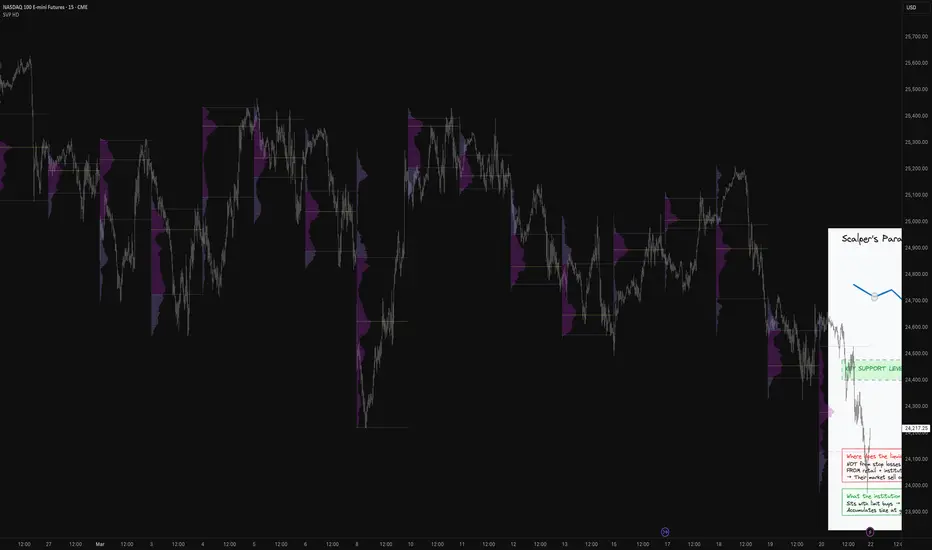
Scalper's Paradise Part 4 – When the False Breakout Is a TrapWelcome back to Scalper's Paradise - Part 4! Let me start with something controversial: institutions are not hunting your stop loss. I know — that's not what you've heard. But after working as an institutional trader, I can tell you that the "stop hunt" narrative, while emotionally satisfying, gets the mechanics completely wrong. And that misunderstanding is costing traders money every single day.
First: The Math Doesn't Add Up
Let me be direct. I've worked as an institutional trader. The idea that a fund managing billions of dollars is sitting at a desk, targeting the 20-tick stop loss on your 2-contract MNQ position — it simply doesn't hold up.
The retail market represents a fraction of total market volume — we're talking single-digit percentages at best. No institution is "hunting" you. Economically, it simply doesn't make sense. A fund that needs to move billions in size can't source that liquidity from retail traders. The only counterparties large enough are other institutions. Big players can only accumulate over time, transacting with other big players.
The Real Problem Institutions Have
Institutions need to move size. Imagine you need to buy 5,000 NQ contracts. You can't just hit the market — you'd move price against yourself before you're even halfway filled. Your average entry price would be terrible, and your performance gets measured on exactly that.
So what do you do? You wait for moments where there is a flood of liquidity — where a large number of market orders hit at once. That's your window to fill size without moving the market against you.
Just to frame the situation:
The Breakout we are talking about:
What Actually Happens at "Obvious" Levels
Here's the reality behind what retail traders call a "fakeout" or "stop hunt."
Price breaks below a well-known support level — but here's what you'll notice if you watch the data: the volume on that break is low. Not nearly enough for any institution to fill meaningful size. That's your first clue that something else is going on.
What the false breakout actually does is create an illusion. To most traders — retail and institutional alike — it looks like a confirmed breakdown. Price broke the level, and now it's retracing. A textbook short setup.
And that's exactly the point.
Retail traders start shorting the retracement. Other institutions that wanted to go short anyway see their entry. Suddenly there's a flood of market sell orders — not from stop losses at the sweep, but from everyone who just got convinced the breakdown is real.
This is the liquidity the accumulating institution was waiting for. They sit with large limit buy orders and let all those market sells fill them — quietly building a massive long position at exactly the level retail just abandoned.
Retail alone would never provide enough volume. But retail plus other institutions entering short? That's a liquidity pool large enough for a big player to actually work with.
What's happening - 1:
What's happening - 2:
It's About Average Price, Not Your Stop
Think back to Part 1 where we discussed how institutional performance is measured against VWAP. The goal is always: build the largest position at the best possible average price.
A false breakout at a key level creates exactly that opportunity — not because of the stops triggered at the sweep, but because of everything that happens after. The illusion of a confirmed breakdown pulls in sellers. Retail shorts the retracement. Other institutions that wanted to go short see their setup and enter. All of those are market sell orders hitting the book.
The accumulating institution sits with limit buys and lets the market come to them. They're not chasing price. They're not hunting your stop. They're simply using the selling pressure created by the false breakout illusion to build their position at favorable prices — quietly, over time, transaction by transaction.
That's how you move billions. Not in one trade. Not by hunting a $200 stop loss.
The Real move:
What This Means for You as a Retail Trader
Stop thinking: "They're hunting my stop."
Start thinking: "Where is predictable liquidity sitting, and what happens after it gets absorbed?"
When you see a sharp sweep of an obvious level followed by a quick reversal — that's not random. That's absorption. A large player used that liquidity event to build a position, and now price is moving in the direction of that position.
Your edge isn't avoiding the sweep. Your edge is recognizing what the sweep reveals.
The complete thought process:
How to Start Thinking This Way — A Framework for Beginners
I want to be upfront about something: there is no 100% in trading. Anyone who tells you otherwise is selling something. What we're building here isn't a rule — it's a way of thinking. A mental framework that helps you ask better questions at the right moments.
Here's how I'd approach it if I were starting from scratch.
Step 1: Find the obvious level before price gets there.
Look at your chart and ask yourself: where would the majority of traders put their stop loss right now? Below the most recent swing low. Below a round number. Below yesterday's low. These are the levels that are so obvious that everyone is watching them — which is exactly why they matter.
You're not looking for secret levels. You're looking for the most crowded, most predictable spots on the chart. That's where the setup begins.
Step 2: Watch the volume when price breaks that level.
This is the most important moment. When price breaks below your identified level, don't react immediately. Instead, ask: *is this break supported by high volume, or is it thin?*
A real breakdown typically comes with conviction — large volume, momentum, follow-through. A sweep typically looks different: price pokes below the level quickly, volume is relatively low, and it doesn't go far. It feels almost too fast.
And this is exactly where the two scenarios split. Low volume at the break? Think sweep. High volume with follow-through? That's a different story entirely — and one worth understanding just as deeply. In Part 5, we'll go into exactly that logic: what a real breakout looks like, how to read it, and why the volume signature is the key difference between the two.
You won't get this right every time. But over time, you'll start to develop an eye for it.
Step 3: Watch what happens next — the retracement is the story.
Here's where most retail traders get it wrong. They see the break, assume the trend is down, and short the retracement. That's completely logical — and that's exactly the point. It's supposed to look like a confirmed breakdown.
Ask yourself: is price reclaiming the level quickly? Is the retracement happening without much selling pressure? If the answer is yes, you might be watching absorption in action — a large player quietly buying into every sell order that comes in.
Step 4: Don't try to be early. Be late on purpose.
One of the hardest things to accept as a new trader is that waiting is a skill. You don't need to catch the very bottom of the sweep. You don't need to be the first one in.
What you need is confirmation. Wait for price to reclaim the swept level. Wait for the volume signature to make sense. Let the market show you what it wants to do — then align with it.
Being a little late and right is infinitely more valuable than being early and wrong.
The Question You Should Always Be Asking
Every time you see a sharp move into an obvious level, train yourself to stop and ask one question before doing anything:
"Is this a real move — or is someone using this moment to fill size?"
You won't always know the answer. That's okay. The goal isn't to be certain. The goal is to stop reacting emotionally and start observing intentionally. Over time, the more you ask that question, the more patterns you'll start to recognize.
That shift — from reacting to observing — is what separates traders who last from traders who don't.
Bringing It All Together
In Part 1, we established how institutions measure execution quality against VWAP — average price is everything. In Part 2, we saw how large volume on a 10-second chart reveals institutional activity. In Part 3, we learned how to read absorption live through Order Flow and the DOM.
Part 4 connects all of that. The false breakout isn't a mystery — it's a predictable, repeatable mechanism that makes perfect sense once you understand what institutions actually need. They need liquidity. The sweep creates it. And if you know how to watch for it, you can stop being the liquidity — and start reading it instead.
In Part 5, we'll flip the script: what does a real breakout look like, and how do you tell the difference in the moment?
Sincerely,
Marco
---
Scalper's Paradise:
- Part 1: Scalper's Paradise:
- Part 2: Scalper's Paradise:
- Part 3: Scalper's Paradise:
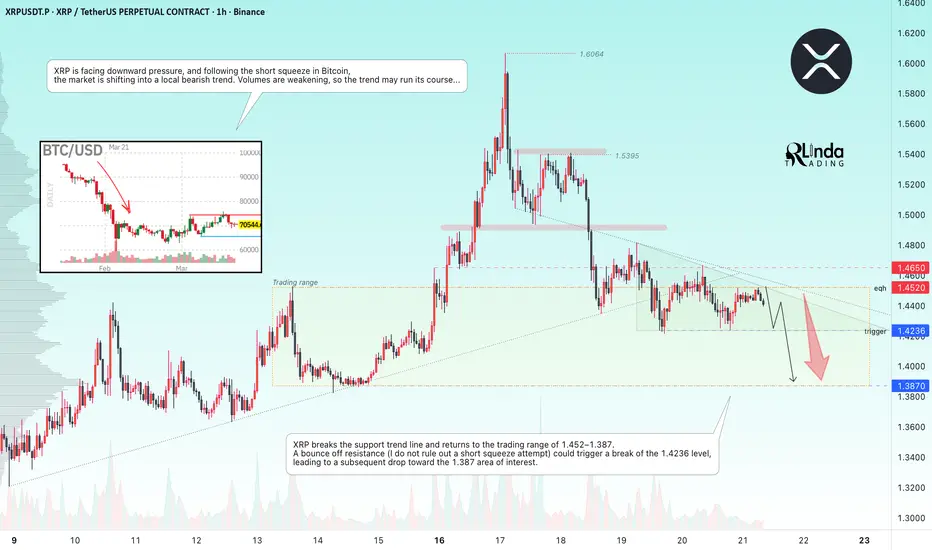
XRPUSDT - A break in the uptrend. Are we heading toward 1.380?BINANCE:XRPUSDT has broken through the uptrend support and is consolidating below 1.450, indicating that the market is poised to head toward support. Crypto winter continues...
XRP is facing downward pressure, and following a short squeeze in Bitcoin, the market is shifting into a local bearish trend.
Volumes are weakening, so the trend may run its course...
XRP breaks the support trend line and returns to the trading range of 1.452–1.387. A bounce off resistance (I do not rule out a short squeeze attempt) could trigger a break of the 1.4236 level, leading to a subsequent drop toward the 1.387 zone of interest
Resistance levels: 1.452, 1.465
Support levels: 1.4236, 1.387
A bounce off the 1.452 resistance zone confirms a trend break and relatively bearish sentiment. The price may test 1.4236 before breaking through and falling further to the 1.387 area of interest.
Best regards, R. Linda!
ENS is following a bearish structure (2H)We have a bearish CH after the formation of a swing high (SWH), followed by a well-respected bearish structure with multiple bearish BOS.
A large liquidity pool has formed below the current price for some time, and it is expected to be taken soon, leading to further downside.
We are looking for sell/short positions in the supply zone using a DCA approach.
Targets are marked on the chart.
A daily candle close above the invalidation level will invalidate this analysis.
If you would like us to analyze a coin or altcoin for you, first like this post, then comment the name of your altcoin below.
What is your opinion about ENS?

SPY:A mostly fundamental discussionHey everyone,
Here are my thoughts on SPY.
Mostly focusing on the significance of the fundamentals currently.
The article I show with the EMA stats is here:
And I forgot to share the weekly forecast which is here:
Thanks for watching and safe trades everyone!

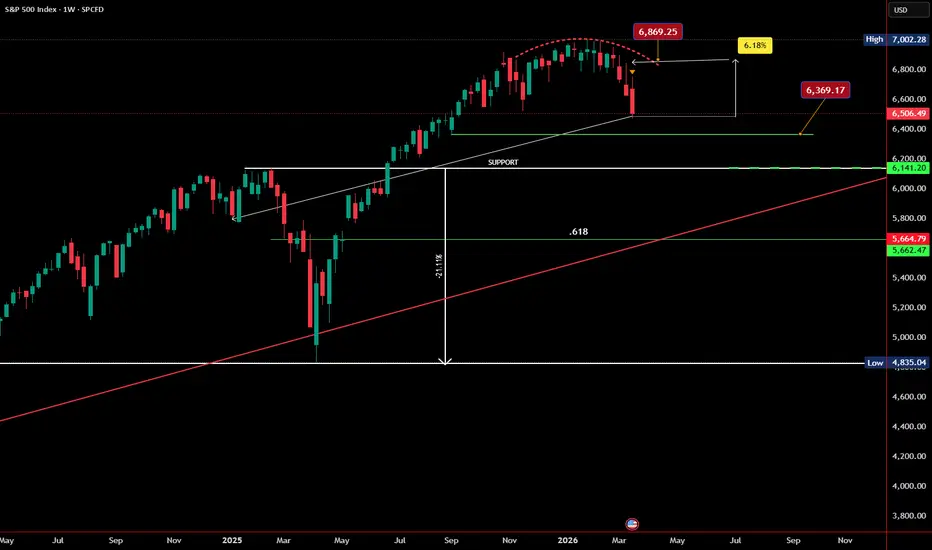
S&P 500 Weekly Outlook - Level Decides Everything March 23, 2026Looking at the weekly chart of the S&P 500, the market has now clearly rejected from the highs near the 6,800–7,000 region, and momentum is starting to roll over.
What stands out is how closely this structure resembles the move from January 6, 2025 when price pulled back into support before continuing higher. But this time, the market is at a much more extended level, and the reaction here will matter far more.
Right now, everything comes down to one level:
We need to close this week above 6,869.25 for the reversal to be bullish.
That level is no longer just resistance it’s the line that separates continuation from a deeper correction. If price can reclaim it with strength, this breakdown gets invalidated, shorts get trapped, and the market likely pushes toward new highs.
But if price continues to trade below it, the rejection we’re seeing now starts to look like the beginning of something bigger. In that case, a move into the 6,300–6,400 region becomes likely, with the major level at 6,141 acting as the last line of defense before a deeper pullback toward the 5,600–5,800 zone.
We’ve seen this setup before a pullback that led to continuation.
But this time, the market has to prove it.
Fail here, and this isn’t just a dip it’s the start of a larger unwind.
DOTUSDT is poised to reach 1,400 during the dump phasePressure is building on the 1.493 support level. A descending triangle is forming during the “dump” phase. A close below this key level could trigger a sell-off toward 1.400.
Volume is building on the bears' side, buyer strength is waning, and the bulls may not be able to hold the 1.493 support level on their own. The 1.493–1.407 range is quite loose, and the decline could be rapid.
Scenario: A break below the 1.493 support level could be accompanied by a sell-off toward the target of 1.407

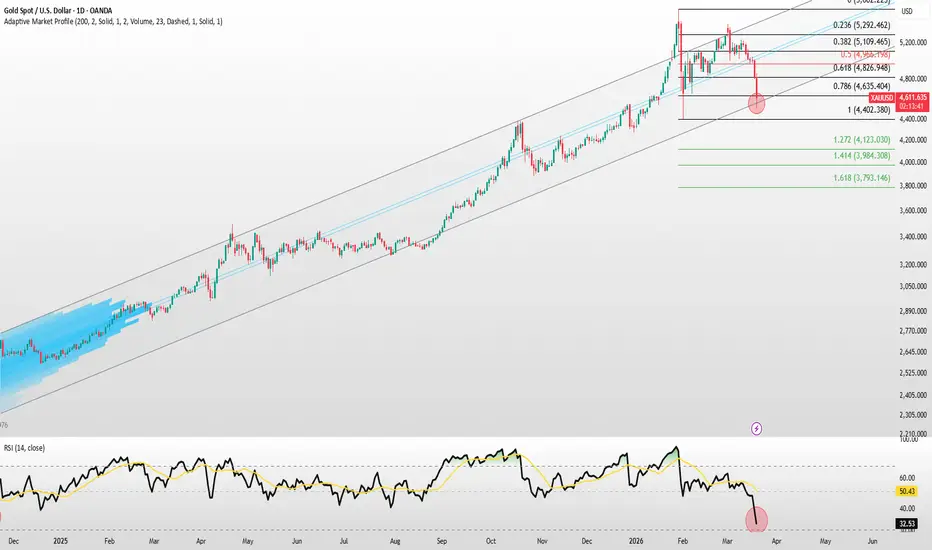
Gold Is Testing the Bottom of a 16-Month Rising Trend!Gold is currently testing the lower boundary of the rising trend channel that has been in place since November 2024.
Trading approximately 18% below its all-time high, momentum in gold is now at its lowest level since October 2023. When we check momentum through the RSI, it sits at 32.39 on the daily timeframe — the weakest reading in the last 2.5 years.
Technical Levels
Short-term pivot: 4,966. Why does this level matter? The SMA50, which I use for short-term trend tracking, sits right at this level — and the Fibonacci 0.5 retracement lands in the same zone. FRVP VAL is also in close proximity. In short, multiple metrics are pointing to the same price.
On the downside, I'm closely watching 4,500 — a level that carries both technical significance as the rising trend floor and psychological weight. As long as we don't see two consecutive daily or weekly closes below this level, there is no major structural threat. In a black swan scenario, however, the long-term Fibonacci support at 4,123 would become the area of maximum pain for gold investors.
Conclusion
In the current geopolitical environment, gold remains the locomotive of the markets — yes, all of them.
If gold holds the 4,500–4,600 band and begins to recover strength, a test of 4,966 becomes possible. A daily close above that level would bring the rising trend back into the conversation. On the other hand, consecutive closes below 4,500 could open the door down to the 4,100 region.
Thank you for reading — feel free to like and share if you found this useful.