BITCOIN – THE REAL REASON BEHIND THE FALLWhen I started trading someone told me something I’ll never forget: “If you can predict tomorrow’s newspaper headline, you understand the market.”
He didn’t mean I should chase news. He meant I should read structure so well that I know what kind of headline the market is already writing, before the mass even see it.
And now, looking around online, I see the complete opposite. Everywhere you look, there’s another “confluencer” talking about crypto with big words and zero understanding.
People selling dreams, memberships, and indicators, while they don’t even know what open interest or CVD means.
I’m not here to sell anything. I’m here to help people actually learn how to read data and see through the noise. Because what most of these so-called experts call “analysis” is just emotional guessing wrapped in confidence.
What I called and what happened
Last week I posted my “Big Dump” thesis.
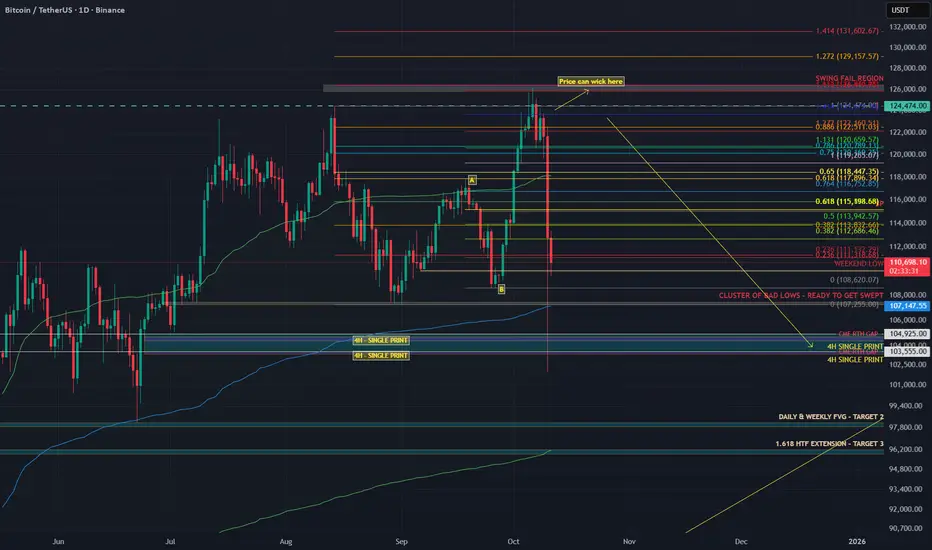
I said Bitcoin would swing fail above the highs, then drop into the 104K region. That is exactly what happened.
Price ran the sweep into 126K, trapped the late buyers, and dumped straight into 104K.
People blamed tariffs. The tariff headline was the spark. The fuel was crypto’s own positioning.
Why the structure was ready to snap
Before the crash, the data told the story clearly.
Stablecoin OI went from 257K to 285K contracts (+10.9%). That is new leveraged exposure.
Coin-margined OI dropped during the breakout, then rose again near the highs. Shorts were fading strength.
Spot CVD stayed flat to slightly negative. Real buyers were missing.
The long/short ratio fell from 2.05 to 1.02 even while price kept climbing.
That’s what distribution looks like. Buyers on leverage pushing price up while stronger hands sell into them. No real spot demand, just futures exposure.
You don’t need a macro event to fall. You only need a reason for those leveraged buyers to stop bidding. Think of it like a crowded elevator. Everyone keeps piling in as it moves up, feeling safe because it hasn’t stopped yet. But the moment one person hesitates, the weight shifts. When the next person panics, the whole thing drops.
That’s what happens when a market is driven by leverage instead of conviction. You don’t need bad news, you just need hesitation.
Look back at similar events.
In May 2021, funding rates were insane, perps overloaded, and spot volume thin. Elon Musk tweeted about Bitcoin’s energy use. That tweet didn’t cause the dump. It just made leveraged longs pause. The bids disappeared and the cascade started.
In August 2023, Evergrande headlines hit. Bitcoin was sitting at resistance with flat spot CVD and rising OI. Equities wobbled, crypto longs hesitated, and the structure collapsed within hours.
In March 2020, when COVID panic hit, Bitcoin had already been stretched thin. Funding was high, leverage was heavy, and liquidity was weak. The virus didn’t break the market, leverage did.
Leverage creates confidence until it doesn’t. Price doesn’t fall because people start selling. It falls because nobody steps in to buy. Headlines decide when the drop starts. Structure decides how far it goes.
Why 104K was my first target
I didn’t pick 104K out of thin air. That level was built on confluence.
1) AVWAP from the April 7 auction
That swing low kicked off with massive volume. When a move starts with that kind of participation, the anchored VWAP becomes a key reference for institutional flow. It represents the average cost of that whole auction, and when extended forward, it acts as a dynamic area where liquidity and algorithms interact.
That blue AVWAP line from April has been running right through the 104K region.
It’s not that price revisited that auction, it’s that the anchored VWAP from that event still marks the fair value area for that entire move.When price traded back down into that region, it met that same volume-weighted anchor, creating a major confluence zone that algos and larger players watch closely.
2) The June 22 breakout left an LVN
A new auction started on June 22 and pushed higher, leaving a Low Volume Node behind.
An LVN is a thin zone on the volume profile where the market moved quickly with little trade.
Markets often revisit these thin areas later to find balance or test unfinished business.
3) HTF Fibonacci cluster
Multiple higher timeframe Fibonacci retracements and extensions overlapped near the same 104K area. When several fib levels align with structure, that’s a strong confluence zone watched by both human traders and algorithms.
The 104K region was where the AVWAP line, LVN, and fib cluster all met. That’s not a random target. It’s a structurally defined area where liquidity concentrates and where markets tend to react sharply. And that’s exactly what happened.
The spark versus the structure
The tariff headline didn’t cause the drop. It triggered it.
The structure was already unstable. Leverage was maxed. Spot demand was flat. Funding was positive and rising. When the tariff news hit, traditional markets pulled back and crypto followed instantly. It wasn’t correlation, it was liquidity contagion.
Traders managing multiple books de-risk across assets when volatility spikes. That creates a gap in liquidity. When the bids vanish, the market falls into the first real pool of resting orders — in this case, the 104K zone.
You saw the same mechanics during the March 2020 crash and the 2021 deleverage. External shocks trigger internal liquidation cascades. That’s why saying “this had nothing to do with crypto is completely wrong.
This had everything to do with crypto. It’s like blaming the thunder for breaking a window when the glass was already cracked. Or saying the iceberg sank the Titanic when the captain was already steering through a sea of warnings.
Crypto was structurally weak. Leverage was stretched, spot demand was gone, and funding was positive. When the headline hit, it didn’t cause the collapse. It just gave the market permission to do what it was already set up to do — unwind.
Crypto is built on leverage.
Perpetual futures dominate volume.
Stablecoin collateral drives exposure.
When external risk events change funding conditions or risk appetite, the crypto market reacts instantly because its structure is fragile by design.
Example:
When yields spike, the dollar strengthens and funding costs rise. Leveraged longs become more expensive to hold, so traders unwind positions.
When equities dump, cross-asset desks reduce risk globally, which pulls liquidity out of crypto perps too.
Intermarket correlation always matters. Macro sets the mood. But the speed and violence of crypto moves always come from leverage inside the system.
How you can spot it next time
Compare Spot CVD vs Stablecoin CVD. If stablecoin CVD rises while spot stays flat or negative, the rally is leverage-driven.
Track Open Interest vs Price. Both rising together usually means exposure is building. Confirm with spot flow.
Watch the Long/Short ratio. If it drops while price rises, shorts are entering and the move may be getting absorbed.
Anchor VWAPs to real pivots like swing lows, breakouts, or liquidation spikes. Those levels attract institutional flow.
Study Volume Profiles. LVNs are thin and often retested. HVNs are balance zones that attract price.
Map HTF fib clusters for confluence. Reactions are stronger when multiple timeframes agree.
Note single prints and thin brackets on TPO or volume profiles. These often act as magnets.
When these factors line up, you don’t need to predict headlines.
You’ll already most likely know which headline will break the market.
TLDR
The rally was leverage-driven: Stablecoin OI up 10.9%, Spot CVD flat, Long/Short ratio down from 2.05 to 1.02
The swing fail at 126K was the final liquidity grab
104K was the target due to AVWAP + LVN + HTF fib cluster
The tariff headline was the spark, not the cause
The crash was caused by leverage and missing spot demand
Crypto didn’t fall because of politics. It fell because the market was already begging for an excuse to reset.
The data showed it clearly weeks before the drop.
If this helped you see the market a little clearer or made you think differently about how price really moves, please leave a like and drop a reaction. It keeps me motivated to keep posting real analysis, not the copy-paste bullshit hype that floods your feed every day.
Check the Order Flow Data from 6 October here: ibb.co
Community ideas
Silver just hit a record high but a double‑top signals pullback!After a strong rally to new records spurred by safe-haven demand and new entrants, silver is now testing critical support levels near $47‑$48 amid the recent Gaza ceasefire news, forming a classic double‑top pattern that may turn into a long-term Cup & Handle that could place price action in a handle pattern for the years to come.
🔑 Key Drivers (Silver‑focused)
Technical breakout : Price breached $51, approaching the 161.8 % Fibonacci level at $47.50.
Double‑top formation : A clean double‑top suggests a near‑term correction could be on the way.
Support zone : The $47‑$48 area acts as the next major support; a break below could open the door to $45‑$46 levels.
Fibonacci retracement : The 61.8% retracement sits around $49.30, providing a potential bounce point before any deeper pullback.
Want the latest silver analyses, alerts on breakouts, and detailed chart breakdowns?
Subscribe, like, and hit the notification bell – then share in the comments your silver trade setup or questions!
This content is not directed to residents of the EU or UK. Any opinions, news, research, analyses, prices or other information contained on this website is provided as general market commentary and does not constitute investment advice. ThinkMarkets will not accept liability for any loss or damage including, without limitation, to any loss of profit which may arise directly or indirectly from use of or reliance on such information.

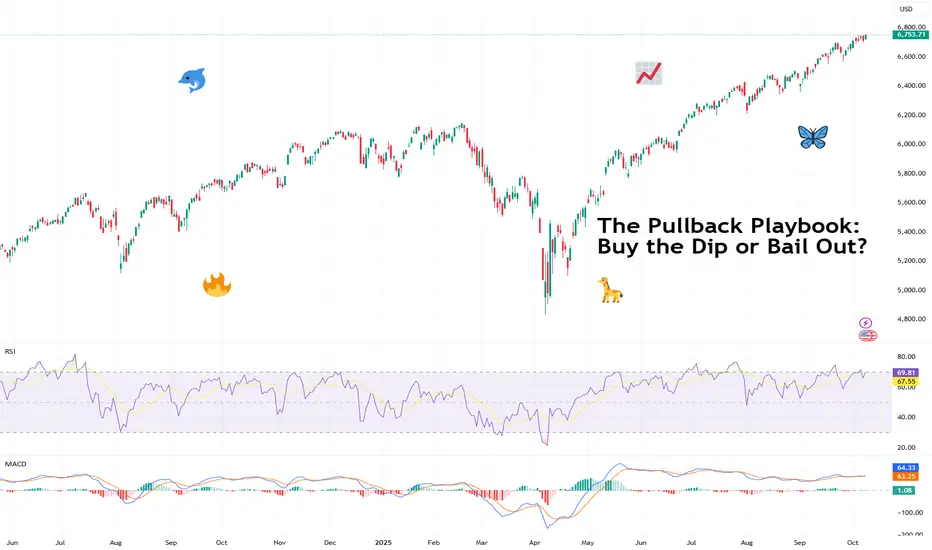
The Pullback Playbook: Buy the Dip or Bail Out?Markets don’t go up in straight lines. Even the strongest trends pause, retrace, and test your conviction.
These pauses are called pullbacks and they can either be healthy breathers before the next leg higher or the first cracks in a trend about to fall apart. The challenge for traders is knowing the difference.
📉 What Exactly Is a Pullback?
Think of a pullback as a temporary trend halt, not necessarily a crash. The price moves against the prevailing trend for a short period, testing support levels or shaking out weak hands before deciding where to go next. They’re common, normal, and — if managed right — they’re opportunities rather than threats.
But here’s where it gets tricky: not all pullbacks are trend halts. Some are the start of a flat-out reversal. And unless you’re comfortable holding through a potential nosedive, you need skills and tools to tell which is which.
🧐 Pullbacks vs. Trend Reversals
So how do know if you’re looking at a pullback or a trend reversal? The main differentiating factor is the length of the move. The healthy pullback looks orderly — modest in size, controlled in volume, and often retracing to familiar moving averages or support zones.
A healthy pullback might retrace 3-5% in a bull run, testing the 20- or 50-day moving average before bouncing higher.
A trend reversal barrels through multiple support levels in days, erasing weeks of gains. It’s often sharper, louder, and driven by news or panic.
Signs of a healthy pullback include:
• Price holding above key moving averages (20, 50-day. Some stretch to the 100-day but these tend to be rare — it’s more likely a trend reversal by then).
• Volume shrinking on the way down, then swelling on the rebound.
• Oscillators like RSI cooling off from overbought territory without plunging into oversold.
Trend reversals look more like:
• Breaks of multiple support levels in one go.
• Heavy, accelerating sell volume.
• Headlines driving panic: tariffs, central bank surprises, data releases from the Economic calendar , crypto exchange blowups, or noise coming from the Earnings calendar .
📊 Technical Tools to Judge the Dip
Charts can’t predict the future, but they can help you gauge probabilities. Pullbacks often line up with Fibonacci retracements, moving averages, or horizontal support and resistance levels.
• Moving Averages : If price pulls back to the 50-day and holds, that’s often a green light for trend continuation. If it slices straight through the 100-day? Not so healthy.
• Trendlines : Respecting the line = confidence. Breaking it = trouble.
• Volume : Low-volume pullbacks suggest sellers aren’t that committed. High-volume dumps are red flags.
None of these are crystal balls. But together, they give you a framework to avoid buying every dip.
🏄♂️ The Psychology of Buying the Dip
Why do traders love dips? Because everyone wants a discount. A pullback offers a chance to jump on a trend at a better price, and social media culture has turned “buy the dip” into a meme strategy. But memes don’t pay the bills when a dip turns into a crater.
The psychology works both ways:
• Optimists see dips as golden tickets.
• Pessimists see them as traps.
• Realists know both can be true, depending on the setup.
Being aware of your own bias — whether you lean toward buying too early or panicking too soon — is half the battle.
🔄 Asymmetric Risk and the Smart Bet
Here’s where it gets interesting. You don’t need to be right all the time if your risk-reward ratio is skewed in your favor. A tight stop and a wide target can mean one win cancels out several small losses.
Imagine risking 1% to potentially make 10%. Even if you’re wrong most of the time, the math can work. Pullbacks are prime territory for asymmetric setups: smart, thought-out entries, clear invalidation points (below support, trendline breaks), and attractive upside if the trend resumes.
This doesn’t mean chasing every dip. A pullback can wipe your position clean if you’ve placed your stop loss a little too close, a little too early.
⏳ Timing Matters
The biggest mistake with pullbacks is trying to catch the exact bottom. Traders love to brag about nailing the wick, but most who try end up paying for it. Smarter is to wait for confirmation — a bounce, a reversal candle, a break back above a short-term moving average.
Yes, you may miss the lowest price. But you’ll also miss buying into a freefall.
🌍 Pullbacks in Context
Context is everything. A dip in a raging bull market is not the same as a dip in a shaky sideways market. Macro matters too. If the Fed is cutting rates , risk assets might rebound fast. If tariffs, wars, or inflation are spiking, a pullback could turn into something bigger and deeper.
That’s why traders zoom out before diving in. Daily charts tell one story; weekly charts often tell the bigger tale.
🚀 Buy or Bail?
So, do you buy the dip or bail out? The honest answer is: it depends. A well-structured pullback in a strong uptrend with unchanged fundamentals is an opportunity.
A violent, volume-heavy selloff in a fragile market with cracked fundamentals is a warning.
The pullback dilemma isn’t just about charts but also about psychology. Can you hold your nerve when the market wobbles, or will you cut and run? Both choices can be right in the right context.
🎯 Final Takeaway
Pullbacks are part of every trend’s DNA. They test conviction, patience, and risk management. The key isn’t to predict every wiggle but to recognize whether price action is just cooling off or signaling something bigger.
Stay disciplined, respect your stops, and let the chart, not the noise, tell you when it’s time to stay in or step aside.
Off to you : Buy the dip? Or bail out? How do you respond to expected and unexpected market pauses? Let us know your coping mechanism in the comments!
The Market Doesn't Care About Your Thesis"The market can remain irrational longer than you can remain solvent." - John Maynard Keynes
A month ago, I wrote about the brutality of trading and introduced a concept I called the "trading pandemic" - when a chain of events clouds judgment, breaks confidence, and brings down even the best traders.
Life has a dark sense of humor. Shortly after publishing that post, I found myself living through exactly what I'd described.
The Storm That Found Me
Last week, I took significant losses. Not from ignorance. Not from recklessness. But from something far more dangerous: the very conviction that makes me a disciplined trader became the weight that pulled me under.
My thesis wasn't built on hopium or hunches. It was constructed on macro fundamentals:
The Setup:
IG:BITCOIN halving cycle suggesting the rally should fade by September
TVC:GOLD due for a correction as recession stress builds
SP:SPX primed for a rollover amid a macro death cross between inflation ECONOMICS:USINTR and unemployment ECONOMICS:USUR
The U.S. government shutdown on October 1st - echoing 2008 crisis conditions
And the blackout of key data reinforcing the uncertainty
Everything pointed to significant market stress. The fundamentals weren't just bearish - they were screaming. I waited patiently for the setup. I did the analysis. I had conviction backed by historical parallels and macro reality.
Then the market did what it does best: it ignored the script and wrote its own story.
When the Market Rewrites the Rules
Week two of October, IG:BITCOIN didn't just hold - it broke through ATH. TVC:GOLD continued its relentless climb. SP:SPX kept grinding higher with controlled strength that suggested continuation, not exhaustion.
Not with the kind of instability you'd expect during a government shutdown. Not with the fear you'd anticipate when economic data goes dark. But with the kind of structural strength that signals something bigger is happening beneath the surface.
What I started seeing instead was a completely different story unfolding:
Dedollarization accelerating faster than models predicted
Sovereigns accumulating TVC:GOLD at record pace
Institutional capital flooding IG:BITCOIN breaking cycle theory entirely
SP:SPX pricing in policy accommodation before stress even surfaced
Assets moving as if they're pricing in a paradigm shift, not a recession
The thesis wasn't wrong about stress in the system. It was wrong about how markets would price that stress.
Maybe this resolves later and my macro read proves correct on a longer timeframe. Maybe this controlled bull market is just an extended distribution before the real move down. Or maybe - and this is the hardest thing to accept - the market is telling me the playbook changed, and I'm still trading the old game.
I expected liquidation, but the market priced transformation.
The Paradox of Deep Conviction
Here's what last week reminded me: The same deep macro understanding that separates sophisticated traders from noise traders is also the double-edged sword that can cut you down.
You don't forget that conviction without risk management is dangerous. You know this. I know this. But when your thesis isn't just technical - when it's built on macro lens, death crosses, historical crisis parallels, cycle theories - conviction doesn't feel like opinion anymore. It feels like inevitability.
And that's when you start making exceptions:
"The 2008, and year 2000 parallels are undeniable - history doesn't lie"
"Government shutdown + data blackout = liquidity stress is coming"
"Dedollarization and sovereign gold buying confirms the global system is cracking"
" TVC:GOLD can’t keep climbing into a deflationary panic."
" Halving cycles has been the most accurate prediction of IG:BITCOIN for over a decade."
You're not abandoning your principles. You're just... trusting the depth of your research. This isn't a coin flip - you've done the macro work. You understand what's happening at a structural level.
But sometimes, conviction blinds you to what price is screaming: the rules changed.
When Fundamentals and Price Disagree
Here's the hardest pill to swallow: You can have an airtight macro thesis and still get destroyed if the market is playing a different game than the one you're analyzing.
I wasn't wrong to study the 2008 crisis parallels. I wasn't wrong to watch the unemployment-inflation death cross. I wasn't wrong to position for stress when the government shut down and economic data went dark. I wasn't even wrong about sovereign de-risking - that's actually happening.
But I was wrong about what markets would do with that information.
The markets didn’t ignore stress they front-ran the policy response.
Assets aren't climbing despite the fundamentals - they're climbing because of what those fundamentals imply about the future of fiat currencies, monetary policy, and the global financial system.
TVC:GOLD isn't rallying because everything's fine - it's rallying because sovereigns are losing faith in dollar hegemony
IG:BITCOIN isn't breaking halving theory because technicals matter less - it's breaking them because institutional adoption is rewriting the cycle dynamics
SP:SPX isn't ignoring the shutdown - it's pricing in that monetary policy remains accommodative no matter what happens
I was positioned for crisis.
The market was positioning for transformation.
Same data, entirely different interpretation and timeline...
When Knowing Isn't Enough
Nothing I learned this week was new. I got reminded.
Reminded that macro analysis tells you what might happen, not when or how markets will price it.
Reminded that historical parallels inform probabilities but don't dictate outcomes - especially when structural forces are shifting.
Reminded that when fundamentals say "crisis" but price action says "transformation," you don't fight price - you reassess your interpretation of the fundamentals.
Reminded that the market doesn't humble you because you're ignorant. It humbles you because you forgot that being right about the problem doesn't mean being right about the solution markets will price in.
The irony? The conviction that comes from deep macro research, from understanding sovereign behavior, from recognizing historical patterns - that same conviction blinds you to the moment you stop asking "What if markets are pricing this differently than 2008?" and start insisting "I know what's coming because I know what happened before."
The Trading Pandemic, Revisited
The trading pandemic isn’t when you’re lost.
It’s when you’re certain - certain enough to ignore what price is saying.
You stop asking “What if this time it’s different?” and start defending why it shouldn’t be.
You stop respecting liquidity dynamics and start fighting them.
And when you’re already drained personally or emotionally, that conviction turns to concrete. You don’t bend - you break.
The Double-Edged Sword
Here's the brutal truth: What makes us sophisticated traders - deep macro research, historical pattern recognition, fundamental analysis - is precisely what makes the storm hit us harder when markets reprice the narrative.
The trader who randomly bought IG:BITCOIN , TVC:GOLD , and SP:SPX in September and held? They're up significantly.
Not because they saw the shift - but because they had no thesis to be wrong about.
But when you lose after being this prepared - after reading every indicator, watching every pattern - it shakes more than confidence. It shakes identity.
Because if you can be this right on fundamentals and still be this wrong on timing, what does that say?
It says the market just handed you a gift wrapped in pain: the reminder that understanding the fundamentals doesn't guarantee understanding how markets will discount those fundamentals.
What the Market Reminded Me
Not taught. Not showed. Reminded.
That 2008 parallels matter less when the monetary system itself is being questioned
That a macro death cross doesn’t guarantee a crash - it can precede a reflationary melt-up.
That government shutdown + data blackout doesn't always trigger fear - it can mean "Fed will do whatever it takes"
That Bitcoin breaking halving cycles isn't a bug - it might be the feature of institutional adoption
That being unable to get updated economic data doesn't stop markets from pricing in what they expect that data to show
That when fundamentals and price diverge, price is telling you your interpretation is early
The Humbling Truth
Maybe my macro thesis resolves later - markets realize the stress, panic ensues, and the correction comes. Maybe this controlled bull market across IG:BITCOIN , CAPITALCOM:GOLD , and equities is just a longer distribution phase before reality hits.
Or maybe I'm watching the market tell me in real-time that we're not repricing a 2008-style crisis - we're repricing the end of dollar dominance, and I'm still trying to trade it like 2008.
Either way, it doesn't matter right now. What matters is that I was positioned for my version of the story, and the market is writing its own.
The government shut down October 1st. Data went dark. And instead of fear, markets priced in transformation. Instead of crisis, they priced in paradigm shift.
I was trading the problem. They were trading the solution.
Moving Forward
The losses hurt not because I didn’t know better - but because I did.
I knew that fundamentals don’t dictate timing.
I knew liquidity rules all.
But I trusted the thesis more than the tape.
Maybe it all reverses. Maybe it doesn't. But my job isn't to insist on my macro thesis - it's to respect what's happening right now and position accordingly, even when it contradicts everything my research suggests should happen.
The infinite game continues. The conviction that hurt me last week is the same conviction that's made me successful countless times before. I'm not trying to kill the macro analysis. I'm trying to keep it humble in the face of price action.
Final Word
The market only truly beats the trader who quits.
But it tests the trader who stays by reminding them, again and again, that mastery isn't having the right macro thesis. It's respecting price action even when - especially when - it contradicts every fundamental you've studied.
October 1st came. Government shut down. Data went dark. Death crosses formed. 2008 parallels aligned. Halving Cycle completed.
And yet, here we are - breaking every rule the old playbook taught us.
My thesis might still be right eventually. But "eventually" doesn't pay the bills, and it certainly doesn't save your account when you're positioned for a crisis and the market is pricing a transformation.
This week was expensive tuition for a lesson I already knew:
The market can remain irrational - or perhaps perfectly rational in a way you don't yet understand - longer than you can remain solvent betting against it.
Rise, remember, and keep playing the infinite game. 💚

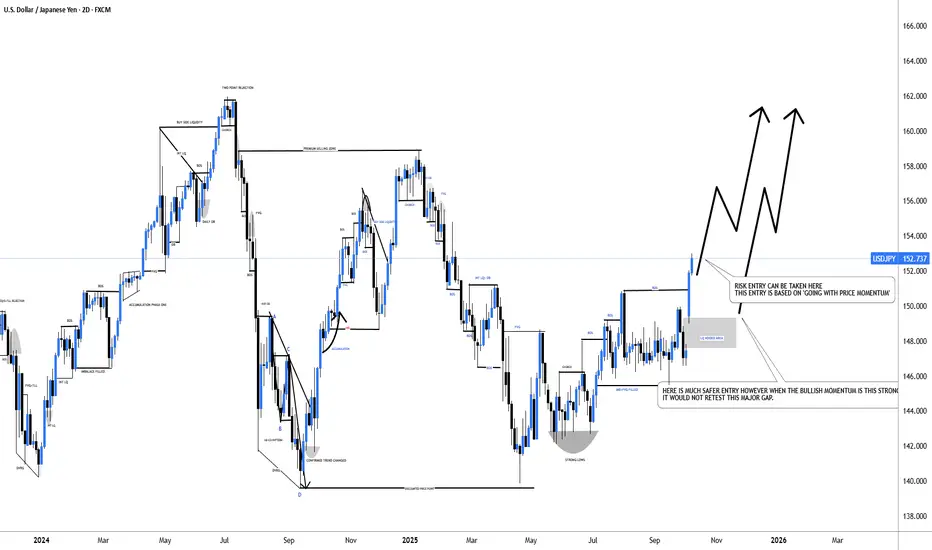
#USDJPY: From +1100 Pips To +1350 Pips A Possible Swing BuyDear Traders,
I hope you’re all having a great trading week!
The USDJPY is currently trading in a 152 price range and is experiencing extreme bullish momentum. The price is rallying without making any corrections, primarily due to the collapse of the Yen. We may see it fall further below. Given this market condition, it’s much riskier to trade with USDJPY.
Here are two approaches you may consider:
1. Take the entry at the current trading price with an accurate stop loss while using a smaller timeframe.
2. Wait for the price to return to the liquidity gap area, where it’s expected to fill.
Good luck, and thank you for your support throughout.
We appreciate your support.
Team Setupsfx_
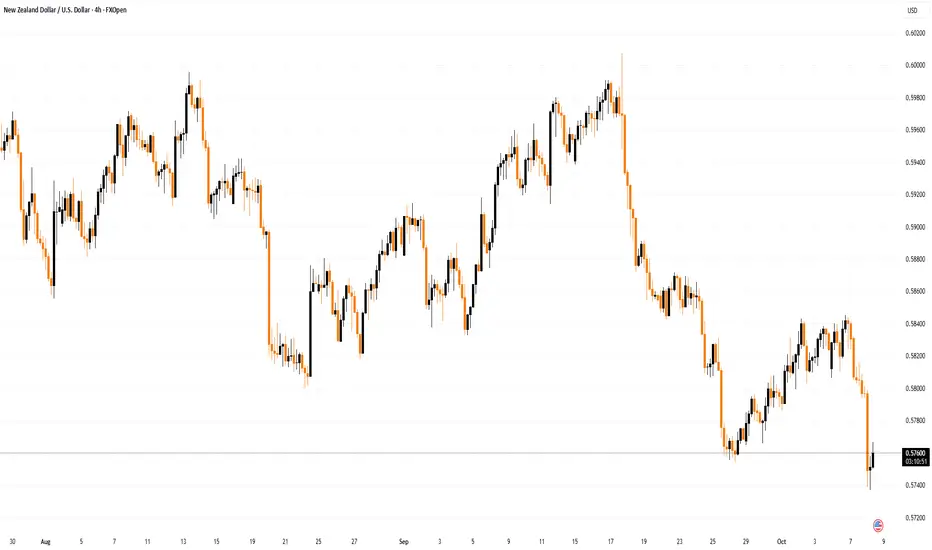
NZD/USD Rate Drops Sharply After Central Bank DecisionNZD/USD Rate Drops Sharply After Central Bank Decision
This morning, the Reserve Bank of New Zealand (RBNZ) cut its key interest rate. According to Forex Factory, the Official Cash Rate was reduced by 50 basis points from 3.0% to 2.5%, while most analysts had expected a smaller cut to 2.75%.
Moreover, the RBNZ signalled the prospect of further easing following a recent deterioration in economic data. The decisive move caught traders off guard and led to heightened volatility. As shown on the NZD/USD chart, the New Zealand dollar has fallen to its lowest level against the US dollar since mid-April.
The downward momentum has been reinforced by the strengthening of the US dollar — possibly as investors grow more cautious over a potential government shutdown, prompting them to move into cash.
Technical analysis of the NZD/USD chart
Movements in the kiwi’s exchange rate during the second half of 2025 have formed a descending channel on the chart. Notably, peak F:
→ only slightly exceeds the previous high D;
→ lies above the psychological 0.6000 level;
→ developed with a long upper wick, consistent with the Upthrust (UTAD) pattern described in Wyckoff methodology.
This appears to be a strategic false breakout above the lower-high structure, paving the way for a decline towards the autumn lows and a breakout below the corrective pattern (shown in blue).
From a bearish perspective:
→ the channel’s median line acts as resistance (as shown by the arrows);
→ today’s drop signals an imbalance favouring sellers, forming the basis for a Fair Value Gap resistance zone.
Meanwhile, bulls may hope the lower boundary of the channel once again acts as support in 2025, providing momentum for a rebound within the channel. For this scenario to play out, however, the news backdrop would need to shift. For now, the NZD/USD chart points to bearish dominance — with a potential move down towards the 0.5700 level.
This article represents the opinion of the Companies operating under the FXOpen brand only. It is not to be construed as an offer, solicitation, or recommendation with respect to products and services provided by the Companies operating under the FXOpen brand, nor is it to be considered financial advice.
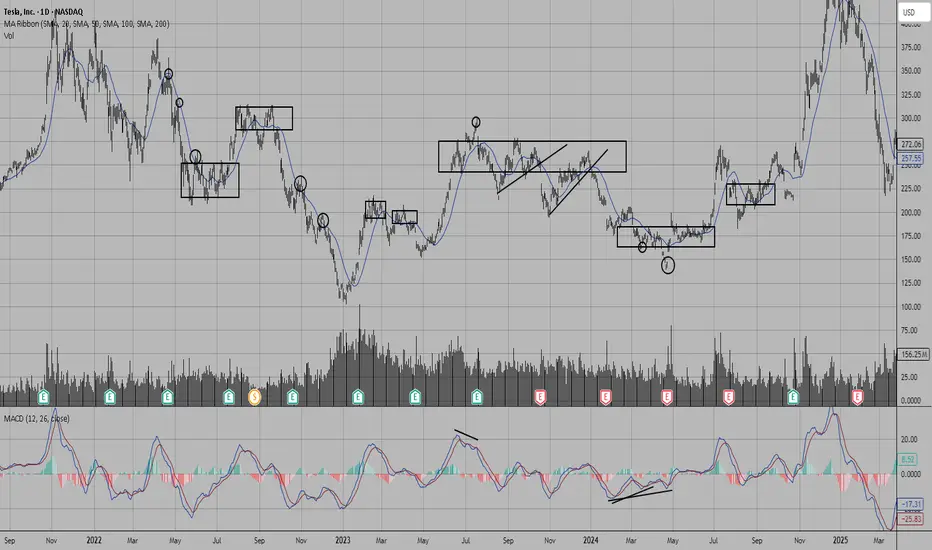
Netflix Is -11% Since June's All-Time High. What Its Chart SaysNetflix NASDAQ:NFLX has fallen more than 10% since hitting an all-time high in June, but the streaming giant is still beating the S&P 500 SP:SPX in the year-to-date, one-year and five-year periods. What does technical and fundamental analysis say is going on?
Let's take a look:
Netflix's Fundamental Analysis
NFLX has shed some 11% as of Tuesday afternoon since peaking at $1,341.15 intraday on June 30, easing especially over the four weeks despite little news.
The only recent negative catalyst came last week, when Citigroup analyst Jason Bazinet (rated at five stars out of a possible five by TipRanks) cut the stock's price target to $1,280 from a previous $1,295. Bazinet also reiterated Netflix's "Neutral" rating, which is considered a "hold-equivalent."
Still, the Citi analyst's $1,280 price target represents about a 7.5% move to the upside from where NFLX was trading at Tuesday afternoon.
Meanwhile, Wall Street expects Netflix to report Q3 results in some two weeks (on or about Oct. 21). The Street is looking for the firm to report $6.95 in adjusted earnings per share on about $11.5 billion of revenue.
If those numbers end up being accurate, that would compare favorably with the year-ago period, with a 28.7% gain from the $5.40 in adjusted EPS that NFLX reported in Q3 2024. Revenues would also have risen 17.3% from the $9.8 billion that Netflix saw a year earlier.
In fact, of the 33 sell-side analysts that I know of that cover Netflix, 27 have increased their earnings estimates since the current quarter began. Just five have cut their forecasts, while one estimate remains unchanged.
Netflix's Technical Analysis
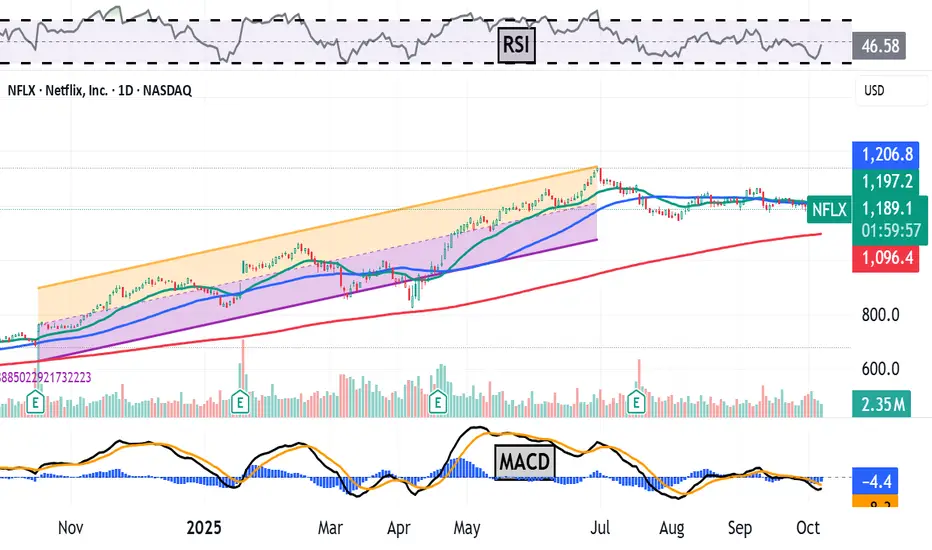
NFLX's one-year chart through Thursday afternoon was telling an interesting story:
Readers will see that the stock benefited from an upward sloping trend that stretched from Autumn 2024 into Summer 2025, as marked with orange and purple fields in the chart above.
This trend ended with NFLX peaking on June 30, with a new trend born the next day. The stock has generally pulled back since July 1 while creating a "falling-wedge" pattern, which is historically a sign of bullish reversal.
Netflix's upsides in the above pattern are the stock's 21-day Exponential Moving Average (or "EMA," marked with a green line) and its 50-day Simple Moving Average (or "SMA," denoted by a blue line). These two lines are running together, so I'll view them as a single pivot.
Now let's zoom in and look at Netflix's chart over just the past eight months:
I've added a "double-bottom" pattern to the above chart above using dotted lines. That's a second pattern of bullish reversal, and it exists inside of Netflix's falling wedge.
Granted, the stock's recent sell-off still has to find support around here. But if it does, NFLX will have just developed two simultaneous bullish patterns.
The double bottom would have a $1,268 pivot, which would be about $60 above the moving averages that we just mentioned. This pivot could produce considerably higher price targets for the stock.
That said, Netflix's other technical indicators above don't agree with such bullishness, or at least don't agree with it just yet.
For example, the stock's Relative Strength Index (the gray line at the chart's top) is relatively weak.
Similarly, Netflix's daily Moving Average Convergence Divergence indicator (or "MACD," marked with gold and black lines and blue bars at the chart's bottom) is close to neutral, as well as closer to bearish than bullish.
The 9-day EMA (the blue bars) is in negative territory, although not far from zero bound. Both the 12-day EMA (the black line) and 26-day EMA (the gold line) are also below zero, with the black line below the gold line. All three of these conditions are typically short- to medium-term bearish signals.
An Options Option
Options traders who want to get NFLX at a "discount" (and get paid to wait for it to potentially go higher) might consider a bull-put spread. This strategy is set up by selling a put while also buying a second put with a lower strike price.
Here's an example:
-- Sell (write) one Oct. 24 NFLX $1,140 put for about $45. This option could expire after Netflix reports earnings.
-- Buy one Oct. 24 NFLX $1,110 put for about $32.
Net Credit: $13
Traders in the above example would pay $1,140 a share for NFLX if forced to buy the stock due to assignment of the short put. However, their net basis would be $1,127 after deducting the net premium collected.
These traders also purchased some downside protection at $1,110 with the second put.
All in, that represents a maximum $30-per-share loss -- the $1,140 strike price on the first put minus the $1,110 strike price on the second.
However, the $13 net premium traders would collect on the entire bull-put spread would reduce the above strategy's maximum theoretical loss to $17 a share at expiration.
(Moomoo Technologies Inc. Markets Commentator Stephen "Sarge" Guilfoyle had no position in NFLX at the time of writing this column.)
This article discusses technical analysis, other approaches, including fundamental analysis, may offer very different views. The examples provided are for illustrative purposes only and are not intended to be reflective of the results you can expect to achieve. Specific security charts used are for illustrative purposes only and are not a recommendation, offer to sell, or a solicitation of an offer to buy any security. Past investment performance does not indicate or guarantee future success. Returns will vary, and all investments carry risks, including loss of principal. This content is also not a research report and is not intended to serve as the basis for any investment decision. The information contained in this article does not purport to be a complete description of the securities, markets, or developments referred to in this material. Moomoo and its affiliates make no representation or warranty as to the article's adequacy, completeness, accuracy or timeliness for any particular purpose of the above content. Furthermore, there is no guarantee that any statements, estimates, price targets, opinions or forecasts provided herein will prove to be correct.
The Analyst Ratings feature comes from TipRanks, an independent third party. The accuracy, completeness, or reliability cannot be guaranteed and should not be relied upon as a primary basis for any investment decision. The target prices are intended for informational purposes only, not recommendations, and are also not guarantees of future results.
Options trading is risky and not appropriate for everyone. Read the Options Disclosure Document ( j.moomoo.com ) before trading. Options are complex and you may quickly lose the entire investment. Supporting docs for any claims will be furnished upon request.
Options trading subject to eligibility requirements. Strategies available will depend on options level approved.
Maximum potential loss and profit for options are calculated based on the single leg or an entire multi-leg trade remaining intact until expiration with no option contracts being exercised or assigned. These figures do not account for a portion of a multi-leg strategy being changed or removed or the trader assuming a short or long position in the underlying stock at or before expiration. Therefore, it is possible to lose more than the theoretical max loss of a strategy.
Moomoo is a financial information and trading app offered by Moomoo Technologies Inc. In the U.S., investment products and services on Moomoo are offered by Moomoo Financial Inc., Member FINRA/SIPC.
TradingView is an independent third party not affiliated with Moomoo Financial Inc., Moomoo Technologies Inc., or its affiliates. Moomoo Financial Inc. and its affiliates do not endorse, represent or warrant the completeness and accuracy of the data and information available on the TradingView platform and are not responsible for any services provided by the third-party platform.
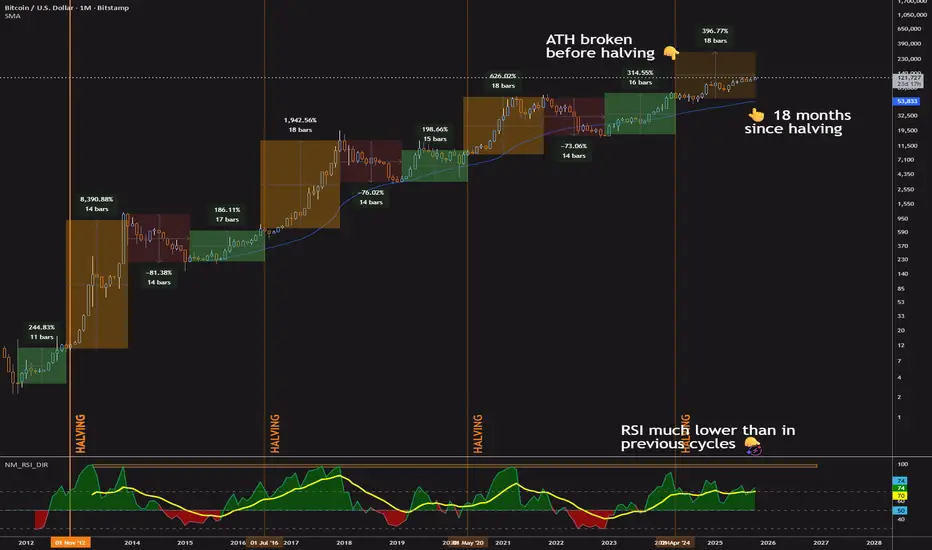
Is Bitcoin's 4-Year Cycle Over? Bitcoin’s 4-year cycle has been a go-to for traders, driven by halving events that spark price surges, sharp corrections, and recovery periods. But something’s off this time.
We’re 18 months into the post-2024 halving rally—hitting the historical peak for bull runs—yet there’s no sign of a crash, and the monthly RSI isn’t screaming overbought like in past cycles.
Instead, we’re seeing a slower, steadier climb that could keep going. The traditional cycle may be fading, and the shift from retail traders to institutional investors is the biggest driver.
❓ What Is Bitcoin’s 4-Year Cycle?
Bitcoin’s halving happens roughly every four years (or 210,000 blocks), cutting the reward miners get for adding new blocks in half. This reduces new bitcoin supply, often driving prices up if demand holds. The cycle typically has four stages:
Pre-Halving Rally: Prices rise in the months before the halving as anticipation builds.
Post-Halving Bull Run: After the halving, prices surge, often hitting new highs.
Bear Market: The rally fades, leading to a sharp correction.
Accumulation Phase: Prices stabilize at lower levels, setting up for the next cycle.
Here’s how these stages have unfolded in the past, also including the current cycle for comparison, with durations and price ranges (they are indicated on the chart):
📈 2012 Halving (November 2012):
Pre-Halving Rally: ~12 months (Nov 2011–Nov 2012, $2 to $12)
Post-Halving Bull Run: ~12 months (Nov 2012–Nov 2013, $12 to ~$1,150)
Bear Market: ~13 months (Dec 2013–Jan 2015, $1,150 to ~$170)
Accumulation Phase: ~15 months (Jan 2015–Apr 2016, ~$170–$450)
📈 2016 Halving (July 2016):
Pre-Halving Rally: ~10 months (Sep 2015–Jul 2016, $230 to $650)
Post-Halving Bull Run: ~17 months (Jul 2016–Dec 2017, $650 to ~$20,000)
Bear Market: ~12 months (Dec 2017–Dec 2018, $20,000 to ~$3,200)
Accumulation Phase: ~16 months (Dec 2018–Apr 2020, ~$3,200–$8,500)
📈 2020 Halving (May 2020):
Pre-Halving Rally: ~10 months (Jul 2019–May 2020, $4,000 to $8,700)
Post-Halving Bull Run: ~18 months (May 2020–Nov 2021, $8,700 to ~$69,000)
Bear Market: ~14 months (Nov 2021–Jan 2023, $69,000 to ~$16,500)
Accumulation Phase: ~15 months (Jan 2023–Apr 2024, ~$16,500–$60,000)
📈 2024 Halving (April 2024): Current cycle
Pre-Halving Rally: ~12 months (Apr 2023–Apr 2024, ~$26,000 to ~$73,000)
Post-Halving Bull Run: ~18 months (Apr 2024–Oct 2025, ~$73,000 to ~$90,000, ongoing)
Bear Market: nowhere to be seen
In the past, retail traders drove these cycles, fueled by hype on platforms like YouTube, X or Reddit. Now, institutions are reshaping the game.
ℹ️ Why the 4-Year Cycle May Be Over
We’re 18 months past the 2024 halving (April 2024–October 2025), matching the typical length of past bull runs. Yet, there’s no sign of a reversal. The monthly RSI, which hit 90+ at the peaks of previous cycles (2013, 2017, 2021), is only in the 60s–70s now, signaling controlled, gradual growth rather than a parabolic spike. This steady climb could continue, and here’s why the traditional cycle might be breaking down, with institutions leading the charge.
1️⃣ Institutions Are Driving the Market
Bitcoin used to be retail territory—everyday traders chasing hype on social media, buying into rallies, and selling in panic. Now, institutional investors like BlackRock, Fidelity, and MicroStrategy are pouring in billions. The U.S. spot Bitcoin ETFs launched in 2024 have amassed over $10 billion in assets by October 2025. Unlike retail traders, institutions don’t ride emotional waves. They treat Bitcoin as a long-term hedge or portfolio asset, creating steady demand.
This shift is a game-changer. A key difference this cycle? Bitcoin broke its previous all-time high (~$69,000 from 2021) before the 2024 halving, hitting ~$73,000 in March 2024—something that never happened in prior cycles, where new highs came post-halving. This early breakout, along with the 18-month rally without a crash and a moderate RSI, shows institutions are driving consistent buying, smoothing out the wild swings of past cycles. It’s like the market’s gone from a rollercoaster to a steady climb, and big money is the driving factor.
2️⃣ Halvings Have Less Impact
Early halvings slashed Bitcoin’s supply growth significantly—25% to 12% in 2012. The 2024 halving only dropped inflation from ~1.7% to ~0.85%. With ~19.7 million of 21 million coins already mined, the supply shock is weaker. Markets now price in halvings early, reducing the explosive surges of past cycles and miners have less BTC to sell, reducing impact on the market.
3️⃣ Macro Factors Are Taking Over
Bitcoin is increasingly tied to global markets. It fell in 2022 with stocks when the Fed raised rates and rallied in 2023–2024 as rate cuts seemed likely. Macro trends—interest rates, inflation, the dollar—now outweigh the halving’s influence. Institutions, focused on these factors, align Bitcoin’s price with broader financial markets, not its internal cycle. The Fed's announcement of further cuts, making money cheaper, point towards a further increase of BTC price.
4️⃣ Market Sentiment Has Matured
Retail FOMO used to cause massive pre-halving rallies, but traders are more disciplined now. The 2024 pre-halving rally was modest compared to past cycles, despite breaking the all-time high. Competition from altcoins and DeFi splits market focus. Institutions, with their data-driven approach, don’t chase hype, contributing to the steady growth we’re seeing.
5️⃣ On-Chain Data Shows a Shift
Models like Stock-to-Flow, once reliable, failed to predict 2024’s price action. Long-term holders are selling less, partly due to institutional custody, reducing sell pressure and muting bull run spikes. The moderate RSI and lack of a crash at the 18-month mark reflect a market driven by steady accumulation, not retail mania.
‼️ Traders: Bias can be dangerous
With the 4-year cycle potentially fading, caution is advised. Here’s how to adapt:
Track Macro Trends : Monitor Fed policy, inflation, and stock market moves. Use TradingView’s correlation tools to see how Bitcoin tracks with assets like the Nasdaq.
Use On-Chain Metrics : Check MVRV or Puell Multiple on TradingView to gauge market sentiment, independent of halving timelines.
Stay Flexible : Focus on shorter-term charts (daily, weekly) to catch trends, rather than waiting for cycle milestones.
Manage Risk : With less predictability, use tight stop-losses and smaller position sizes.
📃 So what's the conclusion?
Bitcoin’s 4-year cycle was a trader’s roadmap, but it’s losing its edge. We’re 18 months into the post-2024 halving rally, with no crash in sight and a monthly RSI signaling controlled growth that could persist.
Breaking the previous all-time high before the halving sets this cycle apart, driven by institutional demand. With weaker halvings, macro influences, and a more mature market, the old cycle may be history. In October 2025, Bitcoin is still going strong, but it’s moving to a new rhythm—driven by big money, not hype.
📢 What do you think?
Will Bitcoin’s cycles keep fading, or is the old pattern coming back? Share your thoughts in the comments!
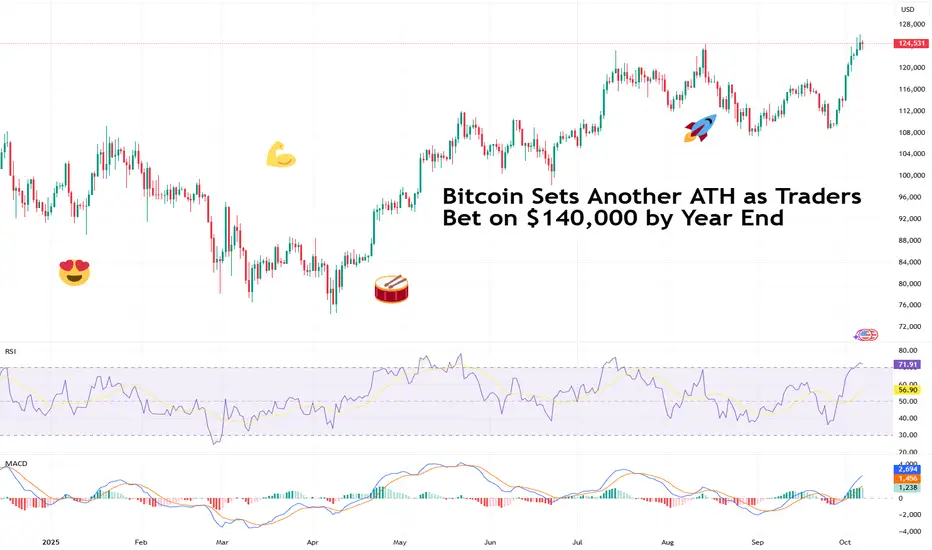
Bitcoin Sets Another ATH as Traders Bet on $140,000 by Year EndBlink and you’ll miss it. Bitcoin’s recent leg up caught lots of traders unprepared. After sinking below $110,000 few weeks back, the OG coin slingshotted to a fresh record high above $126,000 this week. Not a bad way to start October Uptober .
Now, traders are adding to bets that the price will crack $140,000 by year end. How realistic is that?
🌕 “Uptober” Strikes Again
October has a reputation in crypto lore and it’s living up to it.
Over the last 13 Octobers, Bitcoin BITSTAMP:BTCUSD has ended in the green 10 times. The pattern is set to continue as the coin rides a broader wave of optimism fueled by the Fed’s rate cuts, a messy US government shutdown, and the return of that dangerous four-letter abbreviation: FOMO.
But the real kicker? Spot Bitcoin ETFs are on fire.
US-listed Bitcoin ETFs kicked off the month with their second-best week ever, attracting $3.24 billion in net inflows — nearly matching their record of $3.38 billion set in November 2024. Are we… so back ?
💥 Options Traders Go Big: $140K or Bust
In the options market, optimism is loud and clear. Data from Deribit shows open interest piling up around the $140,000 strike for contracts expiring in December — meaning plenty of traders are betting we’ll see new highs just in time for the holiday season. (Not that easy to gift a BTC now, is it?)
At the same time, a few cautious traders are hedging with puts, just in case this turns into another one of those “too-fast, too-furious” rallies.
📈 You Get a Record and You Get a Record
It’s not just Bitcoin exploring new horizons. The S&P 500 SP:SPX and the Nasdaq Composite NASDAQ:IXIC both logged their 30-something record closes of 2025, powered by relentless AI strength ( some huge OpenAI deal ) and investors betting that rate cuts will stretch the bull run.
But also, gold bugs are turning into the Scrooge McDucks of the market, backstroking through piles of gold in impenetrable fortresses.
The shiny stuff OANDA:XAUUSD is up 55% year to date and hovering just under $4,000 per ounce, a milestone that would make even die-hard crypto bulls nod in respect.
Apparently, the market’s hot across the board.
🧠 Why Bitcoin’s Rally Makes Sense (Kind Of)
Underneath the euphoria, there’s some logic to this madness:
• Lower rates = cheaper money. When the Fed cuts, non-yielding assets like Bitcoin suddenly look more attractive.
• Inflation’s still sticky. Investors want something that can’t be printed at will. The US government shutdown only strengthened that flow of cash.
• Institutional influx is real. ETFs, family offices, and even corporate treasuries are allocating to Bitcoin BITSTAMP:BTCUSD , Ethereum BITSTAMP:ETHUSD , and Solana PURPLETRADING:SOLUSD.
At its current market cap of $2.5 trillion, Bitcoin is now bigger than Amazon NASDAQ:AMZN ($2.4 trillion), the world’s fifth-largest company .
🧭 The “Uptober” Mindset
Here’s where psychology comes in. After weeks of choppy sideways trading, boredom gave way to disbelief — then disbelief turned to excitement. Now? We’re entering the danger zone where conviction and euphoria start to blur.
Some veterans call this the “emotional compression” phase — when every dip feels like an entry and every green candle feels eternal. But cycles never die; they just rotate. Those who chase late often learn that momentum cuts both ways.
Still, momentum traders have history on their side. Every October since 2012 (barring 2018, 2014, and 2012), Bitcoin has delivered solid gains. It’s hard to argue with a pattern that reliable — until it breaks.
🤔 What Could Trip Up the Bulls
Even the most euphoric chart has risk baked in:
• Profit-taking. After a 100% gain over the past twelve months, short-term traders can decide to lock in profits fast.
• Macro shocks. One bad inflation print ECONOMICS:USCPI or a hawkish Fed comment could cool the mood.
• Overheated sentiment. When everyone in your barbershop agrees it’s going up, it usually doesn’t — at least not immediately.
The chart’s near-term support sits between $120,000–$122,000. Lose that, and a retest of $110,000 is possible. Hold it, and $140,000 becomes more than just a meme.
📢 $140K by Year-End: Dream or Data?
Statistically speaking, Bitcoin would need roughly a 4% monthly gain from here to hit $140,000 by December. Considering it’s already up over 100% year-to-date, that’s not outrageous.
To get there, the stars must stay aligned:
• ETF inflows keep building momentum.
• The Fed sticks to its dovish script.
• Stocks stay buoyant, giving traders room to take risk.
• No black swans, no rug pulls, no sudden panic tweets.
If all that holds, a single Bitcoin closing the year north of $140,000 isn’t fantasy. It’s just crypto doing what crypto does — defying logic, gravity, and your risk management plan.
👉 Off to you : Where do you see Bitcoin by end of year? Cast your predictions in the comment section!
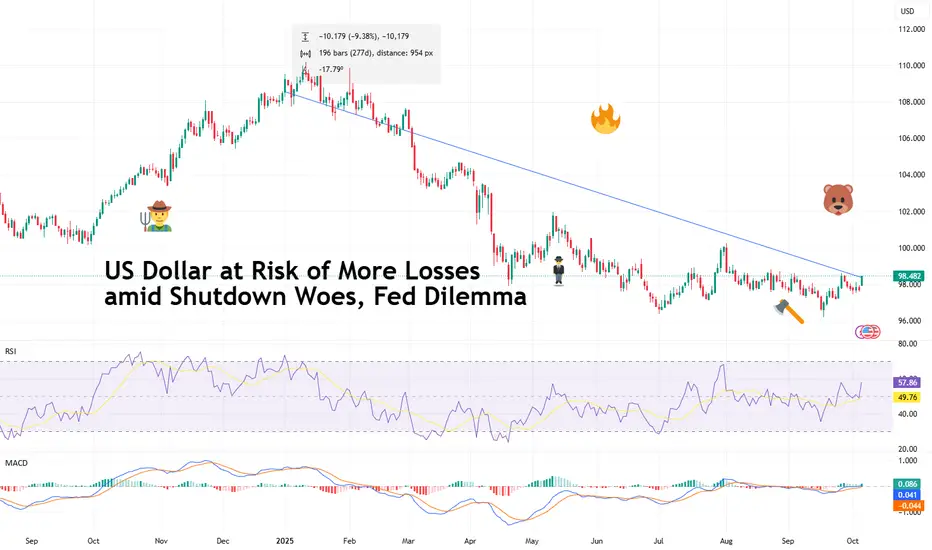
US Dollar at Risk of More Losses amid Shutdown Woes, Fed DilemmaThe US dollar TVC:DXY has been knocked by last week’s US government shutdown and the subsequent economic blackout. At the same time, the Federal Reserve can’t figure out what’s worse – inflation or job crunch.
After Congress failed to pass a funding bill, the government officially went dark at 12:01 a.m. Wednesday.
Traders, however, didn’t panic. Stocks climbed to fresh record highs , gold OANDA:XAUUSD popped, yields dipped — and the dollar slipped further into the red .
The greenback, usually the go-to safe haven during global turmoil, is acting like it forgot about that job description. With the Federal Reserve cornered between a slowing economy and stubborn inflation, plus fresh political uncertainty in D.C., the dollar’s shine is fading fast.
⚖️ When Politics and Policy Collide
Let’s start with the elephant in the room: the government shutdown. Historically, these dark D.C. moments shave about a tenth of a percentage point off GDP per week. In other words, the economy loses a few hairs — not a limb. But this one hits differently.
That’s because the Fed is already walking a tightrope. With unemployment creeping up ( 4.3% in August and lost jobs in June ) and inflation still running at 2.9% , the central bank has little margin for error.
The longer the shutdown drags on, the harder it becomes for policymakers to parse what’s real economic weakness and what’s just delayed government paychecks.
Investors, meanwhile, are pricing in a full quarter-point rate cut at the Fed’s next meeting and another one in December. The market is betting that Powell & Co. will prioritize saving jobs over fighting inflation. And that typically means one thing: a softer dollar.
📉 The Dollar’s Safe-Haven Cred Takes a Hit
Remember when the dollar used to rally whenever things got messy? Not this year. Despite trade tensions, geopolitical flare-ups, and now a full-blown government shutdown, the dollar has lost roughly 10% since January.
Part of that weakness stems from shifting interest-rate expectations. When the Fed signals it’s going to cut, yields on US assets drop — and so does the appeal of holding dollars.
Lower rates make borrowing cheaper, but they also mean less income for investors parking money in dollar-denominated bonds.
The euro took advantage, climbing above $1.17 as traders rotated out of the greenback.
Gold also basked in the dollar’s weakness, closing Friday at $3,886 an ounce — a fresh all-time closing high.
And just to rub salt in the wound, even cryptocurrencies have outperformed. Bitcoin BITSTAMP:BTCUSD , the digital rebel of finance, has gained about 35% this year and on Sunday hit a record high above $125,000 per coin.
🧩 Fed Dilemma: Jobs vs. Inflation
The Federal Reserve’s dual mandate is simple on paper: keep prices stable and employment high. But right now, the two goals are in open conflict.
On the one hand, the labor market is clearly slowing. August brought just 22,000 new jobs — the weakest print since early 2020. Revised data for June showed the economy actually lost 13,000 staffers net. Those aren’t the kinds of numbers that inspire confidence.
On the other side, inflation is still running above target. Core PCE, the Fed’s favorite measure, clocked in at 2.9% in August — unchanged from July but still nearly a full percentage point above the goal.
So what’s the play? Cut rates to support jobs and risk stoking inflation? Or hold firm, keep inflation contained, and risk a deeper slowdown? That’s the central banker’s version of “Would you rather.”
👀 The Fed’s Independence (and the Trump Factor)
There’s another layer of intrigue: politics. The Supreme Court just deferred a hearing on President Trump’s attempt to remove Fed Governor Lisa Cook — a Biden appointee — until January.
Cook can remain at the Fed in the meantime, but the episode has traders questioning just how independent the central bank really is under the new administration.
Fed Chair Jerome Powell, nearing the end of his term, has been caught between maintaining credibility and avoiding direct political confrontation. His latest move — a quarter-point rate cut in September — was meant to show responsiveness to data, not pressure. But optics matter, and the market is watching for signs of interference.
If investors start believing the Fed is bending to political will, confidence in US monetary policy could erode further — another potential strike against the dollar.
💡 What It Means for Traders
Here’s the breakdown:
• For FX traders: The dollar remains vulnerable, especially if the Fed confirms more cuts are on the way. Pairs like FX:EURUSD and FX:GBPUSD could see more upside. Meanwhile, FX:USDJPY might stay volatile as yen buyers return to their comfort zone.
• For gold bulls: Lower yields and a weaker dollar create the perfect storm. Gold looks strong despite charting new horizons, though traders should watch for a potential pullback if the Fed’s tone shifts.
• For equity investors: Rate cuts are generally bullish. Cheaper money means higher valuations — at least until inflation becomes a problem again.
• For crypto enthusiasts: A dovish Fed tends to favor risk assets, and Bitcoin could benefit as a hedge against both inflation and institutional confusion.
🧮 The Shutdown Math: Small Impact, Big Symbolism
Economists will tell you that a shutdown doesn’t tank the economy — but it does rattle sentiment. Each week of a federal closure trims GDP growth by about 0.1 percentage point. If this one matches the 35-day record from 2018–19 (during Trump’s first term), we’re looking at a 0.5% haircut. Manageable, but not ideal when the economy’s already wobbling.
More concerning is what a prolonged shutdown means for data flow. If key reports like nonfarm payrolls ECONOMICS:USNFP or CPI ECONOMICS:USCPI get delayed, the Fed will be in the dark heading into its next meeting — and that’s when mistakes happen.
Markets hate uncertainty, and uncertainty is the shutdown’s main export.
🧭 The Road Ahead
The dollar’s trajectory from here depends on whether the Fed can strike the right balance. If Powell emphasizes employment and doubles down on cuts, you may expect the greenback to weaken further. But if inflation surprises to the upside, markets could quickly reverse their dovish bets.
Make sure to keep an eye on the Economic calendar . September’s inflation hits October 15 and the Fed’s meeting is on deck for October 28-29.
Off to you : Where do you see the dollar by year end? Share your thoughts in the comment section!
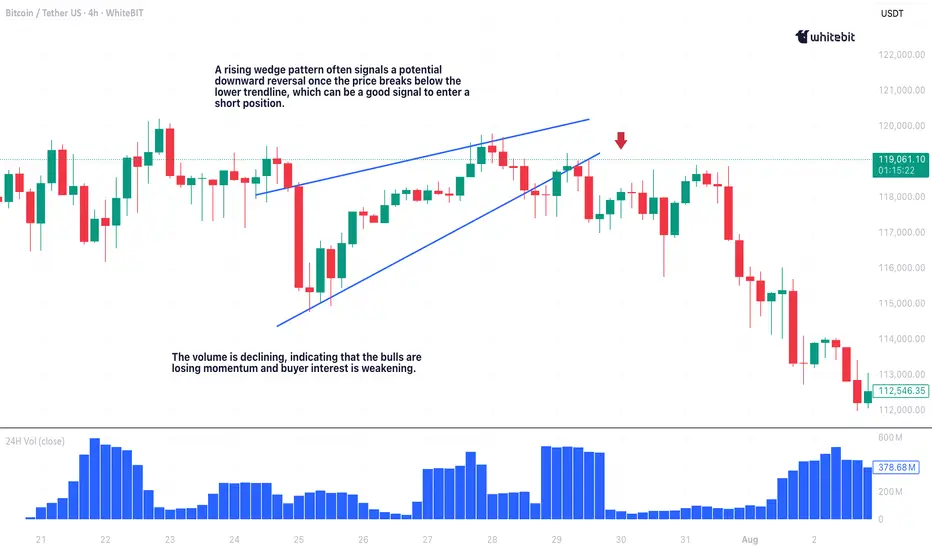
What’s a Wedge Pattern?What's up traders! 👋
Wedge patterns are a powerful tool in technical analysis that can give you a heads-up about potential price moves. Whether you’re spotting a falling wedge or a rising wedge, these formations can reveal key signals about market direction.
What’s a Wedge Pattern?
A wedge pattern forms when price moves between two converging trendlines, creating a shape resembling a triangle. These patterns usually appear when the market is slowing down or consolidating before making a bigger move. Wedges can slope upwards or downwards, and the key difference lies in whether the trendlines are converging in an uptrend (rising wedge) or a downtrend (falling wedge).
Falling Wedge Pattern: Bullish Reversal 📈
The falling wedge pattern is a bullish reversal signal. This formation occurs when price moves between two downward-sloping trendlines, creating a series of lower highs and lower lows. The downward momentum weakens as the trendlines converge, indicating that sellers are losing strength, which sets up the potential for a bullish breakout.
How to Trade the Falling Wedge
Entry: Wait for the price to break above the upper trendline. This is your signal to enter long.
Target: Measure the height of the wedge at its widest point and project it upwards from the breakout point.
Stop Loss: Place it just below the most recent swing low to protect your position if the breakout doesn’t happen.
The chart illustrates a falling wedge pattern on the Bitcoin / Tether US pair with a 1-hour timeframe. Price action is contained within two converging downward-sloping trendlines, suggesting weakening bearish momentum. The breakout above the upper trendline signals a bullish reversal, and the subsequent uptick in price confirms the shift in momentum.
In rare cases, a breakout failure can lead to a bearish falling wedge pattern, but this scenario is less common. Keep an eye on the price action for signs of continued upward momentum.
Rising Wedge Pattern: Bearish Reversal 📉
The rising wedge pattern is a bearish reversal signal. This formation happens when price moves between two upward-sloping trendlines, creating higher highs and higher lows. The rising wedge indicates weakening buying pressure and a potential reversal to the downside.
How to Trade the Rising Wedge
Entry: Enter a short position once the price breaks below the lower trendline.
Target: Measure the height of the wedge and project it downward from the breakout point.
Stop Loss: Set it just above the most recent swing high to protect your trade.
Wedge Chart Pattern Trading: Key Tips ⚡
Context is everything when trading wedge patterns. If a bullish wedge pattern appears in an uptrend, it’s more likely to break to the upside. If a bearish wedge shows up in a downtrend, expect a breakdown.
Here are a few quick tips to improve your wedge trading pattern game:
Trendlines are key: Ensure your trendlines are drawn accurately. Properly drawn trendlines lead to better trades.
Breakout confirmation: Confirm breakouts with increased volume and, ideally, by checking for confluence with other indicators like RSI or MACD. A breakout without volume is often a false signal.
Risk management: Always use a stop loss to protect your capital.
Use other indicators: Wedge patterns work well with additional tools such as RSI, moving averages, or MACD. The more confluence, the better!
Final Thoughts 🏁
Wedge patterns, whether it’s the falling wedge pattern signaling a bullish reversal or the rising wedge pattern trading indicating bearish pressure, are some of the most reliable chart formations out there. But remember: no setup is perfect, so always use a stop loss and never rely on a single indicator.
With practice, you’ll get better at spotting these setups and timing your entries and exits like a pro. Happy trading, and may the charts be in your favor! 💰📊
SMA 20: The most used, simple, and useful indicatorThe 20-period Simple Moving Average ( SMA 20 ) is easy to calculate and widely used, though often undervalued by traders eager for novelty. Its presence is notable in popular technical indicators like Bollinger Bands and Donchian Channels. Even the most purist price action traders include it on their charts, valuing its ability to identify trends and key support and resistance levels. Today, I want to explore the practical uses traders can derive from this versatile indicator.
Behavioral Patterns
Technical Analysis emerged from the detection and study of repetitive patterns or phenomena. These patterns are intrinsically tied to investor psychology, and their influence on decision-making is fundamental.
Repetitive patterns around an SMA 20 typically indicate that a trend has strength and stability, attracting investors and paving the way for highly effective systems or methodologies. One of my favorites involves identifying entry points in strong trends that have clearly respected the SMA 20.
Figures 1 and 2 illustrate this type of approach:
Figure 1:
Figure 2:
Price Overextensions
A price overextension in trading refers to an extreme price movement that significantly deviates from its average or reference level. This phenomenon often indicates that the price has moved too far, too fast in one direction (bullish or bearish) over a short period, suggesting a potential reversal or correction.
The SMA 20 is extremely useful for visually detecting these phenomena. Moreover, when trading in high-volatility contexts like overextensions, the SMA 20 can serve as a safe exit zone.
In Figure 3, you can observe how the price extends twice, significantly diverging from the SMA 20. The first overextension wouldn’t have been sufficient for an entry, but the second overextension generated a clear bearish divergence, which, combined with price action, would have validated a short entry.
The SMA 20 is a discreet target for taking profits without excessive exposure. This leverages a widely applied statistical concept in markets: mean reversion.
Figure 3:
Breakout Trading
Breakout trading involves entering the market when an asset’s price breaks through a key support or resistance level, with the expectation that the movement will continue in the breakout direction.
A price action phenomenon that significantly increases the likelihood of a successful breakout is pre-breakout tension , a state of compressed supply and demand characterized by a narrow range, low volatility, and order accumulation at key levels.
The SMA 20 is extremely useful for clearly identifying the dominance between buying and selling forces, as well as visually highlighting pre-breakout tension.
In Figure 4, I use a 20-period Exponential Moving Average (EMA 20) to increase sensitivity to the indicator’s changes.
Notice how the EMA 20 seems to compress the price against the range’s boundaries, as if trying to push it out.
Figure 4:
Retest Patterns
A retest occurs when, after breaking a significant support or resistance, opposing forces push back to test the strength of the prior level.
In Figure 5, you can see how, after a bearish breakout from an exhaustion pattern, bulls attack strongly but encounter resistance at what was previously a breached support. An SMA 20 aligned with this zone increases the level’s robustness, which is defended by sellers who see an excellent profit opportunity.
Figure 5:
Figure 6 shows an opposite example.
Figure 6:
Conclusions
With this brief overview, I aim to demonstrate that it’s not necessary to rely on novel or complex technical indicators to make sound market decisions. In Technical Analysis, simplicity, combined with deep understanding, often yields significant results.
Final Note
If you’d like to take a look at my analysis record, you can find my profile in Spanish, where I transparently share well-defined market entries. Send your good vibes if you enjoyed this article, and may God bless you all.
AMP Futures | Introducing Table ViewIn this idea we will demonstrate how to access the new Table view feature using TradingView.

Retro Editors' picks 2024Closing our retro EP selection , we present to you the last collection of additional scripts that have earned a spot in our Editors' picks, in this case from 2024.
These retrospective selections reflect our continued commitment to honoring outstanding contributions in our community, regardless of when they were published. To the authors of these highlighted scripts: our sincere thanks, on behalf of all TradingViewers. Congrats!
Statistics • Chi Square • P-value • Significance - fikira
Adaptive Trend Classification: Moving Averages - InvestorUnknown
analytics_tables (library) - jason5480
Tick CVD - KioseffTrading
Simple Decesion Matrix Classification Algorithm - Steversteves
RiskMetrics (library) - TradingView
Over the last four months, we shared retro Editors' picks for subsequent years:
May: retro EPs for 2020
June: retro EPs for 2021
July: retro EPs for 2022
August: retro EPs for 2023
They are visible in the Editors' picks feed .
█ What are Editors' picks ?
The Editors' picks showcase the best open-source script publications selected by our PineCoders team. Many of these scripts are original and only available on TradingView. These picks are not recommendations to buy or sell anything or use a specific indicator. We aim to highlight the most interesting publications to encourage learning and sharing in our community.
Any open-source script publication in the Community Scripts can be picked if it is original, provides good potential value to traders, includes a helpful description, and complies with the House Rules.
— The PineCoders team

SILVER (XAG/USD): One More Bullish Wave is Coming?!⚠️ SILVER appears to be confined within a horizontal range, as observed on the 4-hour chart. The price is currently nearing the upper limit of this range.
Given the prevailing strong bullish trend, there is a considerable likelihood of a continued upward movement.
A breakout and a 4-hour candle closing above the indicated resistance level would serve as a dependable confirmation.
The subsequent objective for buyers is anticipated to be 49.00.
Conversely, the market might persist in its consolidation phase, trading within the established range.

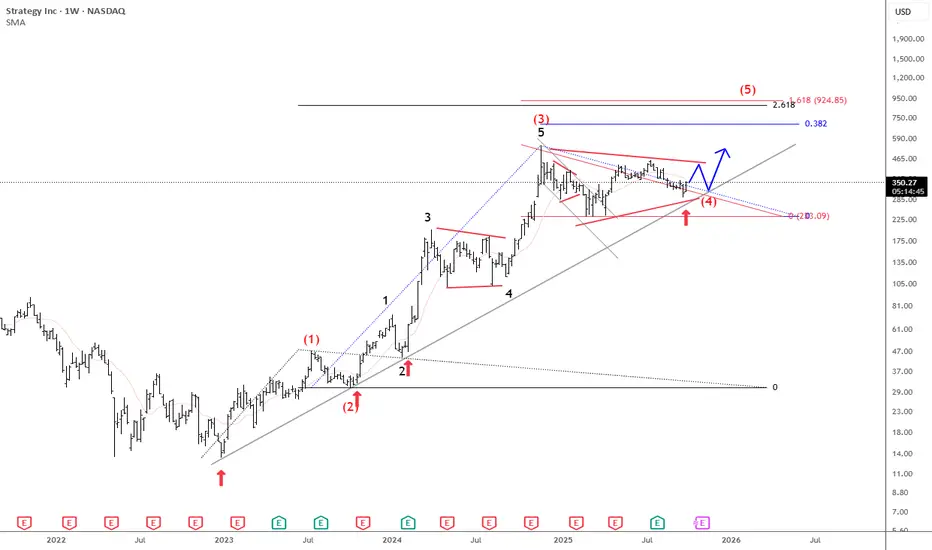
Microstrategy Is Still Pointing Higher For The Final 5th WaveMicrostrategy is a US business intelligence and software company, but it has become best known for its aggressive Bitcoin strategy. Under co-founder Michael Saylor, the company shifted from focusing mainly on software to also using Bitcoin as its primary treasury reserve asset.
Since 2020, MicroStrategy has been steadily buying Bitcoin, often using debt or equity raises to finance purchases. Their strategy is based on the belief that Bitcoin is superior to holding cash, as it can act as a long-term store of value against inflation and currency debasement.
From an Elliott wave perspective, we see Microstrategy nicely holding above trendline connected from the 2022 lows, so it's still unfolding a five-wave bullish impulse. Currently, it's consolidating within a bullish triangle pattern in wave (4), and once it's fully finished, we can expect another and maybe final push to the upside for wave (5) this year before a higher degree correction and bear market shows up next year.
We also want to mention that even Bitcoin can be finishing a 3-year bullish cycle, which can end this year, but there's still some space for more gains along with the Microstrategy to complete the 5th wave of an impulse.
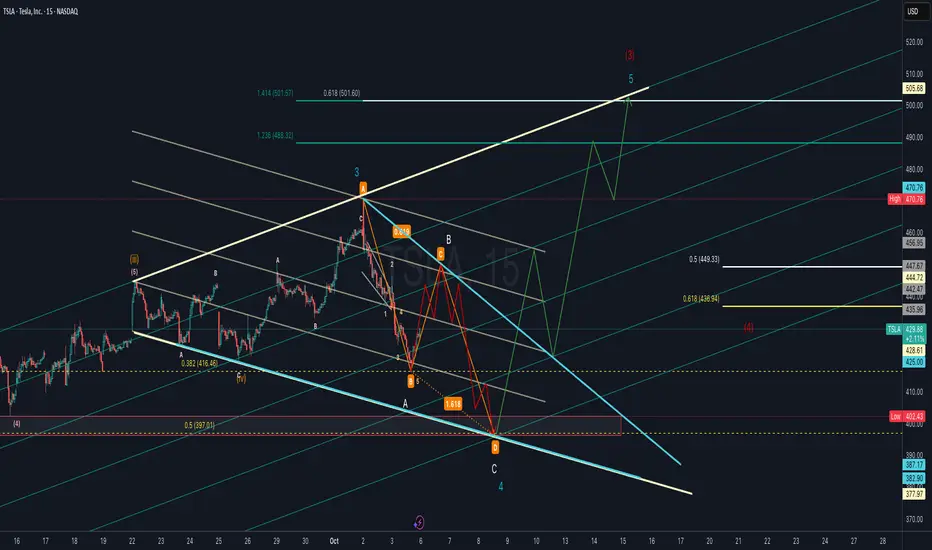
TSLA Elliott Wave Count with ABC Harmonic or Flat Corrective Tesla (TSLA) is forming a potential Wave 4 correction that aligns with an ABC harmonic structure. Price action suggests a possible deeper retracement into the 0.5–0.618 Fibonacci support zone (436–449 area) before resuming its larger uptrend.
If Wave 4 completes near the harmonic “D” zone (highlighted support box), the next leg higher could target the 1.236–1.414 Fibonacci extensions around 488–501, in line with Wave 5 projection.
Key levels to watch:
Support: 436.9 (0.618 retrace), 425 psychological, 397 strong support.
Resistance: 444.7, 470.8 (previous high), 501–505 (Wave 5 target).
Bullish scenario: Wave 4 completes soon, leading to a strong Wave 5 breakout towards 500+.
Bearish scenario: Breakdown below 425–397 support could invalidate the bullish count and extend correction lower.
The other possibility is that it is actually unfolding a flat correction in Wave 4 after completing Wave 3 near the recent high. The structure suggests price may continue to consolidate within the corrective channel before setting up the next impulse leg.
Bullish scenario: Flat correction completes, setting the stage for Wave 5 rally toward 490–505.
Bearish scenario: Breakdown below 397 invalidates the bullish count and signals deeper retracement.
NVDA Ready for Takeoff: $200 Target in Sight!
Based on the daily chart of NVIDIA (NVDA) on NASDAQ, here’s a breakdown:
🔎 Technical Analysis
Overall Trend
The stock is in a strong uptrend (rallying from around $120 to the current $186).
Higher lows are forming, and price is pressing against the 185–187 resistance zone, showing strong buying pressure.
Key Resistance
185–187 USD is a critical resistance zone tested multiple times.
Given the strong daily candle and volume, the probability of a breakout is high.
Short-Term Support
Uptrend line provides support around 176–178 USD.
Next key support sits near 170 USD.
🎯 Short-Term Outlook (1–4 Weeks)
Entry Trigger: After a confirmed breakout above $187
Target 1: $195
Target 2: $200
Stop-Loss: Close below $178
🌐 Long-Term Outlook (3–6 Months)
Sustained breakout above $187 could lead to a new bullish phase.
Target 1: $210
Target 2: $225
Stop-Loss: Break below $170
✅ Summary
NVIDIA is on the verge of breaking a major resistance level. A cautious entry above $187 may offer attractive upside potential. Risk of a false breakout exists, so stop-loss discipline is crucial.

Why Gen X Struggles with Crypto?Why does Gen X struggle with crypto?
Because they’re used to the stock market system, where ownership is recorded by a central registry and trades that are tied to a specific exchange.
In their world, you typically should buy through Nasdaq in this example and expect to sell through Nasdaq. But with Bitcoin or other cryptocurrencies, the blockchain itself is the registry, which means you can buy on one platform and sell on another freely. That shift—from centralized exchanges to decentralized settlement—is what makes crypto hard to grasp.
Mirco Bitcoin Futures and Options
Ticker: MBT
Minimum fluctuation:
$5.00 per bitcoin = $0.50 per contract
Disclaimer:
• What presented here is not a recommendation, please consult your licensed broker.
• Our mission is to create lateral thinking skills for every investor and trader, knowing when to take a calculated risk with market uncertainty and a bolder risk when opportunity arises.
CME Real-time Market Data help identify trading set-ups in real-time and express my market views. If you have futures in your trading portfolio, you can check out on CME Group data plans available that suit your trading needs www.tradingview.com

From Panic to Patience: The Psychology of Holding Through NoiseMarkets can be a noisy place. Screens flash, feeds scroll, and your cousin won’t stop texting you with urgent stock tips.
Yet if you zoom out, the difference between traders who burn out and traders who build wealth often comes down to one underrated skill: the ability to hold.
Not forever, of course, and not in ignorance. But to hold through the chatter, the dips, and the occasional headline apocalypse without throwing your strategy in the bin.
Let’s talk about how patience beats panic, and how you can keep your head when all about you are losing theirs .
📉 Why Panic Is Easy
When a chart turns red, our lizard brains scream louder than Jim Cramer on Nvidia NASDAQ:NVDA day. Humans are wired to avoid loss more than to seek gain — a concept called loss aversion. Especially during events from the Economic calendar or the Earnings calendar — nasty surprises can tilt you off kilter.
In trading terms, losing $1 hurts twice as much as making $1 feels good. That’s why you’ll often see people bailing at the first sign of trouble, only to watch prices reverse and rally without them.
But most “market crises” are just noise. If you zoom out, markets wobble, shake, and zig-zag before resuming their long-term trend. But panic-selling is a reflex, and unless you train yourself out of it, it’ll cost you over and over.
⏳ The Patience Premium
Patience in trading isn’t granted — it’s a superpower. Think of it as the compounding effect of discipline. When you resist the urge to sell into weakness or chase into strength, you give your trades time to play out according to your thesis instead of your emotions.
This doesn’t mean becoming a bagholder or marrying a bad stock. It means knowing the difference between short-term volatility and a true trend reversal . Spoiler: they’re not the same thing.
Warren Buffett (obligatory Buffett quote) once said the stock market is a device for transferring money from the impatient to the patient. In other words: the longer you can wait without flinching, the better your odds.
📰 The Problem with Market Noise
Every week brings a new villain: tariffs, inflation, “this time it’s different” chatter. But most of the time, these events don’t destroy trends — they just shake weak hands out of positions.
Think back to April’s tariff shock . Bitcoin BITSTAMP:BTCUSD dipped, stocks slid, headlines screamed.
Not even a week later, the Nasdaq Composite NASDAQ:IXIC vaulted higher by 12% for its best day in 24 years.
A few months later, markets not only recovered but ripped to new highs . The traders who panicked out at the bottom? They locked in losses. The ones who sat tight with a plan? They got paid.
🧘 Training the Trader’s Mind
You can’t mute the market, but you can build a mindset that handles it better. Start by reframing volatility. Instead of “Oh no, my position is doomed,” think “Let’s see if my thesis remains valid, or I’ll consider bailing.”
Other tips:
• Position sizing . If you’re too heavy in one trade, every tick feels like life or death. Keep sizes reasonable, and the noise gets quieter.
• Set rules in advance. Decide your stop-loss and target before you hit buy. That way, you’re not making panicked choices mid-storm.
• Practice detachment. It’s not your stock. It’s a trade. Don’t let ego glue you to every uptick.
These aren’t hacks; they’re habits. Build them, and noise turns from overwhelming to manageable.
🎢 The Cyclical Nature of Stress
Holding through noise isn’t just about one bad week — it’s about recognizing that markets move in cycles. Bull runs, corrections, consolidations… rinse, repeat.
When you’re in a correction, it feels endless. When you’re in a rally, it feels invincible. Neither is true. Both will pass. Your job isn’t to predict every twist, but to ride the broader wave without getting tossed by every splash.
This is why seasoned traders talk less about “calling tops” and more about sticking to process. Trends matter more than headlines.
💡 Patience ≠ Blind Holding
Let’s clear something up: patience doesn’t mean diamond-handing garbage stocks to zero. It means sticking to positions where your thesis still holds. If the fundamentals or technicals break, you cut it. If the only thing that’s breaking is X’s collective sanity, you hold.
The art is knowing the difference — and that’s what separates a patient trader from a stubborn one.
🔑 From Panic to Patience in Practice
So how do you go from reactive panic to steady patience? Try this framework:
• Zoom out — Look at the weekly or monthly chart before you sell on a 15-minute candle.
• Check the plan — Does your original thesis still make sense? If yes, why exit?
• Limit your exposure — Never risk so much that a drawdown keeps you awake.
• Reframe the noise — Headlines pass. Trends endure.
That’s the difference between panic selling and strategic holding.
🎯 Bottom Line
Holding through noise is as much psychology as strategy. It’s about resisting the knee-jerk sell, trusting your process, and understanding that volatility is part of the game. The traders who master patience don’t just survive noise — they profit from those who can’t handle it.
So next time the S&P 500 heatmap lights up red, ask yourself if this is the end of it, or just another chapter in the endless saga of market drama? More often than not, it’s the latter.
Off to you : What's your strategy when you need to filter the noise out? Share your thoughts in the comment section!
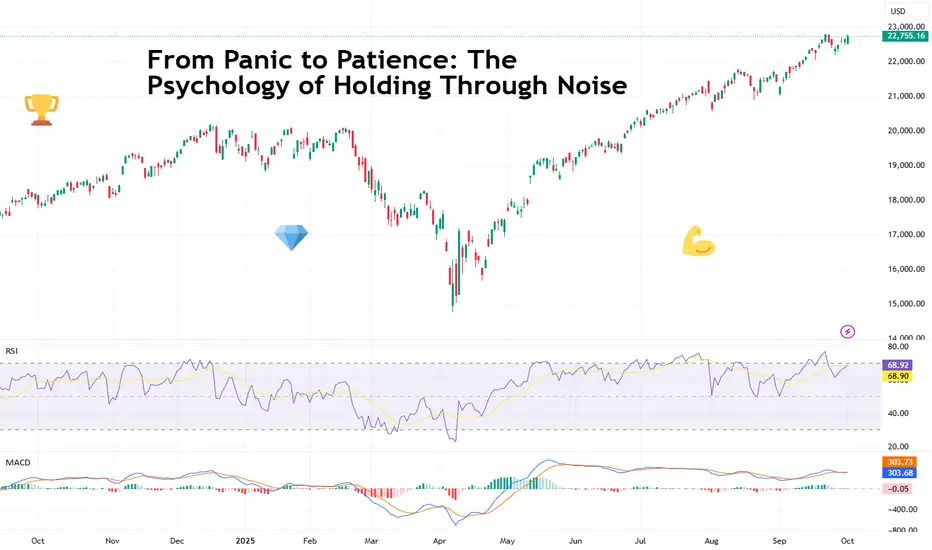
BTC ULTIMATUM: True Top Reached, Blow-Off Phase About to ExplodeHey everyone,
Let's cut through the noise. The market is flooded with conflicting signals about a potential market top, but the data on the chart is telling a crystal clear story. Many are getting this cycle wrong, so pay close attention.
Here's the truth: The Actual Cycle TOP was established back in JANUARY 2025.
That's right. However, the timing didn't align with the simplistic 4-year cycle models many were following. The definitive confirmation came with the recent powerful breakout and close above the $109,000 level. This wasn't a false breakout; it was the market screaming that the cycle is far from over.
What we are witnessing now is not the end of the bull market. This is the launch sequence for an extensive BLOW-OFF TOP formation.
The Current Setup: Building the Blow off top Launchpad
As the chart clearly shows, we are currently in a pullback, retesting the most critical zone in the market right now: the $109k - $106k area.
Why is this zone so important?
• This is the former resistance (the January '25 top) that has now become the ultimate support. • This is the Blow-Off Top Base.
• The bulls are making a strong stand here, working to absorb selling pressure and accumulate for the next and likely final major parabolic rally of this cycle.
Think of this consolidation as the coiling of a spring. The longer and tighter it holds this base, the more explosive the eventual breakout will be.
The Path Ahead: Key Levels to Watch
1. The Imperative Support (The Base): $109,000 - $106,000
This is the line in the sand. A sustained close below $106,000 would invalidate the immediate blow-off top scenario and signal a much deeper correction is likely. As long as we hold above here, the macro structure is overwhelmingly bullish.
2. The Immediate Resistance (The Trigger): $124,000
This is the next major hurdle. A decisive break and close above $124,000 will be the signal that the blow-off top phase is accelerating. It will confirm that the base is solid and the engines are firing for the climb to the projected target zone.
3. The Projected Target Zone: $145,000 - $160,000
Based on the chart's projections, a successful hold of the base and a break above $124k opens the path towards the $145,000 to $160,000 range. This is where we could see the euphoric, parabolic peak of this entire Bitcoin cycle.
Stop listening to the top-callers who are early. The market structure is clear:
• We HAVE broken the previous cycle high.
• We ARE building a massive support base above it.
• We ARE poised for a historic blow-off top.
MY PLAN:
• Aggressive: Accumulate in the $109k-$106k base zone with tight stops below.
• Conservative: Wait for a confirmed breakout and close above $124,000 to enter for the parabolic move.
The journey to six figures is behind us. The journey to the cycle peak is just getting started.
Stay disciplined, trade the levels, and ignore the noise.
Like, follow, and share your thoughts below! Are you accumulating in the base, or waiting for the $124k breakout confirmation?
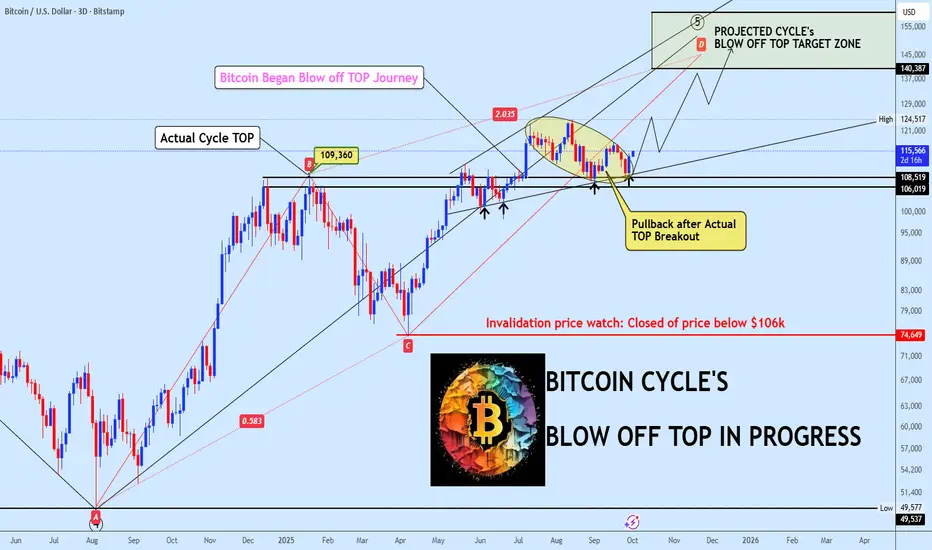
Support and Resistance in Crypto: Why They Work1. Introduction
Every trader has heard of support and resistance. They are the most common levels drawn on charts, and for good reason: markets consistently react to them.
But what makes these levels so powerful? Why do millions of traders watch them and why does price often respect them?
Support and resistance are not magic. They are simply psychological levels, supply and demand zones, and self-fulfilling expectations all converging.
2. Defining Support and Resistance
Support: A price level where demand is strong enough to stop price from falling further. Traders buy here, creating a “floor.”
Resistance: A price level where selling pressure outweighs demand, stopping price from rising further. Traders sell here, creating a “ceiling.”
Think of them as zones, not exact lines. Markets are messy, and price often wicks through before reacting.
3. Why They Work: The Psychology
Support and resistance function because traders remember these levels:
Fear & Greed: Traders who missed buying at support wait for price to return. Sellers at resistance wait to “get out at breakeven.”
Anchoring: Once a level has reacted multiple times, more traders trust it.
Stop Placement: Traders often put stop losses beyond support/resistance, creating liquidity pools that attract price.
In short: these levels represent collective memory of the market.
4. The Supply and Demand Connection
Behind every level is a simple truth: markets move because of imbalances.
At support, buyers step in, creating excess demand.
At resistance, sellers dominate, creating excess supply.
5. Types of Support and Resistance
Not all levels are created equal. Common ones include:
Horizontal Levels – obvious highs/lows on the chart.
Trendlines – diagonal support/resistance following direction of trend.
Moving Averages – dynamic levels that act as support in uptrends and resistance in downtrends.
Psychological Round Numbers – like $1,000 or $2,000 on ETH, where traders naturally cluster orders.
6. How Traders Use Them
Support and resistance are used in multiple ways:
Entries: Buying near support, selling near resistance.
Exits: Taking profit at resistance, cutting loss below support.
Stop Loss Placement: Stops often go just below support or above resistance.
Breakouts: When resistance breaks, it can turn into new support (and vice versa).
7. Limitations and Traps
Support and resistance are not invincible.
False Breakouts: Price can wick beyond levels to trigger stops before reversing.
Changing Market Conditions: A strong support can fail in a new trend.
Overcrowding: When everyone sees the same level, liquidity hunts occur.
Good traders combine S/R with confirmation, volume, candlestick signals, or broader market context.
8. Closing Thought
Support and resistance work because markets are driven by human behavior and collective memory. They reflect where buyers and sellers previously fought and where they are likely to fight again.
But the real edge isn’t just knowing the levels. It’s knowing how to act when price reaches them, and how to manage risk if they fail.
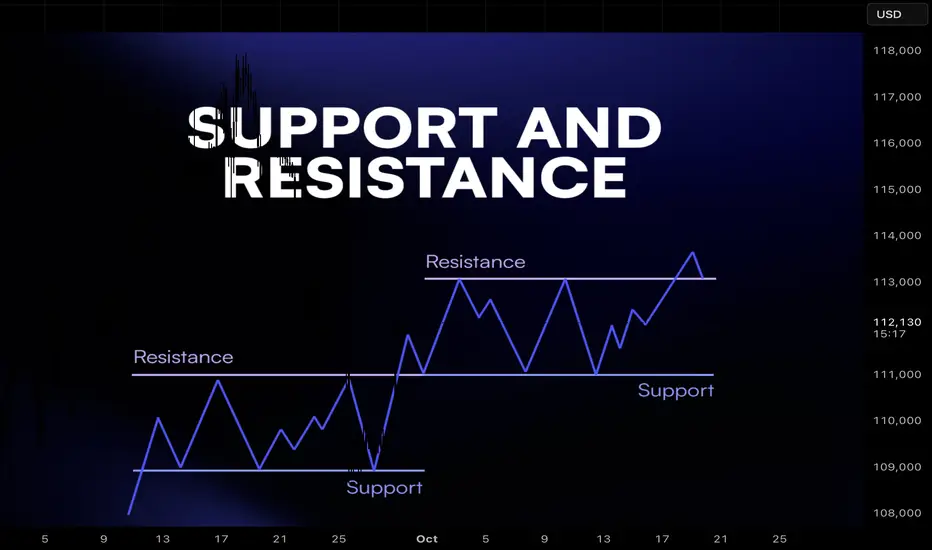
BMNR Technical Outlook: A Textbook PlayStructure and Pattern Recognition
BMNR has developed a constructive base while holding its broader uptrend structure. The chart highlights the potential formation of a double bottom reversal, a classical pattern that often signals the exhaustion of selling pressure and a shift toward accumulation. The neckline aligns closely with recent liquidity zones (LQ), providing a clear reference point for confirmation.
Key Levels and Setups
Price is currently consolidating around the $50–$52 range, supported by the trendline from early August. Above, the immediate target lies at the $57–$60 liquidity zone, followed by a higher expansion opportunity toward $65–$67. If momentum persists, the upper extension into $71+ remains in play. A break and sustained close below the ascending trendline, however, would invalidate the structure and shift focus back to the mid-$40s.
Volume Profile and Momentum
The volume profile confirms heavy participation around the $50 area, creating a strong base of support. As price reclaims the 200 EMA and breaks above local resistance, order flow is likely to accelerate toward higher supply zones. This aligns with the thesis that any breakout above neckline resistance could trigger a measured move targeting the mid-$60s.
Outlook and Scenarios
Bullish Case: A confirmed breakout above the $57–$60 zone validates the double bottom structure, opening the path toward $65–$67 and potentially $71.
Bearish Case: Failure to hold the $50 trendline support exposes BMNR to a deeper retracement, with downside risk into the low-to-mid $40s.
Conclusion
BMNR sits at a technical crossroads. While downside risk remains if $50 fails, the pattern structure and volume dynamics favor continuation higher if resistance breaks. Traders should monitor the neckline breakout as the defining signal for near-term direction.
