Market Structure OverviewPrice has formed a bullish BOS (Break of Structure) on M15.
Currently trading below PDH, showing signs of short-term exhaustion.
Price is approaching a premium zone after impulsive move up.
A clear 15M FVG + OB confluence is marked below current price.
⚠️ Key Concept (Important)
Even though structure is bullish, price is now in premium, which makes it less favorable for buys and opens room for a corrective short.
📉 Short Setup Plan (Conditional)
🧠 Bias:
Short-term pullback (counter-trend move)
📍 Entry Zone:
Look for price to tap into current premium area (near PDH / highs)
OR wait for a lower high formation
✅ Confirmation Required:
M5/M15 CHoCH (Change of Character) to downside
Bearish displacement candle
Internal liquidity sweep before drop
👉 No confirmation = No trade
🎯 Targets
First target: Internal liquidity (recent lows)
Main target: 15M FVG + Order Block zone (your marked blue area)
🛑 Invalidation
Strong bullish continuation with acceptance above PDH
No bearish confirmation → setup becomes invalid
💡 Execution Model
Wait → Sweep → CHoCH → Entry on pullback
Keep risk controlled (≤1% as per your model)
⚖️ Summary
Market is bullish overall, but currently in premium
Expecting a short-term retracement into imbalance below
This is a reaction-based setup, not aggressive selling
📌 Disclaimer
This analysis is for educational purposes only, not financial advice. Always wait for confirmation and manage risk properly.
Community ideas

Silver (XAGUSD) Analysis next 24-48 HrsMy read for the next 24–48 hours:
Bias = volatile range with a slight bullish rebound risk, but medium-term pressure is still coming from USD/yields. Silver is bouncing today after a brutal March drawdown, yet the same macro forces that crushed it — a stronger dollar, higher Treasury yields, and fading Fed cut hopes — are still in place. Reuters reported silver rose alongside other precious metals on March 30, while the dollar stayed near a 10-month high and markets kept repricing toward fewer Fed cuts as oil-driven inflation fears intensified.
What is pushing silver down:
Silver is still being treated less like a pure safe haven and more like a rate-sensitive, industrial precious metal. The biggest bearish inputs are:
Stronger USD — Reuters said the dollar index was around 100.19 on March 30 and heading for its biggest monthly gain since July 2025;
higher yields — Reuters/market coverage put the U.S. 10-year near 4.4% late last week;
less chance of Fed easing because oil above $115 Brent is reviving inflation fears. Those three together raise the opportunity cost of holding non-yielding metals like silver.
What is pushing silver up:
There is still a real rebound / squeeze-up case. Silver has already had a violent washout in March, and today’s move looks like relief buying after oversold conditions. Reuters said silver was up 2.2% to $69.54/oz on March 27, and on March 30 silver was again part of a broader precious-metals rebound. Spot references around today show silver roughly back near $70–71/oz, after a very wide intraday range. That tells me short-covering is active and the market is vulnerable to fast upside pops if the dollar softens even a little.
The silver-specific fundamental backdrop is still better than the price action suggests:
The Silver Institute outlook cited by Reuters still points to a sixth straight annual supply deficit in 2026, with physical investment demand expected to rise. That is supportive underneath the market. But there is an offset: Reuters also reported the solar industry is accelerating efforts to reduce silver usage because high prices are pushing substitution toward copper-based technologies. So the structural story is still supportive, but not cleanly bullish near term.
Direction map from here:
Bullish path: XAGUSD likely pushes higher if markets get any combination of softer Fed tone, cooling oil, lower yields, or a pause in the USD rally. Because silver has already fallen hard this month, a small macro improvement could trigger a disproportionately sharp rebound.
Bearish path: XAGUSD likely rolls back down if Powell sounds hawkish, oil stays elevated, the dollar keeps climbing, or Friday’s U.S. labor data comes in firm enough to keep rate-cut hopes suppressed. That would reinforce the exact macro mix that has been weighing on silver.
Key event times to watch:
Today, Fed Chair Powell is due at 16:30 CEST and New York Fed President Williams later in the U.S. afternoon; then ISM Manufacturing for March is due Wednesday, 1 April, at 16:00 CEST; and U.S. payrolls for March are due Friday, 3 April, at 14:30 CEST. Those are the main catalysts most likely to move silver through USD/yields.
Bottom line:
For pure news flow, I would not call this a clean trend-up market yet. Near-term direction is binary:
Up if macro fear shifts from “higher inflation / higher rates” to “growth risk / softer Fed.”
Down if the market keeps focusing on higher oil → higher inflation → higher yields / stronger USD.
So the practical read is: short-term rebound possible, but headline risk still favors sharp two-way moves rather than a stable bull trend.
What charts are saying
4H HTF:
Price is rebounding from the 67.3–69.0 demand area.
But the broader 4H structure still shows a sequence of lower distribution areas overhead.
The nearest important overhead zone is roughly 71.60–72.00, then above that a heavier supply pocket around the low to mid-70s on your chart.
Interpretation:
This looks like a bounce inside a larger damaged structure, not yet a confirmed trend change.
15M MTF:
Price is grinding up with higher lows.
It is trading into a clear resistance cluster: Asia high ~70.83, then 71.28, then 71.59–71.60, then 71.603 previous-day / weak-high area.
My marked “premium sell zone” sits right above current price.
Interpretation:
Momentum is positive, but price is now entering the area where sellers are most likely to hit it.

$DASH Approaching Deep Liquidity — A+ Reversal Setup Loading
NASDAQ:DASH remains in a clear higher timeframe downtrend, trading below key value and failing to reclaim major resistance zones. Current price action is a weak consolidation inside discount, not a confirmed reversal. Bias still leans bearish until real liquidity is taken and reclaimed.
Recent price action shows a minor sell-side sweep around 30, but the reaction lacked displacement and momentum. This confirms it was not a true smart money entry. Real liquidity still sits deeper around the 27–30 zone, where equal lows and panic sell pressure are likely to trigger a stronger reaction.
From a positioning perspective, RSI remains flat and volume shows no expansion, indicating no strong participation yet. This supports the expectation of a deeper move before any valid reversal. Market is currently in a trap phase where early entries are likely to fail.
Going forward, watch for a sweep below 30 followed by strong bullish displacement and reclaim. Only then does a SAFE MODEL long become valid. Until that confirmation appears, patience remains key.

USDJPY BUY SETUPThe deal is expected to rise. The reason is that, based on the sub-structure and overall market, the four-hour timeframe is bullish. Additionally, on the market timeframe, the price is still rising because it rebounded from a buy order. And on the 15-minute timeframe, the market broke upwards.

SEI/USDT – Testing the Bottom of a Multi‑Year Descending ChannelBINANCE:SEIUSDT.P is currently trading at the lower boundary of a long‑term descending channel, a zone that historically acts as a high‑probability reaction area. Price has respected this structure for years, creating a clear pattern of lower highs and lower lows while moving cleanly between the channel’s boundaries.
🔍 Key Technical Factors
Price is sitting on the channel support, a level that has repeatedly triggered strong rebounds.
The midline has acted as dynamic resistance, suggesting that any bounce could target that area first.
Volume shows signs of compression, often a precursor to expansion.
📈 Bullish Scenario
A reaction from the lower boundary could trigger a relief move toward the midline, and potentially toward the upper boundary, leaving room for a significant percentage expansion if momentum confirms.
📉 Bearish Invalidation
A clean breakdown and acceptance below the channel would invalidate the bullish idea and open the door to new lows.
🎯 Why This Matters
Multi‑year structures like this often precede major shifts in trend. SEI is at a point where risk is defined and potential reward is asymmetrical.

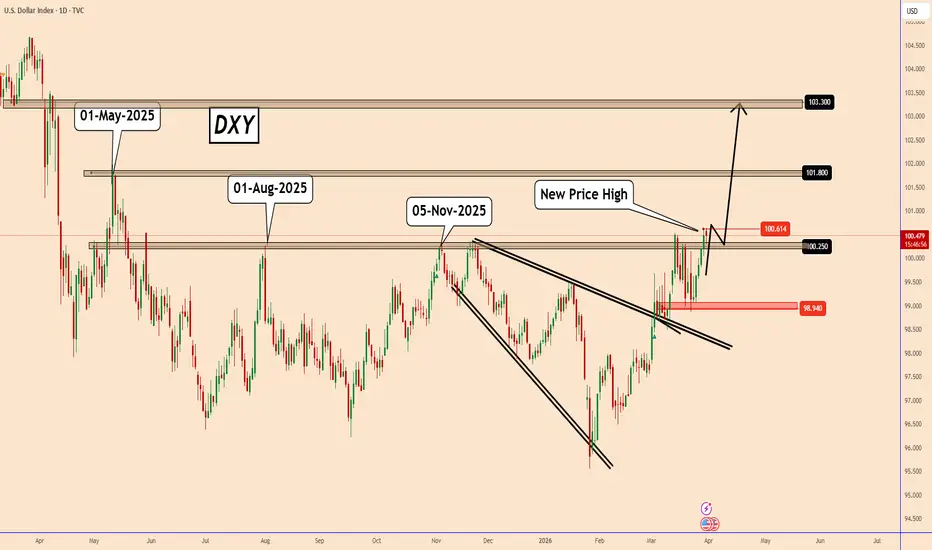
US Dollar Index Resumes Bullish Path After Key Support ReactionUS Dollar Index Resumes Bullish Path After Key Support Reaction
Over the past week, DXY made a deeper correction to 98.94, where it also found very strong support.
DXY returned to the top of the structure by creating a new historical record level near 100.60.
So far, the price is rising as we expected from our old analysis and considering the way the US dollar has been behaving recently, the chances of DXY continuing the upward movement are higher.
It may take time considering that Trump is still making the markets a mess every day, but the direction remains up, but with no signs of reversal.
Key targets:
101.8 and 103.30
You may find more details in the chart.
Thank you and good luck! 🍀
❤️ If this analysis helps your trading day, please support it with a like or comment ❤️
Previous analysis:
Bearish Trap into Bullish Continuation – XAU/USD 45M Analysis
🔍 Market Structure Overview
Price initially moved within a descending channel, maintaining a clear bearish structure with lower highs and lower lows.
A breakout from the channel marked the first shift in momentum, indicating weakening bearish control.
Following the breakout, price established a series of higher lows, confirming a short-term bullish market structure.
⚠️ Fake Breakout & Liquidity Grab
The highlighted “fake upward” move suggests a liquidity sweep above minor highs.
This type of move often traps breakout traders before price rebalances.
The sharp rejection from the recent high reinforces the idea of smart money taking liquidity before continuation.
🟢 Key Zones to Watch
Support Zone (4,500 – 4,520):
Strong demand area aligned with previous consolidation and structure.
Also acts as a potential entry zone for buyers.
Resistance Zone (4,630 – 4,650):
Major supply area where price previously rejected.
Serves as the primary upside target.
📈 Current Price Behavior
Price is retracing from the recent spike and moving toward the support zone.
This pullback appears corrective rather than impulsive, suggesting continuation rather than reversal.
🎯 Trade Outlook
Bullish Scenario (Preferred):
Wait for price to tap into the support zone.
Look for confirmation (bullish engulfing, rejection wicks, structure break).
Target: Resistance zone above.
Bearish Scenario (Invalidation):
A strong break and close below the support zone would invalidate the bullish bias.
Could lead to a deeper retracement toward previous structure lows.
💡 Conclusion
The market is showing signs of a bullish continuation after a liquidity grab, with price likely to revisit the support zone before pushing higher. Patience for confirmation at key levels will be critical for high-probability entries.

A Buy to the Upside
price had to go tap the very last MNSR close the upside in 15minTf -- pin point entry

Polygon (POL) | Different timeframes tell same story | ShortingPOL just had a smaller breakdown and a failed MSB, which might lead to further downside movement, whereas on the bigger timeframe we are seeing the pressure to the major zone, where if we break it, we will be falling much, much lower from here...
More in-depth info is in the video—enjoy!
Swallow Academy

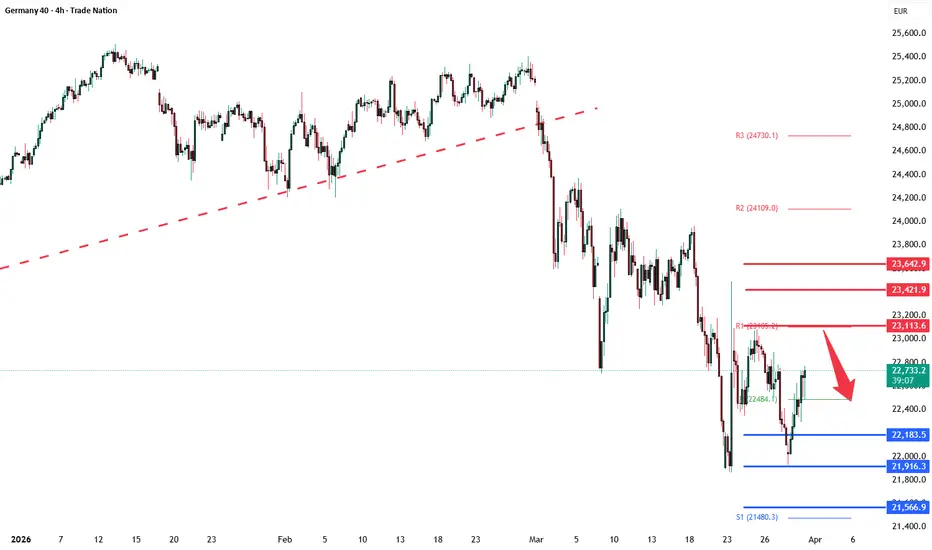
DAX Bearish sideways consolidation capped at 23,133The DAX continues to display a bearish outlook, in line with the prevailing downward trend. Recent price action suggests an oversold bounce back, potentially setting up for another move lower if resistance holds.
Key Level: 23,113
This zone, previously a consolidation area, now acts as a significant resistance level.
A failed test and rejection at 23,113 would likely resume the bearish momentum.
Downside targets include:
22,183 – Initial support
21,916 – Intermediate support
21,566 – Longer-term support level
Bullish Scenario (breakout above 23,133):
A confirmed breakout and daily close above 23,133 would invalidate the bearish setup.
In that case, potential upside resistance levels are:
23,420 – First resistance
24,640 – Further upside target
Conclusion
DAX remains under bearish pressure, with the 23,133 level acting as a key inflection point. As long as the price remains below this level, the bias favours further downside. Traders should watch for price confirmation around that level to assess the next move.
This communication is for informational purposes only and should not be viewed as any form of recommendation as to a particular course of action or as investment advice. It is not intended as an offer or solicitation for the purchase or sale of any financial instrument or as an official confirmation of any transaction. Opinions, estimates and assumptions expressed herein are made as of the date of this communication and are subject to change without notice. This communication has been prepared based upon information, including market prices, data and other information, believed to be reliable; however, Trade Nation does not warrant its completeness or accuracy. All market prices and market data contained in or attached to this communication are indicative and subject to change without notice.
Gold Holds 4510 — Breakout Building or Bull Trap Ahead?Gold is starting to look more constructive today after defending the 4510 support base and pushing back higher inside an ascending intraday structure. The rebound is not random. Price is reacting from a clean confluence zone where trend support, prior structure, and retracement logic all meet — and that is why this area matters.
From a technical point of view, the market is now trying to transition from correction into expansion. Buyers have managed to protect the recent lows, and as long as price remains above 4510, the short-term structure continues to favor recovery rather than immediate weakness. What I find important here is that the market is no longer reacting impulsively from the downside. It is beginning to build higher lows, and that usually tells us momentum is shifting, even if the larger trend still needs confirmation.
The next area to watch is the resistance band above current price, especially around 4620–4650. This is the first zone where upside momentum may slow and where the market will reveal whether this move has enough strength to continue. If buyers can keep control through that area, the next upside path opens toward 4693 and potentially 4796, which are the higher expansion targets shown on the chart.
That said, I would still stay measured here. Gold has improved technically, but it has not completely escaped the risk of a failed recovery. If price loses 4510, the current bullish structure weakens quickly and the move starts to look more like a temporary squeeze than a sustainable leg higher.
So for today, my view is simple:
as long as 4510 holds, I still favor the upside path and a continuation into higher resistance. But the real confirmation comes only if price can keep building above resistance instead of rejecting back into the range.
For now, gold is no longer trading like a market under immediate pressure.
It is trading like a market trying to recover — and today will show whether that recovery has real depth.

DOGE Refuses to Break Down — Upside Loading?DOGE Refuses to Break Down — Upside Loading?
For about 2 months, DOGE has been moving within a broader "Range Trading Pattern" with a well-defined support near 0.08800 and resistance at 0.10450.
Doge tested the support area these days and is likely to start the bullish move again from this area considering that the price has already reacted.
I am looking for the first target within the structure area near 0.09700 and if the price breaks this area, it could easily reach 0.10300.
You may find more details in the chart.
Thank you and good luck! 🍀
❤️ If this analysis helps your trading day, please support it with a like or comment ❤️

EURJPY Daily Analysis: Bullish Institutional DivergenceMy current view on EURJPY remains constructive, although price is testing a key technical area and must hold support to preserve the bullish structure. On the daily timeframe, the pair is retracing into the 182.00–183.00 demand zone after failing to break higher. I still interpret this as a correction within a broader uptrend rather than a confirmed reversal. Price continues to hold above the rising trendline and the base formed since mid-February. As long as 181.45–180.70 remains intact, I consider pullbacks as retracements. On the upside, I’m watching 184.60–184.90 first, with higher resistance around 186.00–186.20.
The COT data supports this view. EUR positioning is slightly net long, indicating no structural weakness, while JPY remains clearly bearish with increasing short exposure. This reinforces a favorable macro backdrop for EURJPY as long as yen pressure persists.
Seasonality is also aligned, with March historically positive and no significant deterioration expected into April. While not a trigger, it supports the broader directional bias.
Retail sentiment adds a contrarian signal, with around 65% of traders short. Combined with price holding support and institutional positioning, this suggests downside may remain limited unless support breaks decisively.
Overall, I maintain a mildly bullish bias. I’m watching for stabilization around 182.00–183.00 and a potential move toward 184.70, then 186.00+. A break below 181.45 would open the door to a deeper retracement toward 180.70 and shift my stance to neutral.

BTCUSDT Potential PullbackHi
**Disclaimer:** This analysis is for sharing purposes only and does not constitute financial advice. Always manage risk appropriately.
BTCUSDT – M30 / Daily Structural Outlook
BTCUSDT is currently presenting a **bearish structure on the M30 timeframe**, with price likely to **break below 67525**, targeting **66627**. A deeper retracement could extend toward the **66000 level**, which serves as a lower support area within the current short-term move.
However, from a higher timeframe perspective, the **daily range remains bullish**, indicating that the current M30 downside may be corrective within a broader bullish context.
To the upside, two key resistance levels are identified:
* **70000** as the first major resistance
* **71446** as an extended bullish target if momentum continues
Execution Considerations :
* Short-term bias: **bearish below 67525**
* Monitor downside targets: **66627 → 66000**
* Treat M30 bearish move as **corrective within daily bullish range**
* Watch for **reversal behavior at 66000–66627 zone**
* Upside continuation valid toward **70000 → 71446** upon structure shift
High-risk setup.
Happy Trading.
K.

BITCOINBitcoin is currently showing strong potential for a bullish continuation, supported by both technical structure and fundamental strengthThe market is gradually shifting from consolidation into a possible expansion phase, indicating that buyers are preparing to take control.
1. Safe-Haven Demand
Bitcoin remains a preferred asset during global uncertainty. Ongoing geopolitical tensions and economic instability continue to drive investors toward gold as a store of value.
2. Weakness in the US Dollar
A softer dollar increases Bitcoin attractiveness. When the USD declines, Bitcoinbecomes cheaper for global investors, boosting demand and pushing prices higher.
3. Interest Rate Expectations
If central banks slow down rate hikes or signal future cuts, gold tends to rally. Lower interest rates reduce the opportunity cost of holding non-yielding assets like gold.
Conclusion
Bitcoin is positioning itself for a potential bullish rally, supported by strong fundamentals and a solid technical base. Any dips should be monitored as buying opportunities, with the market likely aiming for higher resistance zones in the near term.

#DOGEUSDT – Short Setup from Key Supply Zone#DOGE
The price is moving within an ascending channel on the hourly timeframe. It has reached the lower boundary and is heading towards a breakout. A retest of this boundary is expected.
The Relative Strength Index (RSI) indicates a downward trend, and this trend is likely to continue due to the overbought condition.
There is a key resistance zone in green at 0.09700, which the price has bounced off several times, making it a strong support level.
A consolidation trend is observed below the 100-period moving average, which we are approaching. This trend supports a decline towards this level.
Entry Price: 0.09300
Target 1: 0.09180
Target 2: 0.09060
Target 3: 0.08930
Stop Loss: At the resistance zone in green.
Remember this simple rule: Manage your money wisely.
For any questions, please leave a comment.
Thank you.

$BTC – Weekly Chop ZoneHello traders! New week, new plan!
Watching this on the lower timeframe for Bitcoin.
For now, I’m expecting price to mostly chop around the 65–69k range. Momentum looks a bit indecisive here, so we could see a few more tests into the 68–69k zone before any clearer direction shows up.
As long as we stay below the highs, this area could continue to act as a local range where price just moves back and forth for a bit.
Invalidation for this idea would be a clean reclaim of 70.6k, which would likely shift momentum and open the door for further upside.
If that doesn’t happen, I’d be watching for a potential bounce somewhere around the 62–60k region, which could act as the next area of interest if we see another leg down.

NEAR Retests Major Support After Early March Rally NEAR had a strong rally in early March and is now pulling back into a major support zone. If this level holds, it could offer a solid long spot opportunity.
A bounce from support may push price toward the next resistance areas, while a break below support would invalidate the setup.
Trading Levels:
Entry: $1.15 - $1.20
TP1: $1.40 - $1.60
TP2: $1.80 - $2.10
SL: Below $1.12

Liquidity sweepThis play is a continuation play and we should hold above that level, we have bullish divergence on the 5 min time frame. We should continue up to sweep the liquidity marked on the chart!

UPDATE ON XAU/USD ANALYSISXAU/USD 4H - As you can see price has played out perfectly, trading down and into the zone give below, it didn't come to clear the zone entirely but it did come to clear the imbalance above.
We have since seen price trade us higher, going on to set new highs. I am expecting a new bullish leg to be formed from this longer term. For those who didn't get involved, I can see price pulling back, presenting another opportunity.
Once price has pulled back and provided us with entry criteria I will be sure to let you all know, as this market I feel will be bullish now for sometime correcting the bearish move we have had as of recent.
It is always a safe bet buying into this market even with the overall bias leaning towards a bearish market and this is because XAU is a precious metal and realistically should be appreciating overtime. I will keep you all posted with my next steps.

Gold Market OverviewGold has had one of the most remarkable runs in recent memory — and 2026 has already proven that the story is far from over. Whether you are a seasoned trader or just beginning to understand precious metals, this overview breaks down what is driving the gold market right now and what it means for your approach.
Where Gold Stands Today
As of March 30, 2026, gold is currently trading around $4,533 per ounce. That figure tells only part of the story. Gold began the year at $4,384 on January 2 and surged to a record high of $5,589 on January 28 — before experiencing significant volatility throughout February and into Q1.
For traders, this kind of range — over $1,400 within a single quarter — is both an opportunity and a warning. It demands respect for risk management above all else.
What Is Actually Driving This Market
Understanding gold requires understanding its demand drivers — and right now there are several working simultaneously.
Central Bank Buying
This is the most structurally significant force in the gold market right now. China's central bank extended its gold purchases for a fifteenth consecutive month in January 2026, with official sector demand remaining a key structural support. This is not speculative activity — it is long-term strategic allocation by sovereign institutions, and it creates a persistent demand floor beneath price.
For the first time since 1996, gold now accounts for a larger share of central bank reserves than US Treasuries — a powerful signal of confidence in the metal's long-term value. When the institutions responsible for managing national wealth shift their allocation this significantly, it is worth paying attention.
The Dollar and Interest Rate Relationship
Gold and the US dollar have a well-established inverse relationship — when the dollar weakens, gold typically strengthens, and vice versa. Interest rates add another layer. Lower yields make it easier for non-yielding assets like gold to compete, and historically gold prices have risen around 6% on average in the 60 days following the start of a Fed rate-cutting cycle.
Markets have priced in a higher probability of three Fed rate cuts in 2026, up from two just a week prior — driven by soft US economic data including retail sales falling short of forecasts. For gold traders, Fed policy expectations are not background noise — they are a primary price driver.
Geopolitical Risk Premium
Geopolitical risks continue to underpin safe-haven demand, with tensions between the US and Iran persisting despite tentative diplomatic progress. Gold has historically absorbed uncertainty — and the current global environment is generating significant uncertainty across multiple fronts simultaneously.
ETF Flows
Institutional and retail investor participation through gold-backed ETFs adds an important layer of demand. In the third quarter of 2025, investor and central bank gold demand totaled around 980 tones — over 50% higher than the average over the previous four quarters. That kind of demand acceleration does not reverse overnight.
The Current Technical Picture
Since mid-March 2026, gold has fallen significantly from its highs. Technical indicators are currently showing bearish signals — a Dark Cloud Cover pattern formed in the $5,597 to $4,954 range, followed by a Bearish Engulfing pattern indicating strengthening downward momentum. The MACD has crossed the zero line from above into negative territory, and the RSI continues to decline with values around 47.
For traders this is important context. The longer-term structural story may remain bullish — but the short-term technical picture is suggesting caution. These two things are not contradictory. Strong fundamental narratives and bearish short-term technicals can coexist, and navigating that tension is precisely the skill that separates disciplined traders from reactive ones.
Key support to watch sits around the $4,300 level, with the $4,492 to $4,456 range currently acting as resistance.
What the Analysts Are Saying
The range of institutional forecasts for gold in 2026 is unusually wide — which itself tells you something about the level of uncertainty in the market.
On the bullish side, Wells Fargo has lifted its year-end 2026 gold target to $6,100 to $6,300 per ounce, while Deutsche Bank reiterated its $6,000 target, and UBS sees potential upside to $7,200 in an extreme scenario.
More conservative voices exist too. Bank of America predicts gold will remain around $5,000, while HSBC and Commerzbank expect gold to average in the mid to high $4,000s.
Ed Yardeni of Yardeni Research has lowered his year-end 2026 forecast from $6,000 to $5,000, while maintaining a longer-term target of $10,000 per ounce by the end of the decade.
The spread between these forecasts — from conservative to extreme bull case — reflects genuine disagreement about how durable the structural drivers are. That disagreement is the market. Your job as a trader is not to pick the right analyst but to manage your position according to what price is actually doing.
Three Things Every Gold Trader Should Understand
Gold is not just an inflation hedge anymore. The drivers have broadened significantly. Central bank de-dollarization strategies, geopolitical risk premiums, and ETF flow dynamics all influence price — sometimes independently of inflation data. Traders who reduce gold to a simple inflation story will miss important signals.
Volatility is structural right now. Gold traded in a range of $4,100 to nearly $5,600 in Q1 2026 alone. That is not a market for oversized positions or weak stop placements. Position sizing and risk management are not optional considerations — they are the difference between surviving the volatility and being eliminated by it.
The longer-term trend and the short-term setup are different conversations. Bullish fundamentals do not prevent sharp corrections. The January 2026 selloff erased significant gains in hours. Traders who conflate the macro story with their entry timing are taking on risk they may not fully appreciate.
Key Levels to Watch
For traders actively monitoring gold right now, these are the levels worth having on your chart:
Current price sits around $4,533. Resistance is concentrated in the $4,456 to $4,492 zone. Support to the downside sits around $4,300 — a level that multiple analysts reference as significant. Above, the $5,000 level remains psychologically important and represents a meaningful recovery target if bullish momentum reasserts itself.
Final Thought
Gold's structural story — central bank buying, dollar weakness expectations, geopolitical uncertainty, and ETF demand — remains largely intact. But the short-term technical picture is showing real bearish momentum following January's extreme highs.
The most useful position for any trader right now is not one of conviction about where gold is going — it is one of clarity about what price is actually doing. Watch the levels. Respect the technicals. Let structure guide your timing rather than the macro narrative.

ETHUSDT weekly chart update. ETHUSDT weekly chart shows a massive multi‑year rising channel structure intact since the 2021 lows, with price now squeezing into the upper half after a prolonged consolidation phase.
The long‑term ascending channel has defined ETH’s macro uptrend, with the recent leg bouncing from the midline around $2,400–$2,500 and now testing the upper parallel near $4,200–$4,400.
Recent weekly candles have printed higher lows consistently, confirming buyers defending the channel base, while the green arrow projection targets a measured move to $5,000–$5,500 if the top breaks cleanly.
Bullish bias holds as long as price stays above the channel midline and $2,800 support; a weekly close above $4,400 would validate the breakout and open the full channel top toward $6k+.
Risk of a pullback exists if it rejects from the top again, but the structure favors continuation higher given the clean trendline respect over the years.

Gold risingThe xauusd shows a potential pullback with good room to move up to the 61.80% Fibonacci retracement level; I hope this is a useful indicator. I will continue to make small, cautious purchases.
