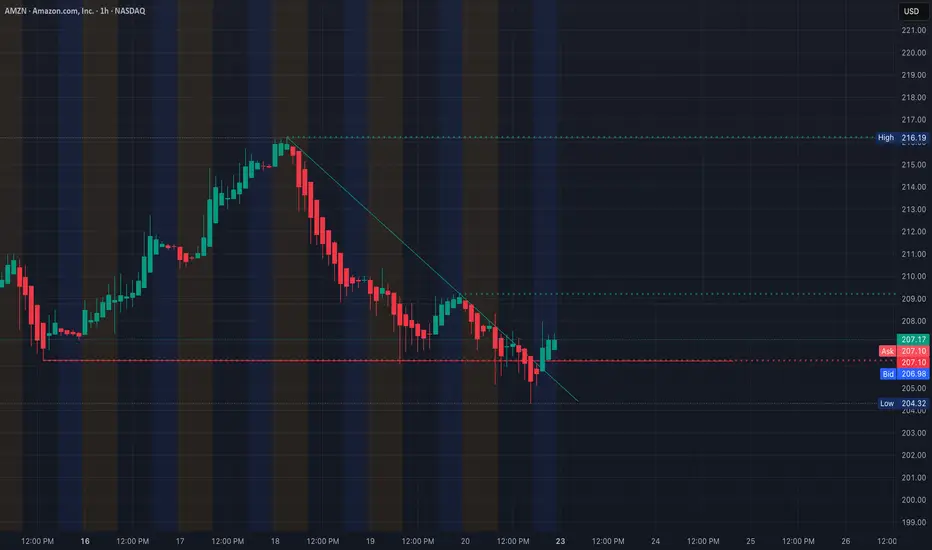
Looking at AMZN right now, price is coming off a selloff but starting to stabilize around the 205–207 area.
This looks like a base forming, but it’s still sitting right under a key resistance zone.
1H Structure - Downtrend Trying to Slow
On the 1H chart, AMZN has been trending lower with consistent lower highs.
The recent bounce from around 204 shows buyers stepping in, but price is still below the main supply area around 208–209.
That means sellers still have control unless this level breaks clean.

15-Min Structure - Range / Early Transition
On the 15-minute chart, price is starting to compress.
We had a push down, then a bounce, and now consolidation between 205–207.
* Liquidity was taken below 204
* Buyers reacted quickly
* Price reclaimed into the range
* Now it’s moving sideways
This is typical behavior when price is transitioning, but not trending yet.
Phase Context
We had distribution near 208–209 Then a markdown move down to 204 Now price is attempting to build a base
So currently, AMZN is between markdown and early accumulation — still neutral until we get confirmation.

GEX Context (Simple Read)
Options positioning shows strong resistance stacked above around 230–250.
That suggests upside may be capped unless momentum really builds.
On the downside, support is building around 195–200, which aligns with where buyers stepped in before.
So for now, GEX supports more of a range unless price breaks out of this zone.
Key Levels
Resistance - 208 to 209 Major resistance - 210+ Support - 205 Major support - 204 to 200
Scenarios
If AMZN breaks and holds above 209, we could see continuation toward the 210+ area.
If price rejects again and loses 204, the downtrend likely continues.
Simple View
Right now AMZN is:
* holding a base
* sitting under resistance
* waiting for direction
This is a decision zone, not a clean setup yet.
This looks like a base forming, but it’s still sitting right under a key resistance zone.
1H Structure - Downtrend Trying to Slow
On the 1H chart, AMZN has been trending lower with consistent lower highs.
The recent bounce from around 204 shows buyers stepping in, but price is still below the main supply area around 208–209.
That means sellers still have control unless this level breaks clean.
15-Min Structure - Range / Early Transition
On the 15-minute chart, price is starting to compress.
We had a push down, then a bounce, and now consolidation between 205–207.
* Liquidity was taken below 204
* Buyers reacted quickly
* Price reclaimed into the range
* Now it’s moving sideways
This is typical behavior when price is transitioning, but not trending yet.
Phase Context
We had distribution near 208–209 Then a markdown move down to 204 Now price is attempting to build a base
So currently, AMZN is between markdown and early accumulation — still neutral until we get confirmation.
GEX Context (Simple Read)
Options positioning shows strong resistance stacked above around 230–250.
That suggests upside may be capped unless momentum really builds.
On the downside, support is building around 195–200, which aligns with where buyers stepped in before.
So for now, GEX supports more of a range unless price breaks out of this zone.
Key Levels
Resistance - 208 to 209 Major resistance - 210+ Support - 205 Major support - 204 to 200
Scenarios
If AMZN breaks and holds above 209, we could see continuation toward the 210+ area.
If price rejects again and loses 204, the downtrend likely continues.
Simple View
Right now AMZN is:
* holding a base
* sitting under resistance
* waiting for direction
This is a decision zone, not a clean setup yet.
Trade active
AMZN still looks weak here. (Mar. 25)Price rejected the bounce area and is fading again under that short-term downtrend line, while the 207.24 zone is being tested. As long as price stays below 209.44 and especially below 211.14, the structure still favors more downside pressure.
The main level to watch now is 207.24. If that breaks cleanly, AMZN can slide back toward the 199 area first, and if sellers stay in control then the deeper demand zone near 176–170 becomes the bigger downside path.
For bulls, they need to reclaim 209.44 first, then push back above 211.14 to show this is not just another weak bounce. Until that happens, this still looks like a bearish consolidation with downside risk.
Disclaimer
The information and publications are not meant to be, and do not constitute, financial, investment, trading, or other types of advice or recommendations supplied or endorsed by TradingView. Read more in the Terms of Use.
Disclaimer
The information and publications are not meant to be, and do not constitute, financial, investment, trading, or other types of advice or recommendations supplied or endorsed by TradingView. Read more in the Terms of Use.